Download presentation
Presentation is loading. Please wait.

1
Evaluation of Social Norms Marketing Campaigns: Five Sites across 8 Years Adrienne Keller, Ph.D. National Social Norms Institute University of Virginia akeller@virginia.edu

2
Social Norms Interventions What they do NOT do What they DO Why they work Characteristics Evidence of effectiveness Limitations Conclusions

3
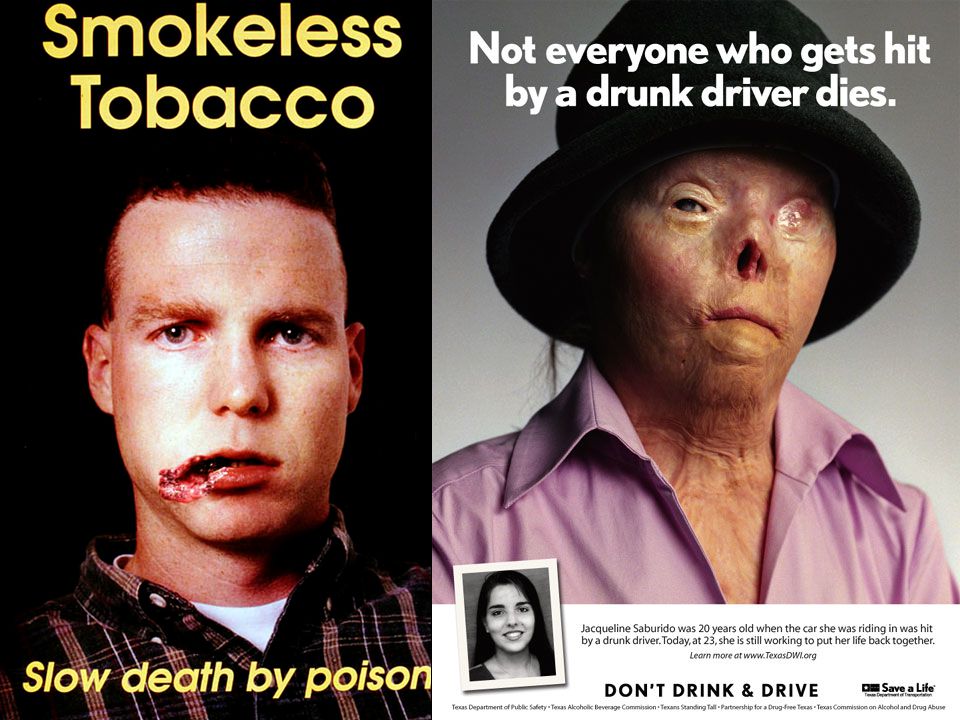
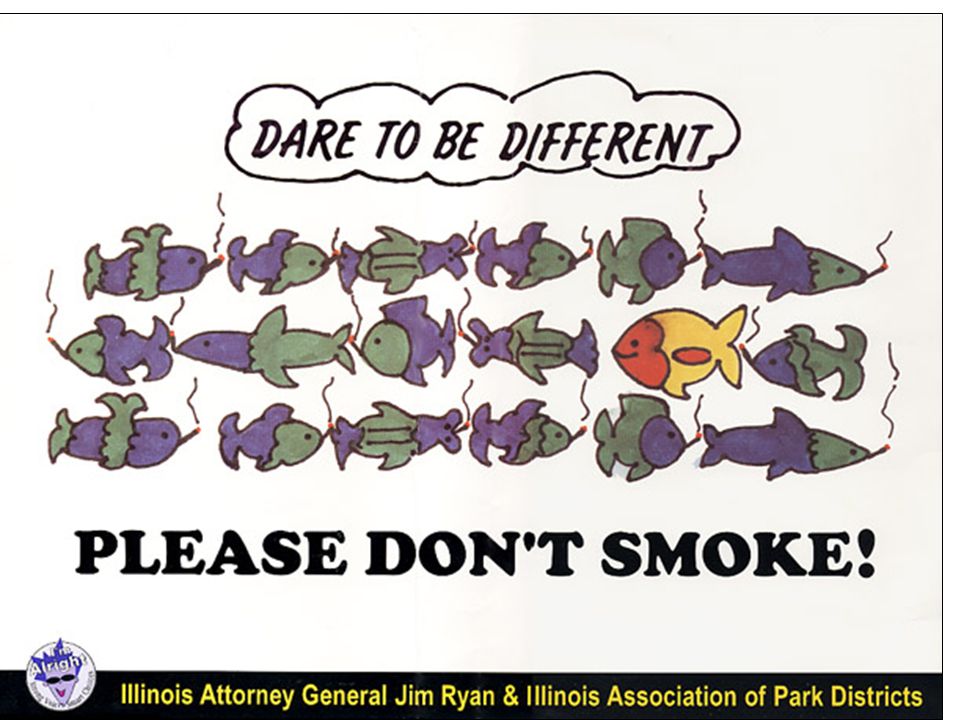
Social Norms Interventions What They Do NOT Do

13
Social Norms Interventions What They Do

15
Most (83%) Adults in Illinois Don’t Smoke* *Source: Centers for Disease Control, 2008 Tobacco Use in Illinois Adults
 Adults in Illinois Don’t Smoke* *Source: Centers for Disease Control, 2008 Tobacco Use in Illinois Adults")
16
Teach

17
Promote Self-Efficacy

18
Why do social norms interventions change behavior? Think about “peer pressure” And how others’ choices influence our own…

19
BUT… Perceptions may not conform to reality

20
Source: NCHA, Spring 2008, n= 80,121 Q.: How many alcoholic drinks did you have the last time you “partied” or socialized? Q.: How many alcoholic drinks do you think the typical student at your school had the last time they “partied” or socialized?

21
AND… We don’t like contradictions.

22
a MINORITY of our youth Are addicted to tobacco Do use drugs Do have a serious problem with alcohol. MOST of our youth Don’t smoke cigarettes Don’t do drugs Don’t use alcohol or have an alcohol problem.

23
Harm Reduction: Decrease alcohol-related morbidity & mortality DESIRED IMPACT Decrease Alcohol Use ANTICIPATED OUTCOMES Misperceived norm Correct perception of norm INTERVENTION GOAL IDENTIFIED ISSUES Personal alcohol misuse Misperceived norm INTERVENTION STRATEGY Social norms marketing campaign

24
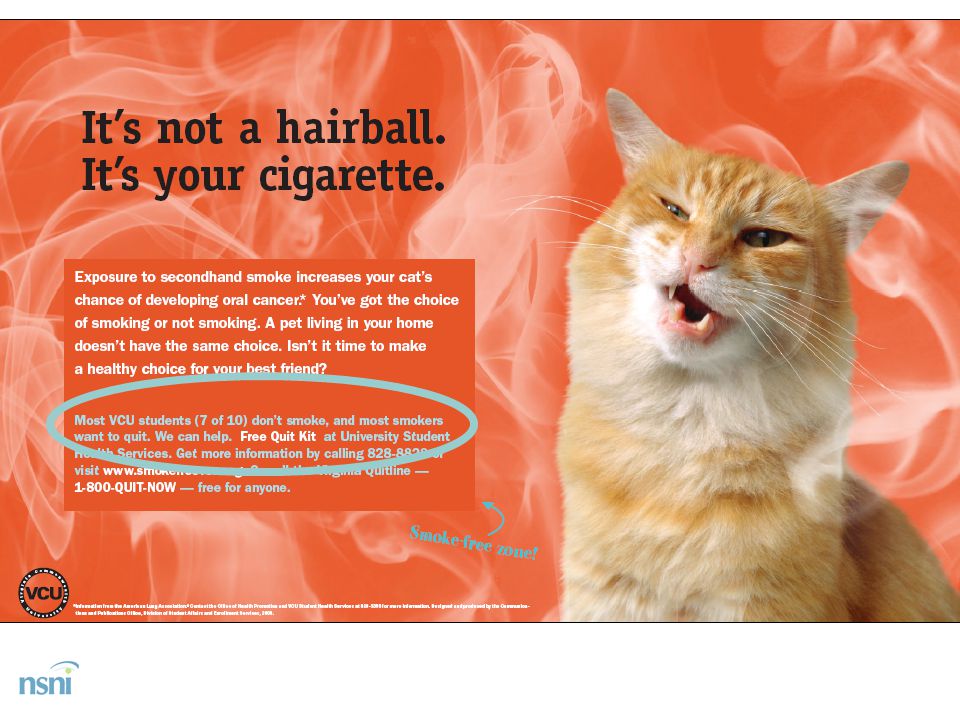
Characteristics of Social Norms Marketing

25
Positive Inclusive Empowering

28
Evidence of Effectiveness Good theory…great media… But does it work?

29
Participating Schools Five universities 4 public; 1 private Thru-out USA Between 14K to 46K students Funding: Anhauser-Busch Fndtn ACHA’s NCHA 2002 through 2009: some years

30
Social Norms Campaigns Each university developed its own campaign using the five step model

31
Five Step Model Choose the Audience Gather & Evaluate Data Develop & Test Message Implement Campaign Evaluate Effectiveness

33
Sample Characteristics Siten Mean Age % Female % White % Res Hall % Frat/ Soro Schl 1349123.2370.643.17.76.7 Schl 2529320.5769.57420.814.8 Schl 3217119.8463.675.860.75.3 Schl 4357920.3557.784.748.87.6 Schl 5701421.366.464.526.66.3

34
But did the samples change over the years?

35
YES for 1 and 2 Schl 1: Race/Ethnicity only % White % Hispanic Schl 2: Everything! Age % Female % White % in Res Hall % Frat/Soro

36
YES for 3 and 4 Schl 3: Residence only % in Res Hall Schl 4: Sex, Race, Residence % Female % White % in Res Hall

37
and YES for 5 Schl 5: Everything! Age % Female % White % in Res Hall % Frat/Soro So, we controlled for everything in our analyses.

38
Linear Mixed Effects Models Did perceptions change across years? Perception: ACHA-NCHA question Controlled for demographics Within each school Did use change across years? Use: ACHA-NCHA question Controlled for demographics Within each school By perception

39
Results for Perception Changes Type III Tests of Fixed Effects Source Numerator df Denominator dfFSig. Year of survey 721364.14337.585.000 school4183.65518.099.000

40
Results for Actual Drinks Changes Type III Tests of Fixed Effects a Source Numerator df Denominator dfFSig. Percvd drinks 127.070190.796.000 Year of survey 78043.17322.001.000 school46046.94730.466.000

41
Duh…Beautiful Stats… But what do they mean?

42
Mean Perceived Drinks 2002-2009

43
Mean Actual Drinks 2002-2009

44
Mean Perceived-Actual Drinks 02-09

45
Limitations Internal Validity Exposure not included in analysis Other interventions not included Related events not included Moderate to low sample response rates External Validity Population characteristics Environmental characteristics Implementation fidelity

46
Conclusions Misperceptions in all 5 schools Real world settings Diverse schools Actual drinks decreased in 4 of 5 “Gap” decreased in 2 of 5 Importance of longitudinal data Single year results unclear Effects & relationship only become clear over the years

47
Thank You Questions, Comments ???

Similar presentations


 786.>")


 CASE DPM DPNbS ODOS VPSA UVA ESHC OHP Health Promotion Survey (HPS) SOM ISAS.>")


 Trey Thomas 11/19/2012 Health 313_01 Drugs and Human Behavior.>")