Download presentation
Presentation is loading. Please wait.

5
Virtualized Workloads Supported Instant Messaging (IM) IM Conferencing Presence Enterprise Voice (PSTN) Audio/Video Conferencing Web Conferencing Application Sharing Remote Access, Federation (Edge Server) Response Group Service Persistent Chat Back-End Database Archiving/Monitoring Databases
 IM Conferencing Presence Enterprise Voice (PSTN) Audio/Video Conferencing Web Conferencing Application Sharing Remote Access, Federation (Edge Server) Response Group Service Persistent Chat Back-End Database Archiving/Monitoring Databases")
23
Guest Processor: 12 Cores Memory: 32 GB Disks: 2-C: 4-D: Network: 1GB Guest Processor: 12 Cores Memory: 32 GB Disks: 2-C: 4-D: Network: 1GB Guest Processor: 8 Cores Memory: 16 GB Disks: 2-C: 2-D: Network: 1GB Guest Processor: 8 Cores Memory: 16 GB Disks: 2-C: 2-D: Network: 1GB Guest Processor: 4 Cores Memory: 8 GB Disks: 2-C: Network: 1GB Guest Processor: 4 Cores Memory: 8 GB Disks: 2-C: Network: 1GB

24
Guest Processor: 12 Cores Memory: 32 GB Disks: 2-C: 4-D: Network: 1GB Guest Processor: 12 Cores Memory: 32 GB Disks: 2-C: 4-D: Network: 1GB Used for Lync Roles: Front ends Back Ends Standard Edition

25
Used for Lync Roles: Edge Servers Directors Guest Processor: 8 Cores Memory: 16 GB Disks: 2-C: 2-D: Network: 1GB Guest Processor: 8 Cores Memory: 16 GB Disks: 2-C: 2-D: Network: 1GB

26
Guest Processor: 4 Cores Memory: 8 GB Disks: 2-C: Network: 1GB Guest Processor: 4 Cores Memory: 8 GB Disks: 2-C: Network: 1GB Used for Lync Roles: Stress Agents

27
Front End Edge Server On the server side Frontends scale the fastest 3,333 Users / Front End Back End Stress Agent

28
Front End Edge Server The backend will scale with Pool count. 40,000 Users / Lync Pool Stress Agent Back End

29
Front End The edge server will scale with Pool count. 40,000 Users / Lync Pool Stress Agent Back End Edge Server

30
Front End The stress agents will scale the fastest 2,500 Users / Agent Back End Edge Server Stress Agent

34
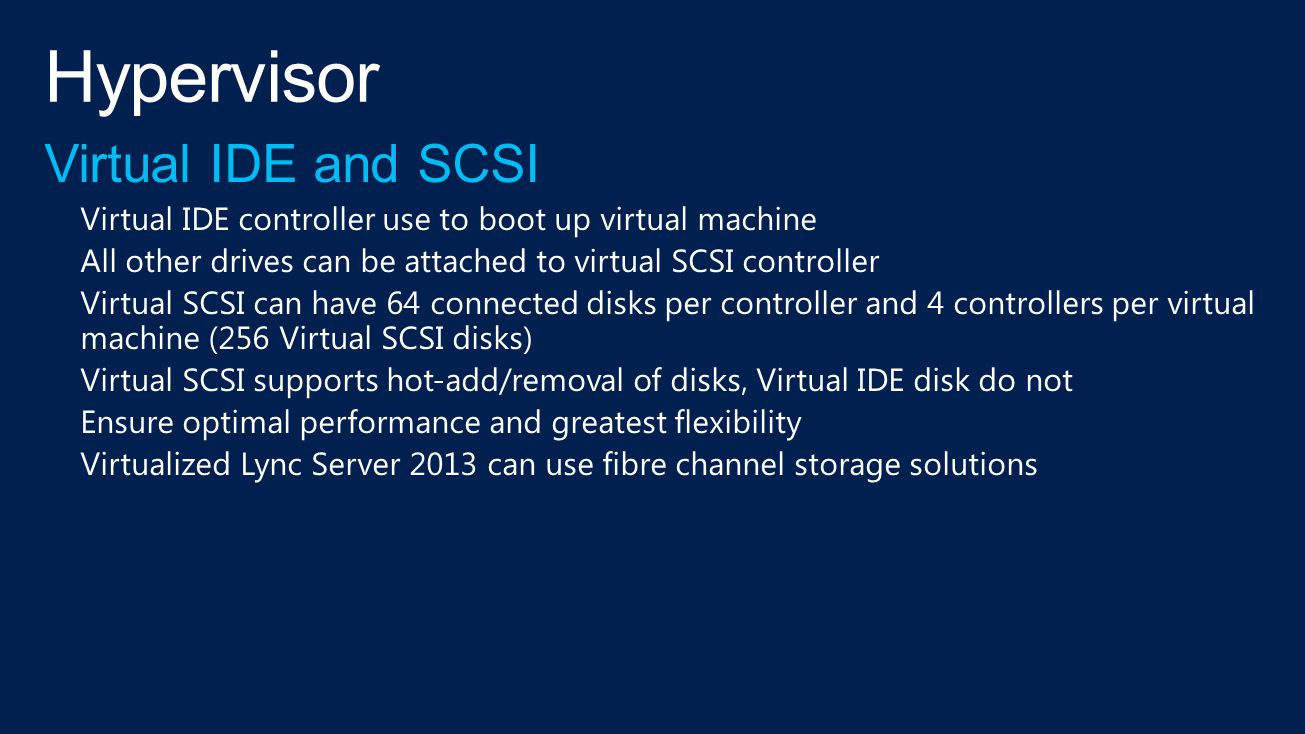
Storage LocationInternal External DisksDisks 0-3 Disks 4-7Disks 8-11 ArrayArray 0 (RAID 10)Array 1 (RAID 10)Array 2 (RAID 10)Array 3 (RAID 10) Capacity600 GB1.2 TB IOPS (100% Read %)700 IOPS IOPS (100% Write %)350 IOPS
Array 1 (RAID 10)Array 2 (RAID 10)Array 3 (RAID 10) Capacity600 GB1.2 TB IOPS (100% Read %)700 IOPS IOPS (100% Write %)350 IOPS")
35
Logical Proc Host01Host02Host03Host04Host05Host06Host07Host08 00-03FE01FE02FE03BE01BE02Edge01Edge02ST05 04-07 08-11 DC01DC02ST06 12-15 16-19OWAS01 BE03 (Witness) OWAS02 ST07 20-23 24-27 ST01ST02ST03 ST04ST08 28-31Reserved
 OWAS02 ST ST01ST02ST03 ST04ST Reserved")
40
Create users and groups Enable users for Lync Generate contact lists Create test location info. Changing “Average Contacts per User” will increase subscriptions per user and increase processor utilization on the Lync Frontends. Specify Stress Agents Service discovery Enable Modalities to test Set load variables such as number and frequency of PSTN calls Be mindful of the features you enabled and how you configure them. For instance the Reach client can increase processor utilization on the Frontends.

44
Once desired configuration determined Generate files Directory created for each stress agent Each directory should be copied the corresponding agent

45
Runs all the tool generated tests Runs a specific test such as instant messaging

48
CounterDescriptionHealthy Range \Processor Information(*)\ % Processor TimeCPU Utilization< 80% (highest core) \Memory\Available MbytesDisplays the amount of physical memory, in bytes, available to processes running on the computer.>20% total system MB \PhysicalDisk\Avg. Disk Sec/Read A key measure of disk latency representing the average time, in milliseconds, of each read to disk where > 20 is poor, <20 is good/fair, <12 is better, <8 is best 25 ms Red \PhysicalDisk\Avg. Disk sec/Write A key measure of disk latency representing the average time, in milliseconds, of each write to disk, where non-cached writes. (>20 poor, 4 poor, <4 fair, <2 better, <1 best ). For online transaction processing (OLTP) databases, the lower this number the better, especially for disks holding the transaction log. 25 ms Red LS:Usrv - DBStore\Usrv – Queue Latency (msec) Queue latency is the amount of time (in milliseconds) that it takes for a request to leave the Front End Server’s queue toward the back-end database. If this value by itself is high, you may have be encountering a network problem between the Front End Server and the SQL Server. If this value is high and Sproc Latency is high, it is most commonly a bottleneck with the Back End Server. <100ms sustained LS:USrv – DBStore\Usrv – Sproc Latency (msec) Sproc latency is the amount of time (in milliseconds) that it takes for the SQL Server database to process the request. This performance value is collected from the time the request leaves the Front End Server queue until that the request returns. If this value by itself is high, it is likely a bottleneck with the Back End Server. <100ms sustained \SQL Server Buffer Manager\Page life expectancy Tells, on average, how many seconds SQL Server expects a data page to stay in cache. The target on an OLTP system should be at least 300 (5 min). When under 300, this may indicate poor index design (leading to increased disk I/O and less effective use of memory) or, simply, a potential shortage of memory. A low value, below 3600 seconds (together with high lazy writes/sec and checkpoint pages/sec) indicates memory pressure. < 300 \MSSQL$RTC:Memory Manager\Total Server Memory(KB) Shows the amount of memory that SQL Server is currently using. This value should grow until it is equal to Target Server Memory, as it populates its caches and loads pages into memory. When it has finished, SQL Server is said to be in a “steady-state”. Until it is in steady-state, performance may be slow and IO may be higher. < 80% of physical memory \ASP.NET Apps v2.0.50727(*)\Requests Rejected < 80%
. For online transaction processing (OLTP) databases, the lower this number the better, especially for disks holding the transaction log. 25 ms Red LS:Usrv - DBStore\Usrv – Queue Latency (msec) Queue latency is the amount of time (in milliseconds) that it takes for a request to leave the Front End Server’s queue toward the back-end database. If this value by itself is high, you may have be encountering a network problem between the Front End Server and the SQL Server. If this value is high and Sproc Latency is high, it is most commonly a bottleneck with the Back End Server. <100ms sustained LS:USrv – DBStore\Usrv – Sproc Latency (msec) Sproc latency is the amount of time (in milliseconds) that it takes for the SQL Server database to process the request. This performance value is collected from the time the request leaves the Front End Server queue until that the request returns. If this value by itself is high, it is likely a bottleneck with the Back End Server. <100ms sustained \SQL Server Buffer Manager\Page life expectancy Tells, on average, how many seconds SQL Server expects a data page to stay in cache. The target on an OLTP system should be at least 300 (5 min). When under 300, this may indicate poor index design (leading to increased disk I/O and less effective use of memory) or, simply, a potential shortage of memory. A low value, below 3600 seconds (together with high lazy writes/sec and checkpoint pages/sec) indicates memory pressure. < 300 \MSSQL$RTC:Memory Manager\Total Server Memory(KB) Shows the amount of memory that SQL Server is currently using. This value should grow until it is equal to Target Server Memory, as it populates its caches and loads pages into memory. When it has finished, SQL Server is said to be in a steady-state . Until it is in steady-state, performance may be slow and IO may be higher. < 80% of physical memory \ASP.NET Apps v (*)\Requests Rejected < 80%.")
49
2 categories, service & resource instrumentation Add to performance collections Analyze to determine services are in a healthy state

50
Actual Counter Names LS:DATAMCU - MCU Health And Performance\DATAMCU - MCU Health State LS:AVMCU - MCU Health And Performance\AVMCU - MCU Health State LS:AsMcu - MCU Health And Performance\ASMCU - MCU Health State LS:ImMcu - MCU Health And Performance\IMMCU - MCU Health State

53
www.microsoft.com/learning http://microsoft.com/msdn http://microsoft.com/technet http://channel9.msdn.com/Events/TechEd

Similar presentations


 IM Conferencing Presence Enterprise Voice (PSTN) Audio/Video Conferencing Web Conferencing.>")
 Chapter 1: Designing the Hardware and Software.>")


