Download presentation
Presentation is loading. Please wait.

1
Governor Response Sequence Bob Green Garland Power and Light ERCOT Future AS Workshop January 20, 2014

2
You get the idea: if the power generated exceeds the load, frequency rises. If the generator power is less than the total loads, frequency declines

3
Governor Response Issues Traditional training simplifies the reason for frequency deviations from 60HZ. See “You get the idea” on the previous slide. In reality, power generated always equals the load. This training module describes what actually causes frequency deviations: mechanical power into a turbine not being equal to the electrical power output of the connected generator. The trip of a large generator is used to illustrate the process.

4
Voltage Regulator Armature Turbine Valves Energy Source Boiler Reactor Penstock Field Auxiliary Load Transient Reactance Gross Metering Step – Up Transform er To Load Net Metering Governor Response Schematic Governor

5
Loss of Generation - 1 In response to a unit trip, each real generator in the interconnected system increases their MW output in proportion to their electrical distance from where the generator tripped. The rotating kinetic energy in each tandem turbine-generator assembly supports the increased instantaneous power output. With power output greater than the power input, shaft speed [frequency] decreases.

6
Torque and Inertial Energy Steam input hits turbine blades creating torque that increases rotational speed of the T-G which in turn increases the kinetic (inertial) energy. When the electrical torque is greater than mechanical torque, the rotation slows extracting stored inertial energy from the mass.

7
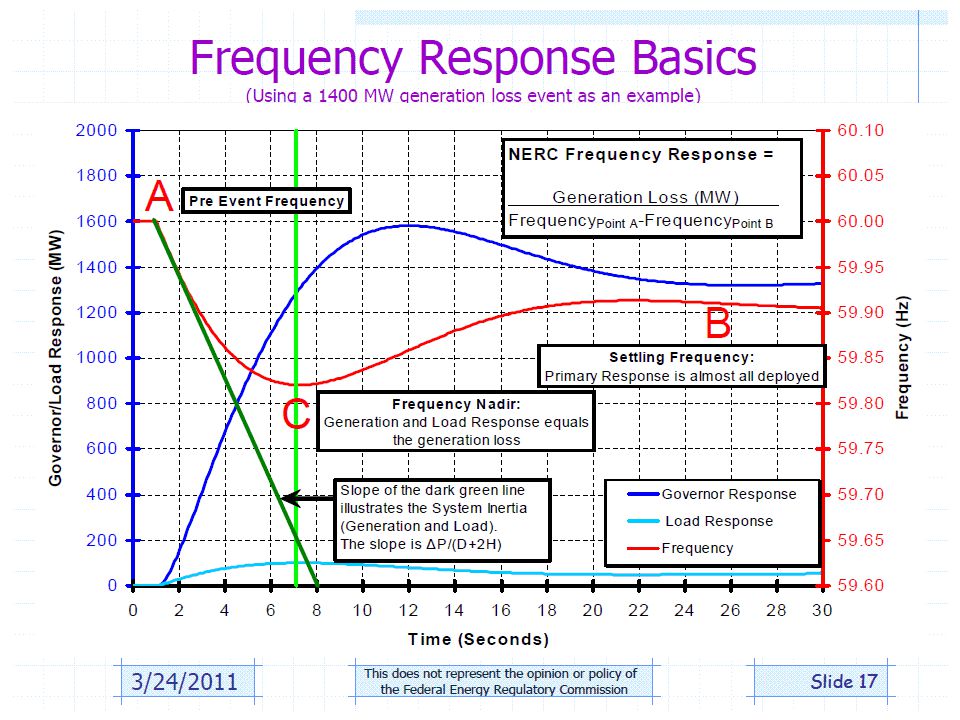
Loss of Generation - 2 The governors sense the slower speed and open valves between the mechanical energy sources [boiler, etc.] and the turbine to balance the generator mechanical input with the electrical output. When the mechanical input equals the increased electrical output, the frequency stop decreasing [this is called the C point]. The frequency increases as the kinetic energy is replaced and settles at a new steady state frequency value [this is called the B point].
![Loss of Generation - 2 The governors sense the slower speed and open valves between the mechanical energy sources [boiler, etc.] and the turbine to balance the generator mechanical input with the electrical output.](http://images.slideplayer.com/19/5822234/slides/slide_7.jpg "When the mechanical input equals the increased electrical output, the frequency stop decreasing [this is called the C point]. The frequency increases as the kinetic energy is replaced and settles at a new steady state frequency value [this is called the B point]..")
8
Loss of Generation - 3 The transition from the initial steady-state frequency [the B point] to restoring frequency to the scheduled value normally consists of sustained power plant control and control from the center control [AGC/LFC]. 1.Plant controllers need to recognize the higher desired output [MW] due to low frequency. 2.Control Centers need to send AGC signals to increase the governor set-points and restore frequency to schedule [usually 60 HZ].
![Loss of Generation - 3 The transition from the initial steady-state frequency [the B point] to restoring frequency to the scheduled value normally consists of sustained power plant control and control from the center control [AGC/LFC].](http://images.slideplayer.com/19/5822234/slides/slide_8.jpg "1.Plant controllers need to recognize the higher desired output [MW] due to low frequency. 2.Control Centers need to send AGC signals to increase the governor set-points and restore frequency to schedule [usually 60 HZ]..")
9
Loss of Generation - 4 Traditional Control Areas and the ERCOT Zonal Market typically started sending LFC control within 10 seconds of a unit trip. – Control Areas responded to a steady ACE value. – ERCOT Zonal QSEs responded to a Responsive Reserve deployment. ERCOT Nodal sends RegUp deployments to QSEs but waits approximately 60 seconds for SCED to calculate new Base Points utilizing capacity released by RRS deployments.

10
Loss of Generation - 5

12
Closing Misunderstandings Frequency Nadir is where the total transient mechanical turbine input equals the total electrical generator output [not the system load]. Slope of the dark green line is also influenced by whether the generator trips [steep slope] or if the turbine trips [generator stays connected to the grid for several seconds]. Settling Frequency is where the governors have driven the steady-state mechanical turbine input equal to the electrical generator output.
![Closing Misunderstandings Frequency Nadir is where the total transient mechanical turbine input equals the total electrical generator output [not the system load].](http://images.slideplayer.com/19/5822234/slides/slide_12.jpg "Slope of the dark green line is also influenced by whether the generator trips [steep slope] or if the turbine trips [generator stays connected to the grid for several seconds]. Settling Frequency is where the governors have driven the steady-state mechanical turbine input equal to the electrical generator output..")
13
Review of Frequency Control Steps 1.Electrical/mechanical energy imbalance caused by a change in load or change in generation 2.Turbine-generator shaft speeds [frequency] increase or decrease 3.Initial governor response due to the resulting change in frequency 4.Stabilizing frequency at new steady-state value 5.Restoring scheduled frequency [and interchange] using Automatic Generation Control 6.Preparing for next imbalance
![Review of Frequency Control Steps 1.Electrical/mechanical energy imbalance caused by a change in load or change in generation 2.Turbine-generator shaft speeds [frequency] increase or decrease 3.Initial governor response due to the resulting change in frequency 4.Stabilizing frequency at new steady-state value 5.Restoring scheduled frequency [and interchange] using Automatic Generation Control 6.Preparing for next imbalance](http://images.slideplayer.com/19/5822234/slides/slide_13.jpg "Review of Frequency Control Steps 1.Electrical/mechanical energy imbalance caused by a change in load or change in generation 2.Turbine-generator shaft speeds [frequency] increase or decrease 3.Initial governor response due to the resulting change in frequency 4.Stabilizing frequency at new steady-state value 5.Restoring scheduled frequency [and interchange] using Automatic Generation Control 6.Preparing for next imbalance")
14
Primary versus Secondary Frequency Control

15
After Governor Response to 7 MW of Load Added

16
After AGC Secondary Frequency Control

17
Primary ControlSecondary or Supplementary Control Common NameGovernor Control/ResponseAGC Control/Response Function-GenericHolds the system together as load changes occur and also as un-commanded generation excursions occur Shifts generation between units to achieve security and economic objectives plus restores frequency to the rated value. Function-TechnicalProvides the correct amount of mechanical input to turbines to match the electrical output of the corresponding generators Changes the 60HZ governor set-points of the units to achieve scheduled values established by the market. Control InputFrequency/rotational speed of the turbineIn ERCOT, the SCE for the portfolio of units Control Time ConstantFast - SecondsSlower - Tens of seconds and minutes Style of ControlLocal within the Units/PGCs—A QSE has no direct control over governor response. Centralized from ERCOT to Units via QSEs Performance Optimization Having more governors on-line (with a given droop characteristic) will minimize the magnitude of frequency deviations Having more units being controlled by AGC will minimize the duration of frequency deviations Key ParametersSteady state speed characteristic (droop), governor dead-band, first stage boiler pressure (steam units) and head (hydro units) Base power schedule plus deployments of balancing energy, regulation energy, responsive and non-spinning reserve. AGC dead-band, gains and frequency bias term. Market CharacteristicsIf there ever is a governor response market, there will probably be bids, awards and settlement, but the market will never deploy the governor response. Bids, awards, deployments and settlement through the Ancillary Service Market. Performance monitoring of individual Services is approximate and complicated. Disturbance TimelineInitial governor response (to point B) is over completely by the time units start receiving secondary control signals in response to the disturbance. There needs to be recognition of governor response and coordination between RRS and RegUp deployments to insure smooth, rapid and sustained frequency recovery.
 will minimize the magnitude of frequency deviations Having more units being controlled by AGC will minimize the duration of frequency deviations Key ParametersSteady state speed characteristic (droop), governor dead-band, first stage boiler pressure (steam units) and head (hydro units) Base power schedule plus deployments of balancing energy, regulation energy, responsive and non-spinning reserve. AGC dead-band, gains and frequency bias term. Market CharacteristicsIf there ever is a governor response market, there will probably be bids, awards and settlement, but the market will never deploy the governor response. Bids, awards, deployments and settlement through the Ancillary Service Market. Performance monitoring of individual Services is approximate and complicated. Disturbance TimelineInitial governor response (to point B) is over completely by the time units start receiving secondary control signals in response to the disturbance. There needs to be recognition of governor response and coordination between RRS and RegUp deployments to insure smooth, rapid and sustained frequency recovery..")
Similar presentations


>")


. HW 5 is 2.38, 6.9, 6.18, 6.30, 6.34, 6.38; do by October 6 but does not need.>")


