Download presentation
Presentation is loading. Please wait.

2
1. Review normal electrical flow through the heart. 2. Discuss normal coronary artery anatomy and associated leads reflecting ischemic changes. 3. Identify ECG indications of ischemia, injury and infarction. 4. Analyze case studies.

4
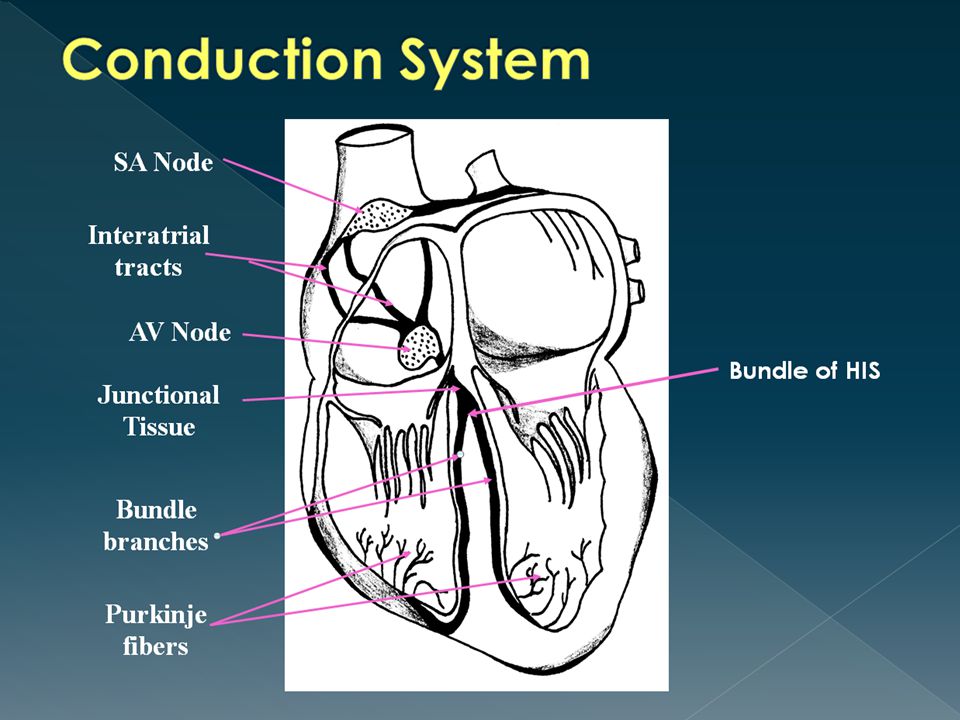
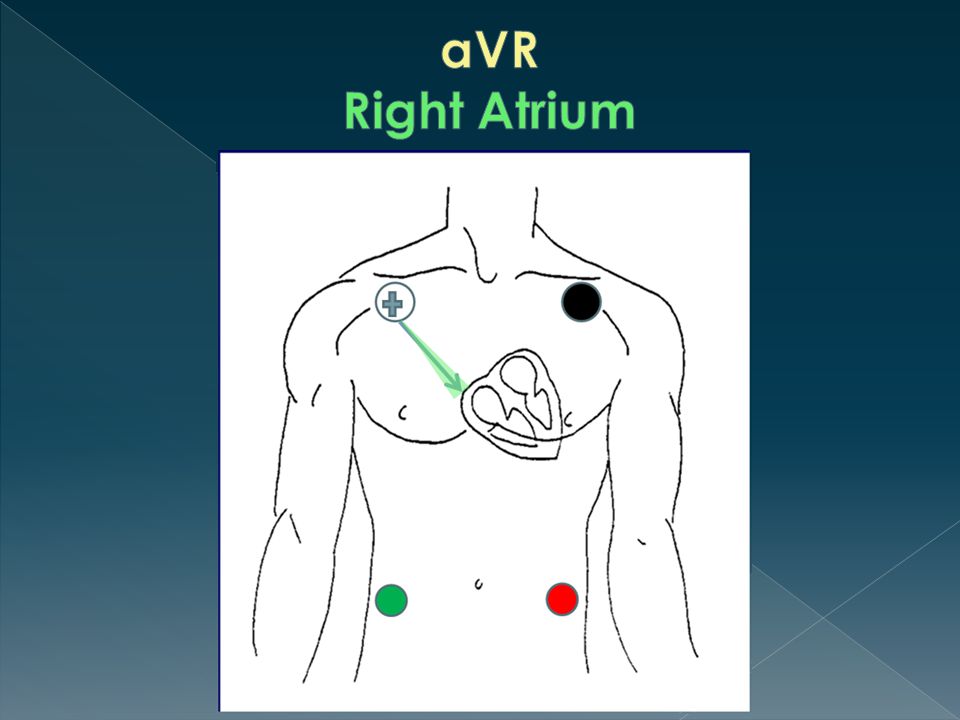
Sinoatrial Node (SA node, sinus node) › Normal pacemaker of heart, because it possesses the fastest inherent rate of automaticity › Initiates a rhythmic impulse at a rate of 60- 100 › Located in right atrium near superior vena cava
 › Normal pacemaker of heart, because it possesses the fastest inherent rate of automaticity › Initiates a rhythmic impulse at a rate of › Located in right atrium near superior vena cava")
5
Intra-atrial pathways › Conducts impulse from SA node through atrial musculature to atrioventricular (AV) node › Consists of: Anterior tract (Bachmann’s): through left atrium Middle tract (Wenckebach’s): through right atrium Posterior tract (Thorel’s): through right atrium › Located in atrial tissue between SA and AV nodes
 node › Consists of: Anterior tract (Bachmann’s): through left atrium Middle tract (Wenckebach’s): through right atrium Posterior tract (Thorel’s): through right atrium › Located in atrial tissue between SA and AV nodes")
6
AV Node › Delays impulse from atria before it moves to ventricles › Allows for ventricular filling › Serves as a protective mechanism against rapid supraventricular impulses › Located in the floor of right atrium, close to the tricuspid valve Junctional Tissue › Serves as back-up pacemaker › Intrinsic rate 40-60 › General term to describe the tissue in the lower AV node but above the bifurcation of bundle of HIS

7
Bundle of HIS/Right and Left Bundle Branches › Arises from AV node and conducts impulses to the ventricles via the bundle branches › Intrinsic rate less than 40 Purkinje System › Conducts impulses from the distal portion of bundle branches to the sub-endocardial layers of the ventricles › Located distal to the bundle branches › The terminal conduction system

8
Location › Originate in aortic arch just underneath flap of aortic valve Openings are very small Fill only during diastole

9
Left main coronary artery Left Circumflex (Left Circ) Left anterior descending (LAD) Right coronary artery (RCA)
 Left anterior descending (LAD) Right coronary artery (RCA)")
10
Left Main has two major branches › Left Anterior Descending (LAD) Supplies all of bundle branches Anterior wall of LV, part of RV Anterior 2/3 of interventricular septum › Left Circumflex Supplies lateral wall of LV AV node in 10% of population SA node in 45% of population Right Coronary Artery › Supplies AV node and inferior wall of myocardium in 90% of population › Supplies SA node in 55% of population
 Supplies all of bundle branches Anterior wall of LV, part of RV Anterior 2/3 of interventricular septum › Left Circumflex Supplies lateral wall of LV AV node in 10% of population SA node in 45% of population Right Coronary Artery › Supplies AV node and inferior wall of myocardium in 90% of population › Supplies SA node in 55% of population")
21
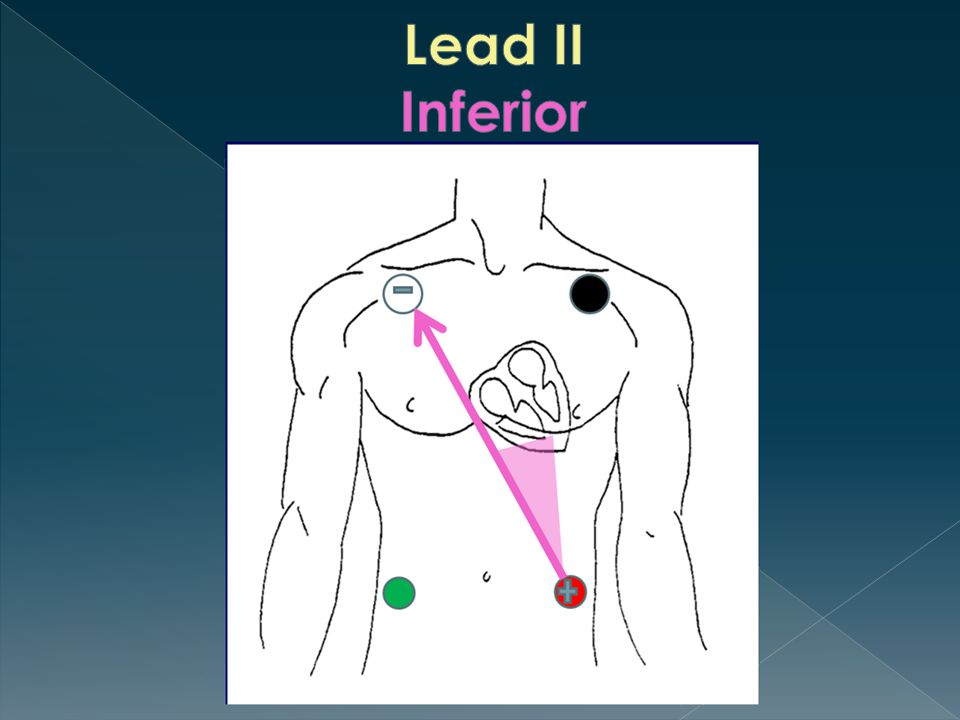
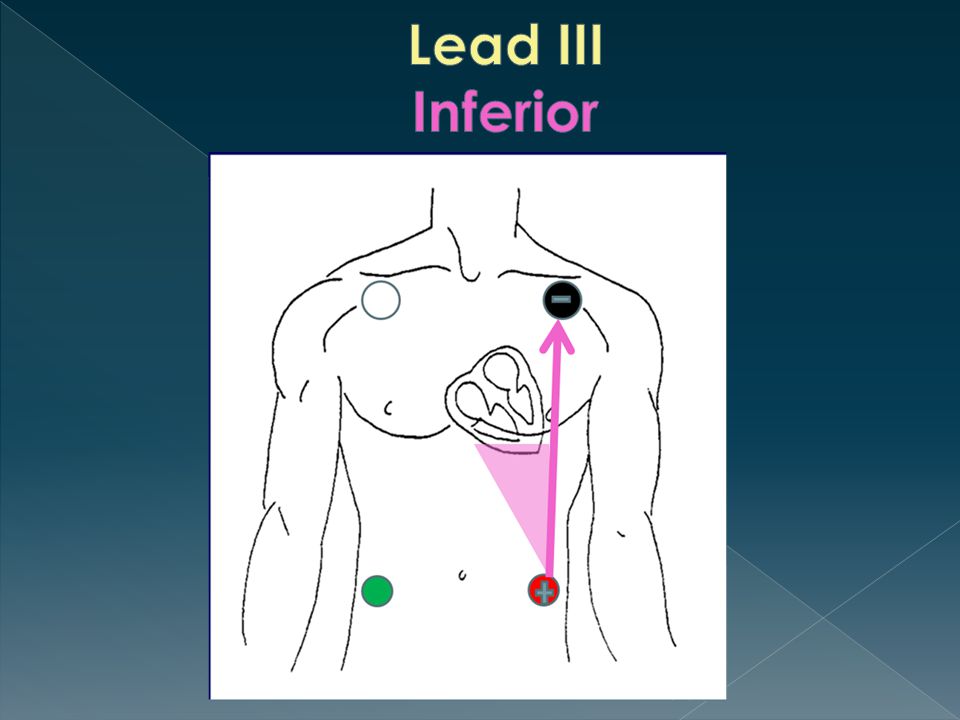
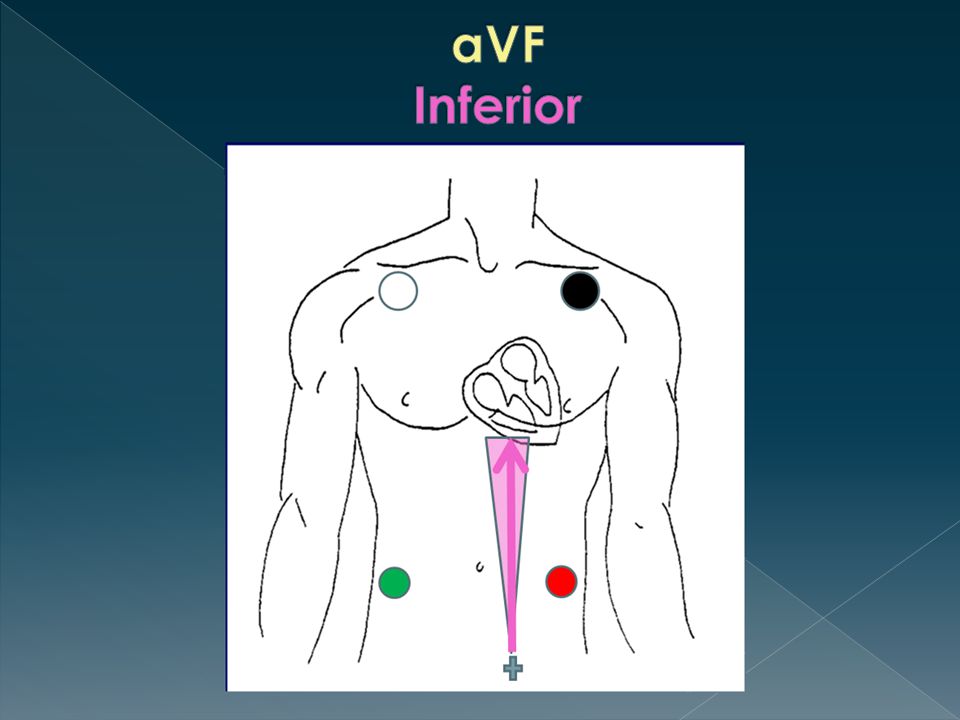
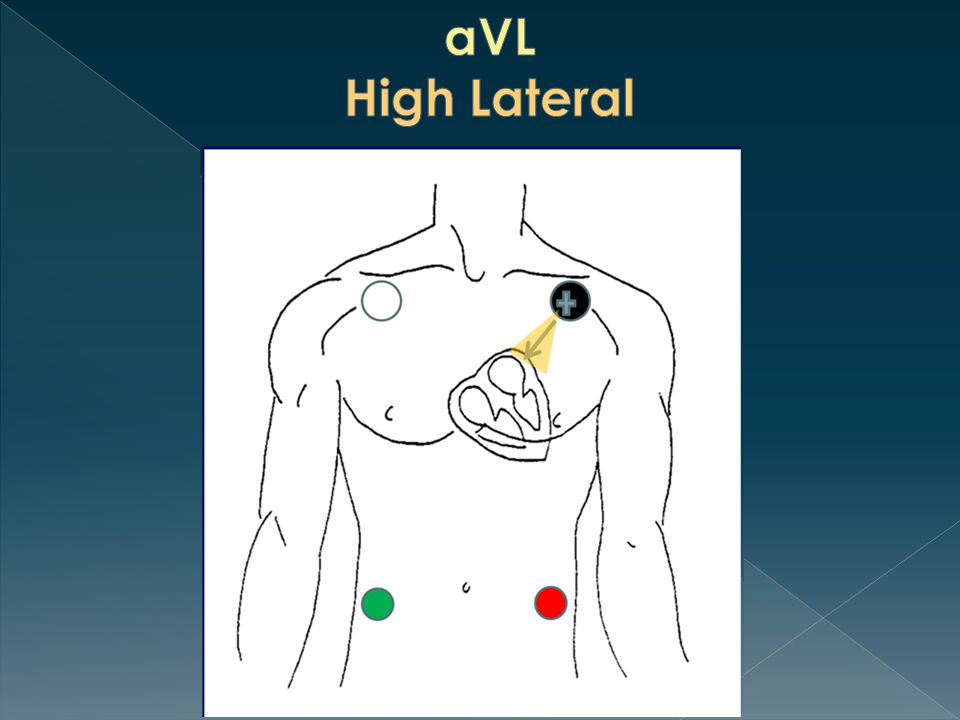
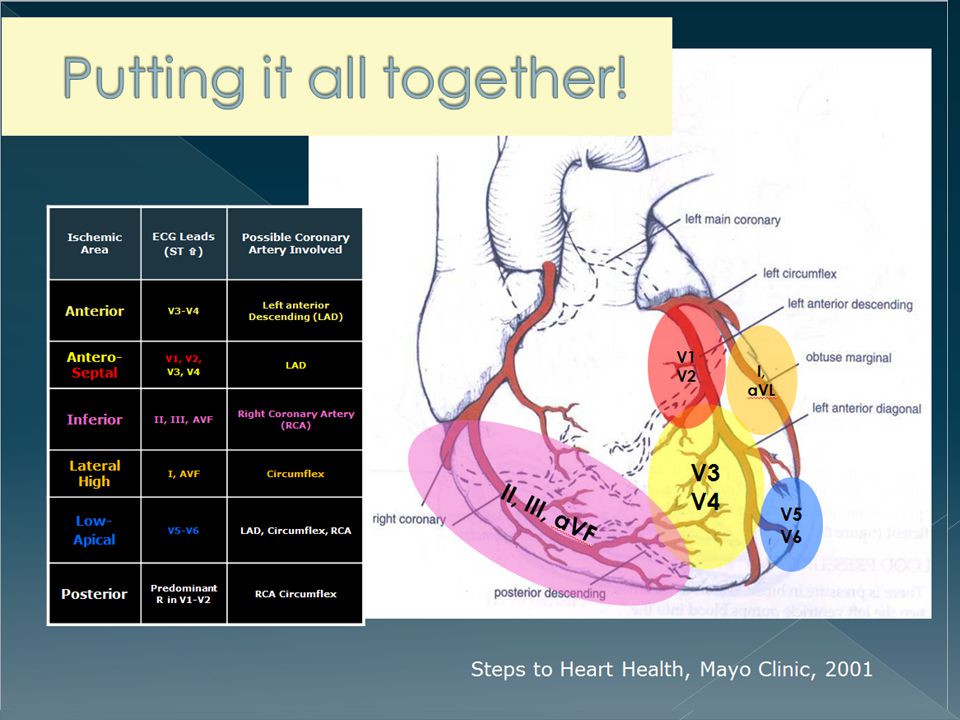
12 Lead Reference: Leads Reflecting Heart Walls aVR V1 V2 V3 V4 V5 V6 aVL aVF III II I ISCHEMIA ST Depression T Wave Inversion Flattened T waves Hyperacute T waves Injury ST Elevation Hyperacute T waves Infarction Pathological Q waves Posterior MI Tall R waves in V1, V2 and/or V3 along with ST Depression

22
After ventricular depolarization, normal myocardial cells are at nearly the same action potential. This is reflected during the ST Segment

23
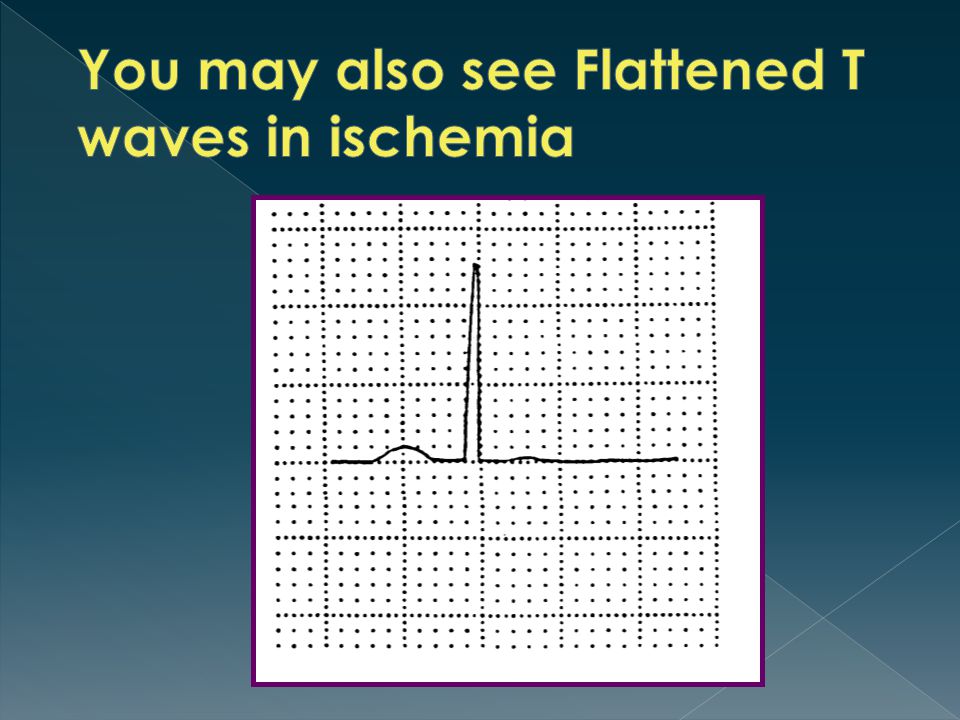
Two characteristic changes seen: 1. ST Depression 2. T Wave Inversion T-waves should be upright in all leads EXCEPT: aVR V1 (50% of the population are inverted….)
.")
25
Sign of significant ischemia and a precursor to acute injury Must be at least 7 mm high HOWEVER, may indicate other conditions (e.g. hyperkalemia if widespread across the 12 lead)
.")
26
Occurs in the setting of abrupt loss of blood flow to the myocardium

27
Usually stays elevated for 1-2 days but should return to baseline within two weeks Must be elevated greater than 1 mm in at least 2 contiguous leads Again…seen in leads immediately looking at the are of injury

28
ST depression found in electrically opposite leads showing ST Elevation (e.g. inferior wall ST elevation (II, III, avF) reciprocates with ST depression in lateral wall leads (I and avL) Speculation that STEMIs presenting with reciprocal changes have a larger myocardial area at risk (Journal of Cardiovascular Magnetic Resonance, 2013)
 reciprocates with ST depression in lateral wall leads (I and avL) Speculation that STEMIs presenting with reciprocal changes have a larger myocardial area at risk (Journal of Cardiovascular Magnetic Resonance, 2013).")
29
ST elevation >1 mm indicates: › LAD/Left main coronary artery (LMCA) occlusion or severe 3 vessel disease › Predicts the need for bypass surgery Differentiates LMCA from proximal LAD occlusion if ST elevation in aVR is > than ST elevation in V1 Absence of ST elevation in aVR almost entirely excludes significant LMCA http://www.apiindia.org/medicine_update_2013/chap22.pdf
 occlusion or severe 3 vessel disease › Predicts the need for bypass surgery Differentiates LMCA from proximal LAD occlusion if ST elevation in aVR is > than ST elevation in V1 Absence of ST elevation in aVR almost entirely excludes significant LMCA")
30
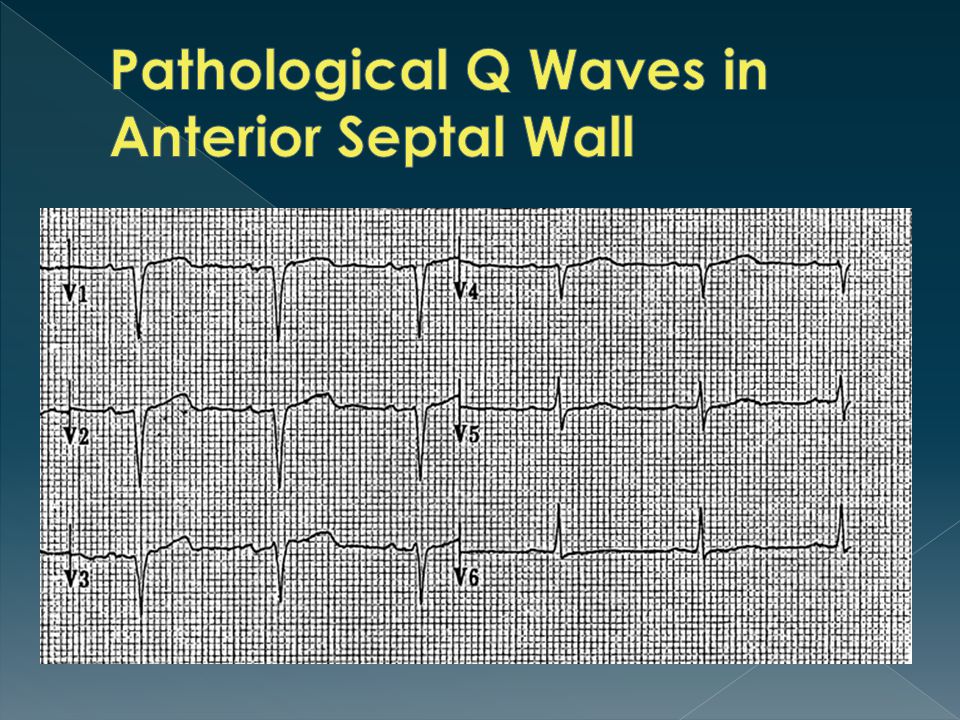
Pathological Q waves are the classic indication of myocardial necrosis Reflect the fact that electricity must travel great distances around the necrosed tissue Appear several hours or days after the MI Criteria: › Must be > 0.04 seconds wide › Should be greater than 25% the height of any accompanying R wave

31
Normal Pathological Q Wave

32
Inferior Leads affected Note presence of ST elevation as well indicating this is recent

34
http://lifeinthefastlane.com/ecg-library/lmca/ http://lifeinthefastlane.com/ecg-library/lmca/ http://lifeinthefastlane.com/ecg-library/myocardial-ischaemia/ http://lifeinthefastlane.com/ecg-library/myocardial-ischaemia/ http://www.uptodate.com/contents/electrocardiogram-in-the- diagnosis-of-myocardial-ischemia-and-infarction http://www.uptodate.com/contents/electrocardiogram-in-the- diagnosis-of-myocardial-ischemia-and-infarction http://www.apiindia.org/medicine_update_2013/chap22.pdf http://www.apiindia.org/medicine_update_2013/chap22.pdf Journal of Cardiovascular Magnetic Resonance 2013, 15 (Suppl 1):P172 doi:10.1186/1532-429X-15-S1-P172 Mayo Clinic Advanced ECG Workshop class content.
:P172 doi: / X-15-S1-P172 Mayo Clinic Advanced ECG Workshop class content.")
Similar presentations


 in thorax, in inferior mediastinum>")


