Download presentation
Presentation is loading. Please wait.

1
Living Donor Kidney Transplant. What does the evidence say about outcome ? Professor Peter J Conlon

2
Renal Transplantation at Beaumont Hospital 1964 to 2012 (YTD Nov 2012)
")
3
National Growth in Treated ESRD 2007 - 2011

4
European Kidney Transplant activity - 2012

5
European Live Donor Kidney Transplant activity - 2012

6
Dialysis numbers do not need to continue rising !! Annual Growth in ESRD 40 pmp Transplant activity of 250 TX would equate to 55 pmp

7
Financial impact of expanded transplant activity Net savings of €248 million over 10 years

8
© 2008 Lippincott Williams & Wilkins, Inc. Published by Lippincott Williams & Wilkins, Inc.5 Outcome of Identical twin Transplants 1988-2004 Renal Transplantation in Identical Twins in United States and United Kingdom. Kessaris, Nicos; Mukherjee, Dayal; Chandak, Pankaj; Mamode, Nizam Transplantation. 86(11):1572-1577, December 15, 2008. DOI: 10.1097/TP.0b013e31818bd83d FIGURE 1. Kaplan-Meier curve showing graft survival in the US group (based on OPTN data as of November 10, 2006).
: , December 15, DOI: /TP.0b013e31818bd83d FIGURE 1. Kaplan-Meier curve showing graft survival in the US group (based on OPTN data as of November 10, 2006)..")
9
Kaplan–Meier survival curves for three groups of RRT patients: those transplanted with a living ‐ related kidney donor (LD), those transplanted with a cadaveric kidney, and those remaining on dialysis. Medin C et al. Nephrol. Dial. Transplant. 2000;15:701-704 © European Renal Association-European Dialysis and Transplant Association 58 76 92

10
Adjusted all-cause mortality in the ESRD & general populations, by age, 2011 Figure 5.2 (Volume 2) Prevalent ESRD patients from day one, 2011, & general Medicare (non-ESRD) patients with at least one month of Medicare eligibility in 2011. Adj: gender/race; ref: Medicare patients, 2011.

11
Adjusted all-cause mortality rates in the ESRD & general populations, by age & gender, 2011 Figure 5.5 (Volume 2) January 1, 2011 point prevalent ESRD & general Medicare patients age 65 & older. Adj: age/gender/race/ comorbidity; ref: ESRD patients, 2011.

12
Adjusted all-cause mortality rates (from day 1 and day 90), by modality & year of treatment Figure 5.1 (Volume 2) Incident ESRD patients. Adj: age/gender/race /primary diagnosis; ref: incident ESRD patients, 2010.

13
Annual Death Rates and Total Numbers of Deaths, 1991–1997. Wolfe RA et al. N Engl J Med 1999;341:1725-1730.

14
Years of life benefit by having a transplant Additional Years 16 3

15
Projected years of life from WL: by age group Projected years of life WL dialysis Transplant 40 20 0 20–3940–5960–74 Age group Wolfe RA, et al. N Engl J Med 1999;341:1725

16
Average relative risk of death after renal transplantation in the time periods 0 to 30 d, 31 to 365 d, and greater than 365 d. RABBAT C G et al. JASN 2000;11:917-922 ©2000 by American Society of Nephrology

17
Expected remaining lifetimes (years) of the general U.S. population, & of prevalent dialysis & transplant patients Table 5.a (Volume 2) U.S. data: calculated from Table 7 in the U.S. life tables (Arias E). ESRD data: prevalent dialysis & transplant patients, 2011. Expected remaining lifetimes by race & gender can be found in Reference Table H.13. Prevalent ESRD population 2011, used as weight to calculate overall combined-age remaining lifetimes.
 U.S. data: calculated from Table 7 in the U.S. life tables (Arias E). ESRD data: prevalent dialysis & transplant patients, Expected remaining lifetimes by race & gender can be found in Reference Table H.13. Prevalent ESRD population 2011, used as weight to calculate overall combined-age remaining lifetimes..")
18
Years of life remaining the benefit of Living donor

19
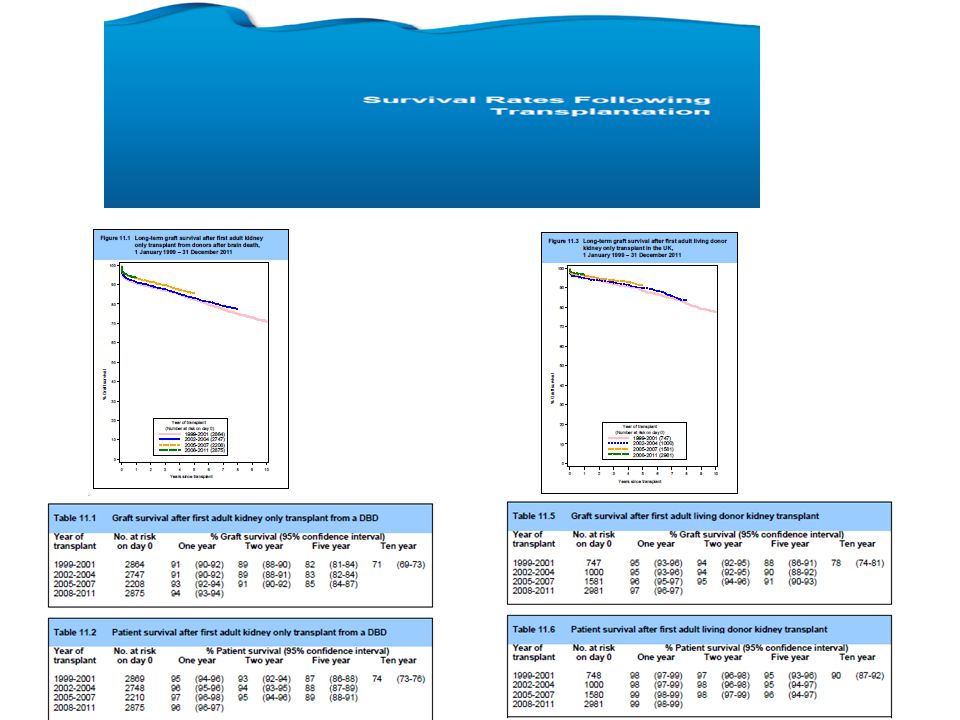
Beaumont Outcomes Graft Survival Year of transplant No. at risk on day 0 One year graft survival Two year graft survival Five year graft survival Ten year graft survival 1999 – 2001 2002 – 2004 2005 – 2007 2008 - 2011 276 301 300 446 90 (85 - 93) 97 (94 - 98) 98 (94 - 98) 97 (95 - 99) 89 (84 - 92) 97 (94 - 98) 98 (95 - 99) 84 (79 - 88) 90 (85 - 93) 95 (92 - 97) 73 (67 - 78)
 97 ( ) 98 ( ) 97 ( ) 89 ( ) 97 ( ) 98 ( ) 84 ( ) 90 ( ) 95 ( ) 73 ( ).")
20
Patient Survival Year of transplant No. at risk on day 0 One year survival Two year survival Five year survival Ten year survival 1999 – 2001 2002 – 2004 2005 – 2007 2008 - 2011 276 301 300 446 94 (91 - 97) 98 (95 - 99) 98 (96 - 99) 98 (97 - 99) 92 (88 - 95) 96 (93 - 98) 97 (95 - 99) 87 (83 - 91) 91 (87 - 94) 78 (72 - 82)
 98 ( ) 98 ( ) 98 ( ) 92 ( ) 96 ( ) 97 ( ) 87 ( ) 91 ( ) 78 ( ).")
21
Patient survival 1985-2011

23
% graft survival Impact of donor type on 68% 30%

25
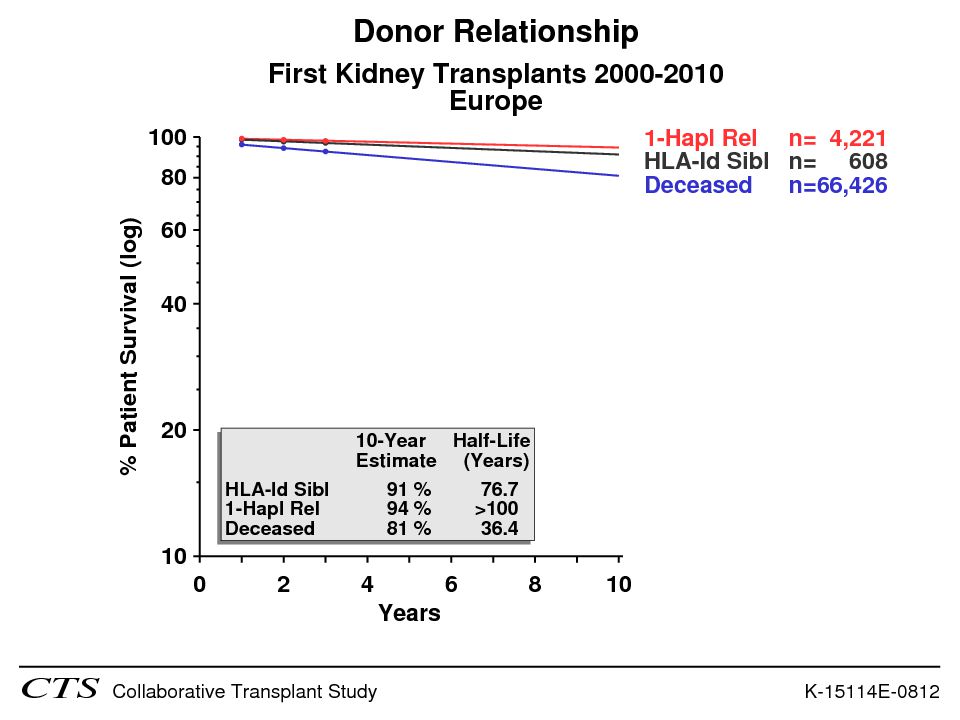
Deceased V Living Donor Outcome Graft

26
Deceased V Living Donor Patient Survival

27
Graft Failure Deceased V living Donor

28
Long term Patient Mortality Deceased V living Donor

29
Proportion of prevalent ESRD patients on Tx waiting list

30
Referral for pre-emptive transplant by centre

31
Proportion of Living donor Tx per centre

32
Mean Time on Tx waiting list --------------------------------------------------------------------------------

33
Time on Dialysis prior to Transplantation -------------------------------------------------------------------------- ------ Referring | centre median 25 th centile 75 th centile maximum number ----------+--------------------------------------------------------------------- TSH | 16.13 67.42 13 TULL | 39.72 14.32 0.00 36.21 104.25 22 OLH | 16.33 0.00 30.46 87.89 14 BH | 22.57 10.05 37.03 221.67 145 WAT | 27.27 12.91 42.22 95.77 66 TAL | 27.47 15.24 46.92 136.08 97 SVH | 29.82 16.10 42.87 119.98 62 CBAR | 29.91 10.92 64.13 100.34 12 MAT | 29.93 19.81 40.87 93.47 34 GAL | 30.82 14.75 40.38 137.72 57 CORK | 36.01 16.92 52.14 168.11 97 LIM | 36.47 24.34 54.74 82.10 42 SLI | 38.44 31.31 49.15 54.34 115.35 15 LET | 41.59 19.61 61.67 89.86 15 CAV | 42.83 27.84 61.42 87.82 16 | Total | 29.67 14.85 46.46 221.67 707 --------------------------------------------------------------------------------

34
The Benefit of avoiding dialysis altogether

35
Methods 27,253 cadaveric kidney pairs 2,405 kidney pairs Analysis Kaplan-Meier Cox regression Covariates: recipient demographics, HLA matching, dialysis time, cause of ESRD, immunosuppressive regimen and era Kidney pairs First transplants Single organ transplant Adult recipients All pairs of whom one kidney went to a six antigen matched recipient were excluded 2,405 dialysis <6 months2,405 dialysis >24 months

36
Baseline characteristics PRA = panel reactive antibody; AA = African American Meier-Kriesche HU, et al. Transplantation (In press)
.")
37
Graft survival as determined by dialysis time over 10 yr. Davis C L, Delmonico F L JASN 2005;16:2098-2110 ©2005 by American Society of Nephrology

38
Figure 2. Relationship between preemptive transplantation and outcomes among recipients of living donor kidney transplants. Kasiske B L et al. JASN 2002;13:1358-1364 ©2002 by American Society of Nephrology

39
Time on dialysis No. at risk on day 0 One year graft survival Two year graft survival Five year graft survival Ten year graft survival 0 – 1 year 1 – 3 years > 3 years 289 467 182 92 (88 - 94) 92 (89 - 94) 81 (75 - 86) 90 (85 - 93) 90 (87 - 92) 79 (72 - 84) 82 (77 - 86) 84 (80 - 87) 72 (65 - 78) 68 (62 - 73) 72 (67 - 76) 60 (50 - 68) Beaumont experience Death Censored graft survival
 92 ( ) 81 ( ) 90 ( ) 90 ( ) 79 ( ) 82 ( ) 84 ( ) 72 ( ) 68 ( ) 72 ( ) 60 ( ) Beaumont experience Death Censored graft survival.")
40
Year of transplant No. at risk on day 0 One year graft survival Two year graft survival Five year graft survival Ten year graft survival 0 – 1 year 1 – 3 years > 3 years 289 467 182 99 (96 – 99) 97 (95 - 98) 88 (82 - 92) 97 (94 - 98) 96 (93 - 97) 82 (75 - 87) 93 (89 - 95) 89 (86 - 92) 62 (54 - 69) 85 (80 - 89) 79 (75 - 82) 43 (36 - 50) Patient Survival
 97 ( ) 88 ( ) 97 ( ) 96 ( ) 82 ( ) 93 ( ) 89 ( ) 62 ( ) 85 ( ) 79 ( ) 43 ( ) Patient Survival.")
41
Benefit of Renal Transplantation in at Risk Sub Groups

42
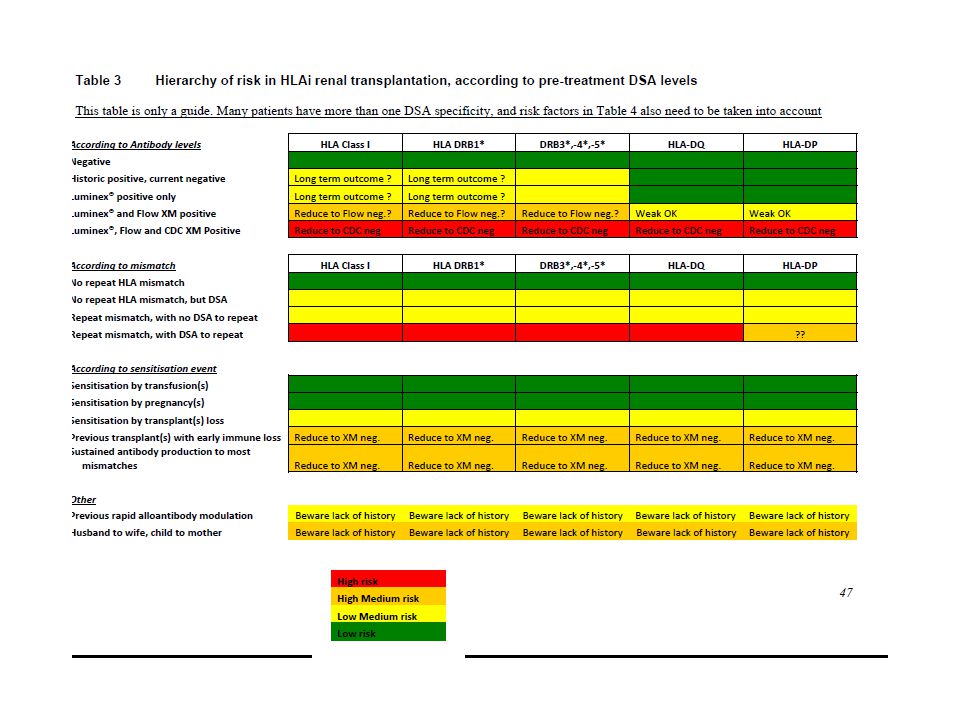
The problems of immunological barriers What is the best option ? Remain on dialysis Deceased donor Tx Desensitised Living donor Tx Paired kidney exchange Which approach is Best ??

44
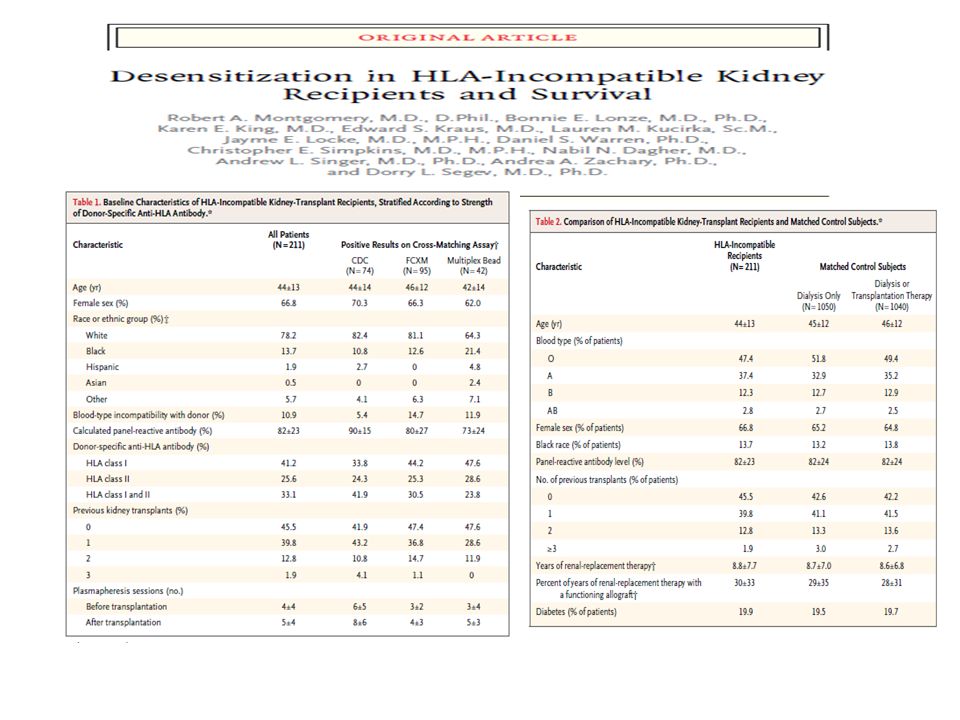
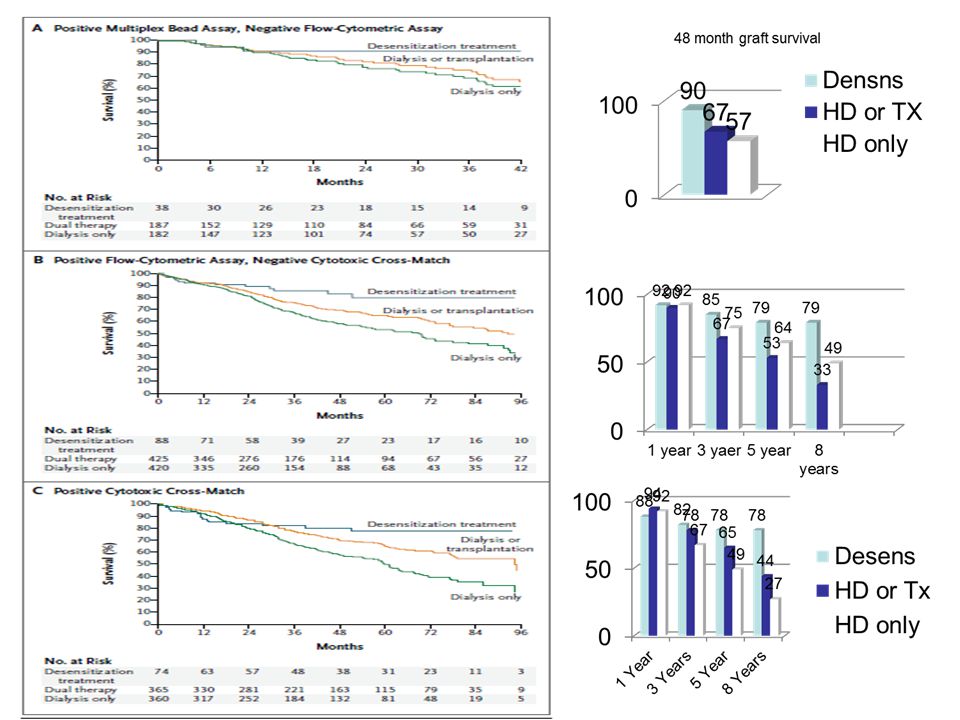
Survival Benefit of Desensitization in HLA-Incompatible Kidney Recipients. Montgomery RA et al. N Engl J Med 2011;365:318-326. 52% 70 82%

47
Standard living donor 92% Standard deceased Donor 82% HLA I 89% ABO i 84%

49
Benefit of Renal Transplantation in at Risk Sub Groups

50
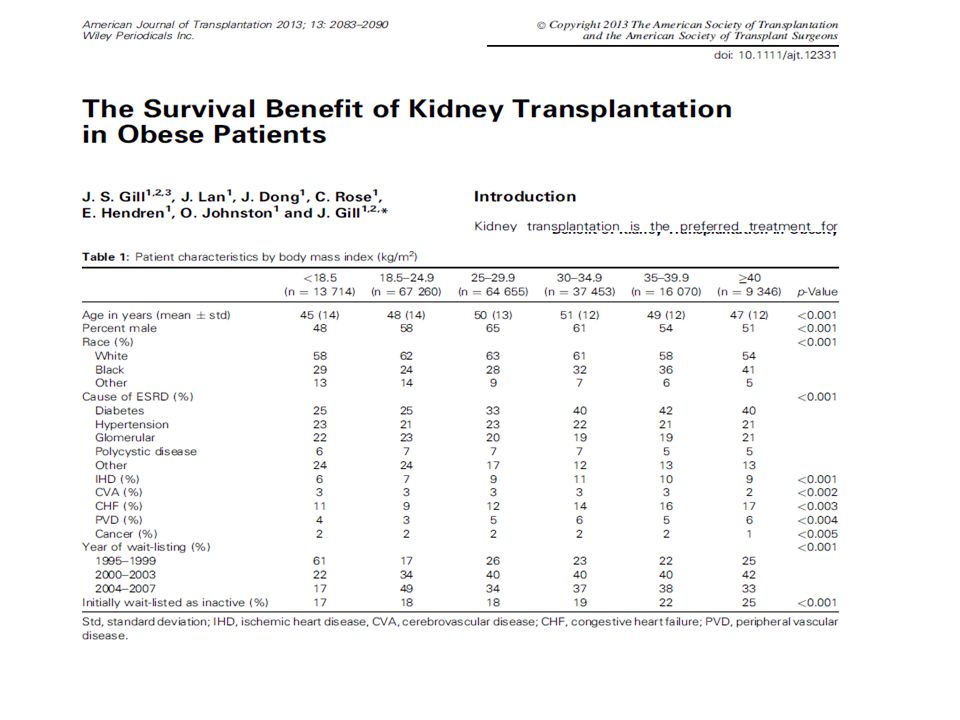
Renal Transplantation in Obesity Options for Obese recipient Remain on DialysisLoose weightProceed to Transplant without weight loss Largely impossible

53
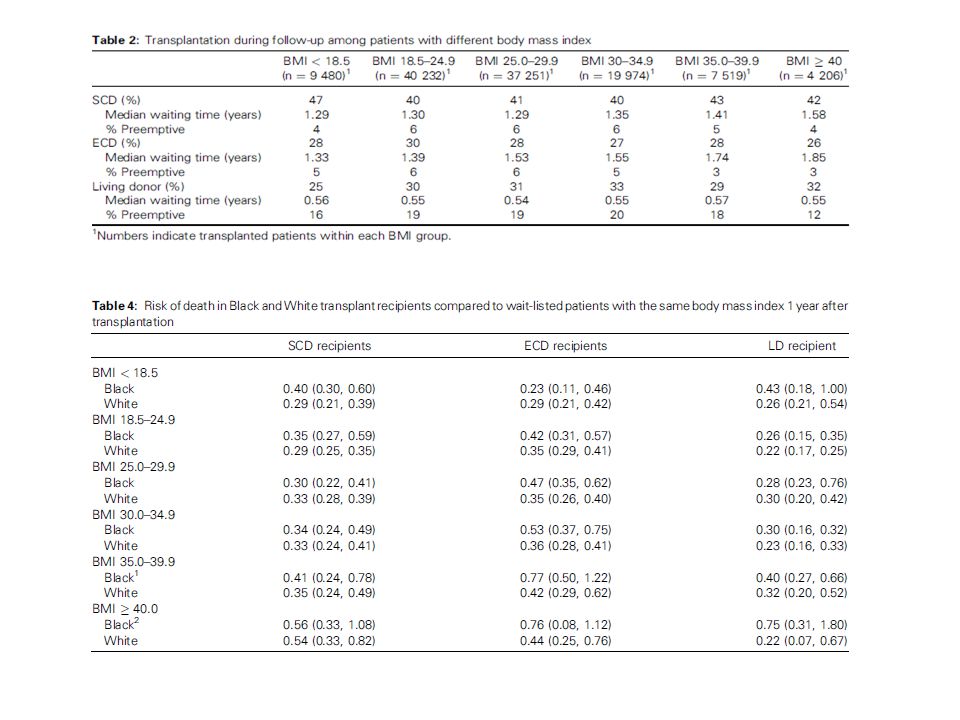
The Survival Benefit of Kidney Transplantation in Obese Patients American Journal of Transplantation Volume 13, Issue 8, pages 2083-2090, 25 JUL 2013 DOI: 10.1111/ajt.12331 http://onlinelibrary.wiley.com/doi/10.1111/ajt.12331/full#ajt12331-fig-0001 Volume 13, Issue 8, http://onlinelibrary.wiley.com/doi/10.1111/ajt.12331/full#ajt12331-fig-0001 Immediate benefit in these groups Days to equal survival

54
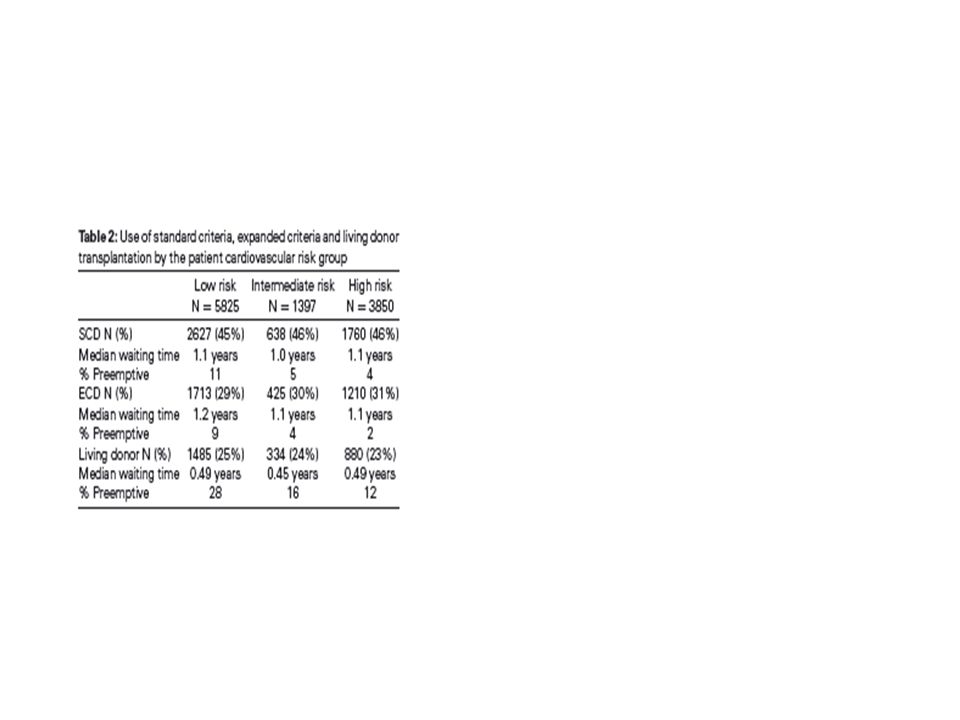
Low risk Intermediate Risk High Risk If the they had two or

56
Survival Benefit of Transplantation

57
Where a willing an acceptable Living donor is available Living donor transplantation is almost always preferable to deceased in terms of long term recipient survival

Similar presentations


: 985-995.>")


