Download presentation
Presentation is loading. Please wait.

1
Assigned Reading Today’s assigned reading is: –Finish Chapter 7

2
Reminder: e.m. Radiation generally contains bundles of waves of different wavelengths (colors) The strength of each color in a given bundle of e.m. radiation, i.e. the intensity of the light at each wavelength, is called the spectrum Here is an example of optical (visible) light:
 The strength of each color in a given bundle of e.m. radiation, i.e. the intensity of the light at each wavelength, is called the spectrum Here is an example of optical (visible) light:.")
3
Blackbody Radiation (a.k.a. Thermal Radiation) –Every object with a temperature greater than absolute zero emits blackbody radiation. –Hotter objects emit more total radiation per unit surface area. –Hotter objects emit photons with a higher average energy.
 –Every object with a temperature greater than absolute zero emits blackbody radiation. –Hotter objects emit more total radiation per unit surface area. –Hotter objects emit photons with a higher average energy..")
4
Reminder: Blackbody Radiation, i.e. a continuum of wavelengths with a characteristic distribution of strengths

5
Hotter B.B. emitters “emit” more total radiation per unit area. However, a big cold object can emit the same or more energy (depending on how big it is) than a small, hotter one Cold Hot Stefan-Boltzmann Law: Emitted power per square meter = σ T 4 σ = 5.7 x 10 -8 W/(m 2 K 4 ) Total emitted power: E = 4 R 2 σ T 4
 than a small, hotter one Cold Hot Stefan-Boltzmann Law: Emitted power per square meter = σ T 4 σ = 5.7 x W/(m 2 K 4 ) Total emitted power: E = 4 R 2 σ T 4.")
6
An Object’s Spectrum Encoded in an object’s spectrum is information about the emitter/absorber. This is how we learn what the Universe is made of!

7
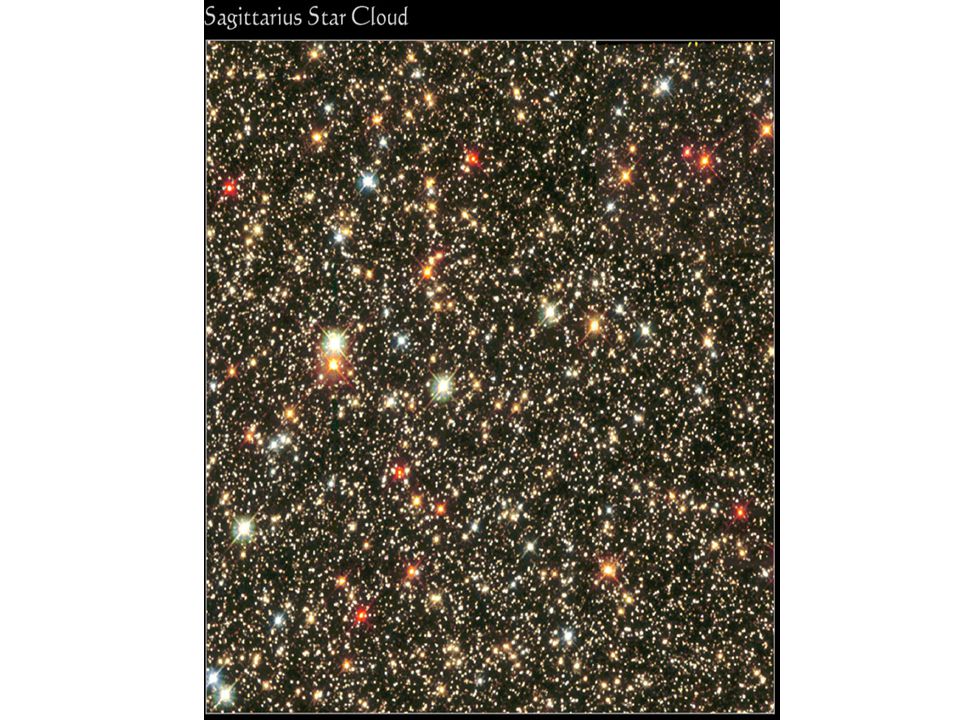
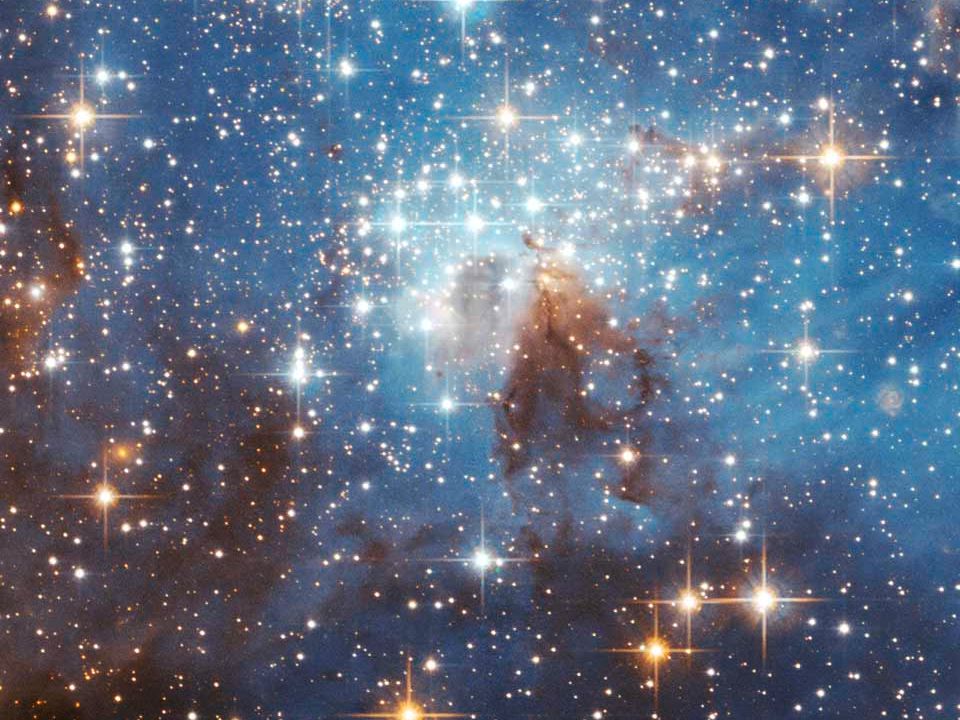
Stars come in different colors

10
Color and Temperature Orion Betelgeuse Rigel Stars appear in different colors, from blue (like Rigel) via green / yellow (like our sun) to red (like Betelgeuse). If the spectra of stars are black bodies, then these colors tell us about the star’s temperature.

11
The spectrum of a star: nearly a Black Body The light from a star is usually concentrated in a rather narrow range of wavelengths. The spectrum of a star’s light is approximately a black body spectrum. In fact, the spectrum of a star at the photosphere, before the light passes through the atmosphere of the star, is a nearly PERFECT black body one

12
The Spectra of Stars The inner, dense layers of a star do produce a continuous (blackbody) spectrum. Cooler surface layers absorb light at specific frequencies. The atmosphere also absorbes light at other specific frequencies => Spectra of stars are B.B.absorption spectra.

13
The Spectrum of a star (the Sun) There are similar absorption lines in the other regions of the electromagnetic spectrum. Each line exactly corresponds to chemical elements in the stars.

14
Again, remember the two Laws of Black Body Radiation. I 1. The hotter an object is, the more energy it emits: L = 4 R 2 *T 4 where = Stefan-Boltzmann constant L = Energy = = Energy given off in the form of radiation, per unit time [J/s]; More area, more energy

15
Again, remember the two Laws of Black Body Radiation. II 2. The peak of the black body spectrum shifts towards shorter wavelengths when the temperature increases. Wien’s displacement law : max ≈ 3,000,000 nm / T K (where T K is the temperature in Kelvin)
.")
16
Stellar Spectra The spectra of stars also contain characteristic absorption lines. With what we have learned about atomic structure, we can now understand how those lines are formed.

17
Analyzing Absorption Spectra Each element produces a specific set of absorption (and emission) lines. By far the most abundant elements in the Universe Comparing the relative strengths of these sets of lines, we can study the composition of gases.

18
Lines of Hydrogen Most prominent lines in many astronomical objects: Balmer lines of hydrogen

19
The Balmer Lines n = 1 n = 2 n = 4 n = 5 n = 3 HH HH HH The only hydrogen lines in the visible wavelength range Transitions from 2 nd to higher levels of hydrogen 2 nd to 3 rd level = H (Balmer alpha line) 2 nd to 4 th level = H (Balmer beta line) …
 2 nd to 4 th level = H (Balmer beta line) …")
20
Observations of the H-Alpha Line Emission nebula, dominated by the red H line

21
Absorption Spectrum Dominated by Balmer Lines Modern spectra are usually recorded digitally and represented as plots of intensity vs. wavelength

22
The Balmer Thermometer Balmer line strength is sensitive to temperature: Almost all hydrogen atoms in the ground state (electrons in the n = 1 orbit) => few transitions from n = 2 => weak Balmer lines Most hydrogen atoms are ionized => weak Balmer lines
 => few transitions from n = 2 => weak Balmer lines Most hydrogen atoms are ionized => weak Balmer lines")
23
Measuring the Temperatures of Stars Comparing line strengths, we can measure a star’s surface temperature!

24
Spectral Classification of Stars (1) Temperature Different types of stars show different characteristic sets of absorption lines.
 Temperature Different types of stars show different characteristic sets of absorption lines.")
25
Spectral Classification of Stars (2) Mnemonics to remember the spectral sequence: OhOhOhOhOnly BeBeBoy,Bad AAnAnAstronomers FineFForget Girl/GuyGradeGenerally KissKillsKnown MeMeMeMeMnemonics
 Mnemonics to remember the spectral sequence: OhOhOhOhOnly BeBeBoy,Bad AAnAnAstronomers FineFForget Girl/GuyGradeGenerally KissKillsKnown MeMeMeMeMnemonics")
26
Stellar Spectra O B A F G K M Surface temperature

27
The Composition of Stars From the relative strength of absorption lines (carefully accounting for their temperature dependence), one can derive the chemical composition of stars.
, one can derive the chemical composition of stars.")
28
The Doppler Effect: another key information contained in spectrum The frequency of light (or of sound) of a source in motion relative to an observer has frequency altered by an amount that depends on its speed relative to the observer. In other words, speed changes the perceived wavelength of a source (color for light; pitch for sound) Listen to a moving fire truck… … or take a look at the police car to see how this works.
 Listen to a moving fire truck… … or take a look at the police car to see how this works..")
29
The Doppler Effect (1) The light of a moving source is blue/red shifted by / 0 = v r /c 0 = actual wavelength emitted by the source Wavelength change due to Doppler effect v r = radial velocity Blue Shift (to higher frequencies) Red Shift (to lower frequencies) vrvr Sound waves always travel at the speed of sound – just like light always travels at the speed of light, independent of the speed of the source of sound or light.
 The light of a moving source is blue/red shifted by / 0 = v r /c 0 = actual wavelength emitted by the source Wavelength change due to Doppler effect v r = radial velocity Blue Shift (to higher frequencies) Red Shift (to lower frequencies) vrvr Sound waves always travel at the speed of sound – just like light always travels at the speed of light, independent of the speed of the source of sound or light.")
30
The Doppler Effect (2) The Doppler effect allows us to measure the component of the source’s velocity along our line of sight. This component is called radial velocity, v r.

31
Doppler Effect The first crest travels out in circle from the original position of the plane At a later time, a second crest is emitted from the planes new position, but the old crest keeps moving out in a circle from the planes original position The same thing happens again at a later time Longer wavelength (more red) Shorter wavelength (more blue)
 Shorter wavelength (more blue)")
32
In general … The “native” frequency at which an object is emitting is called the rest frequency. You will see/hear frequencies higher than the rest frequency from objects moving towards you. You will see/hear frequencies lower than the rest frequency from objects moving away from you. This is true with sound waves, as well as with light waves and any other type of waves

33
Spectra tell us about the motion of sources

34
The Doppler Effect (2) Example:
 Example:")
35
The Doppler Effect Take of the H (Balmer alpha) line: 0 = 656 nm Assume, we observe a star’s spectrum with the H line at = 658 nm. Then, = 2 nm. We find = 0.003 = 3*10 -3 Thus, v r /c = 0.003, or v r = 0.003*300,000 km/s = 900 km/s. The line is red shifted, so the star is receding from us with a radial velocity of 900 km/s.

36
Two identical stars are moving towards the Earth. Star A’s emission lines are observed to be at visible wavelengths. The same emission lines for Star B are observed to be at ultraviolet wavelengths. From these observations you conclude that: Both stars are moving away from the Earth Both stars are moving away from the Earth Star A is moving towards the Earth faster than Star B Star A is moving towards the Earth faster than Star B Star B is moving towards the Earth faster than Star A Star B is moving towards the Earth faster than Star A Star B is moving away from the Earth while Star A is moving towards the Earth. Star B is moving away from the Earth while Star A is moving towards the Earth.

37
The Doppler shift An object shining red light with =656.3 nm is moving at V=5,000,000 m/s toward you. What is the color of the light that you see? V/c = (- 0 )/ 0 5x10 6 /3x10 8 = 1.67x10 -2 = (- 0 )/ 0 0 = x (1+1.67x10 -2 ) = 667.3 nm
/ 0 5x10 6 /3x10 8 = 1.67x10 -2 = (- 0 )/ 0 0 = x (1+1.67x10 -2 ) = nm.")
39
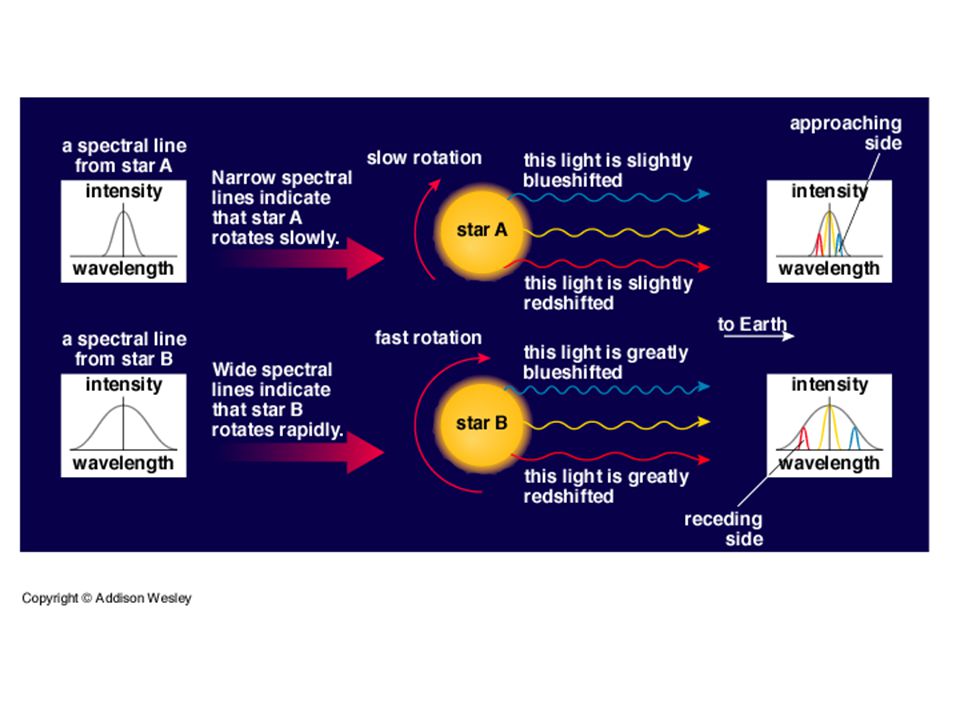
Two otherwise identical stars are rotating at different rates. Star A is rotating slower than Star B. How do Star A’s spectral lines appear with respect to Star B’s lines? Star A’s lines are narrower than Star B’s lines. Star B’s lines are narrower than Star A’s lines. Star B’s lines are narrower than Star A’s lines. There is no difference in the lines of the two stars. Star A’s lines are stronger than Star B’s lines.

Similar presentations


 Speed of light is independent.>")


 is electromagnetic energy Since only permitted electron orbits (energies),>")
. temperature (compare to blackbody curve). (line-of-sight) velocity.>")


 via green / yellow.>")

 –Atoms and Light: Fluorescent.>")
: 7 Learning Outcomes:>")
 Please.>")


