Download presentation
Presentation is loading. Please wait.

1
Overview of UT/LS Science Issues and New Information from SEAC4RS Steve Wofsy and Jasna Pittman – Harvard University Qing Liang – NASA Goddard Space Flight Center, Universities Space Research Association Paul Newman – NASA Goddard Space Flight Center Presented at the SEAC4RS Science Team meeting Pasadena, CA, 29 April 2015

2
Science Questions for this introductory talk: What are the transport rates into, within, and out of the stratosphere? How can we measure the overall rates of transport? Is the stratospheric circulation changing in response to warming climate and increasing greenhouse gases? How well to we know the global removal rates/lifetimes of ODSs? The discussion will consider tracer transport phenomena and key observational constraints on the emergent properties of the stratosphere.

3
52 CFC-11 56.2 yr (monthly lifetimes between 49.4 – 63.4) 102 CFC-12 100.4 yr (93.6 – 105.9) 93 CFC-113 91.3 yr (84.8 – 97.4) 114 N 2 O 118.5 yr (111.4 – 126.8) 26 CCl 4 50.4 yr (42.4 – 54.5) [35 with tropospheric loss] τ WMO Species τ GEOSCCM variability, range
![52 CFC yr (monthly lifetimes between 49.4 – 63.4) 102 CFC yr (93.6 – 105.9) 93 CFC yr (84.8 – 97.4) 114 N 2 O yr (111.4 – 126.8) 26 CCl yr (42.4 – 54.5) [35 with tropospheric loss] τ WMO Species τ GEOSCCM variability, range](http://images.slideplayer.com/19/5813270/slides/slide_3.jpg "52 CFC yr (monthly lifetimes between 49.4 – 63.4) 102 CFC yr (93.6 – 105.9) 93 CFC yr (84.8 – 97.4) 114 N 2 O yr (111.4 – 126.8) 26 CCl yr (42.4 – 54.5) [35 with tropospheric loss] τ WMO Species τ GEOSCCM variability, range")
4
Brewer-Dobson Circulation is Projected to Increase with Climate Warming Implications: Changes in O 3, feedback on climate, shorter lifetimes for ODSs

5
JGR, 1994 Mean age of air (average time since an air volume entered the stratosphere) directly measures stratospheric circulation
 directly measures stratospheric circulation")
6
Definition of age of air, age spectrum, width of age spectrum age spectrum mean age Andrews et al, 2001

7
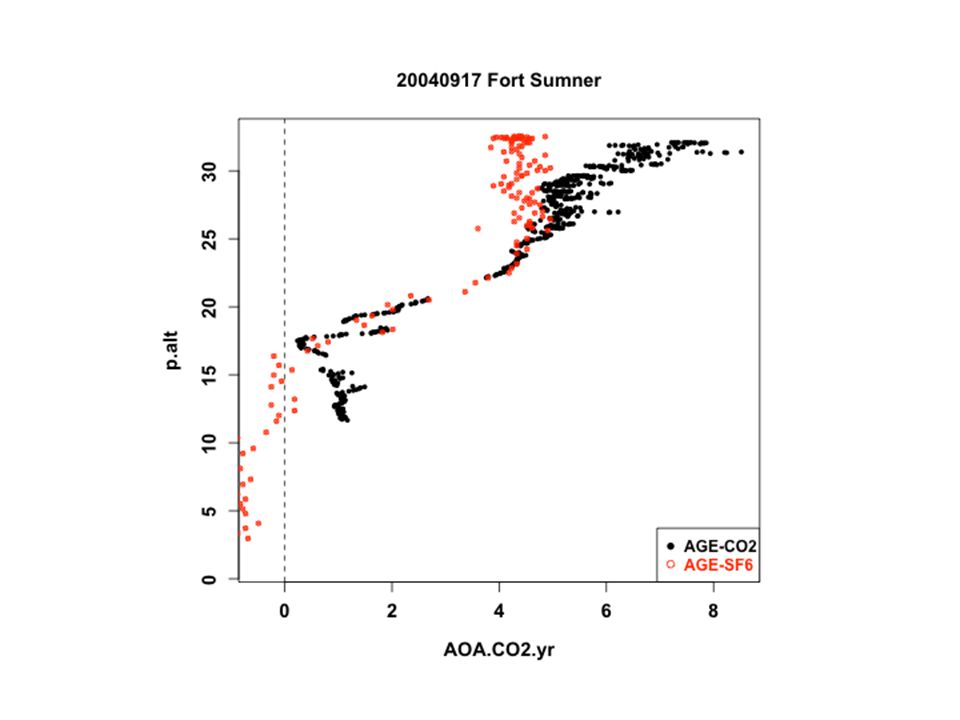
N 2 O Isopleth Mean Age = Δ CO 2 / b CO2 = Δ SF 6 / b SF6

8
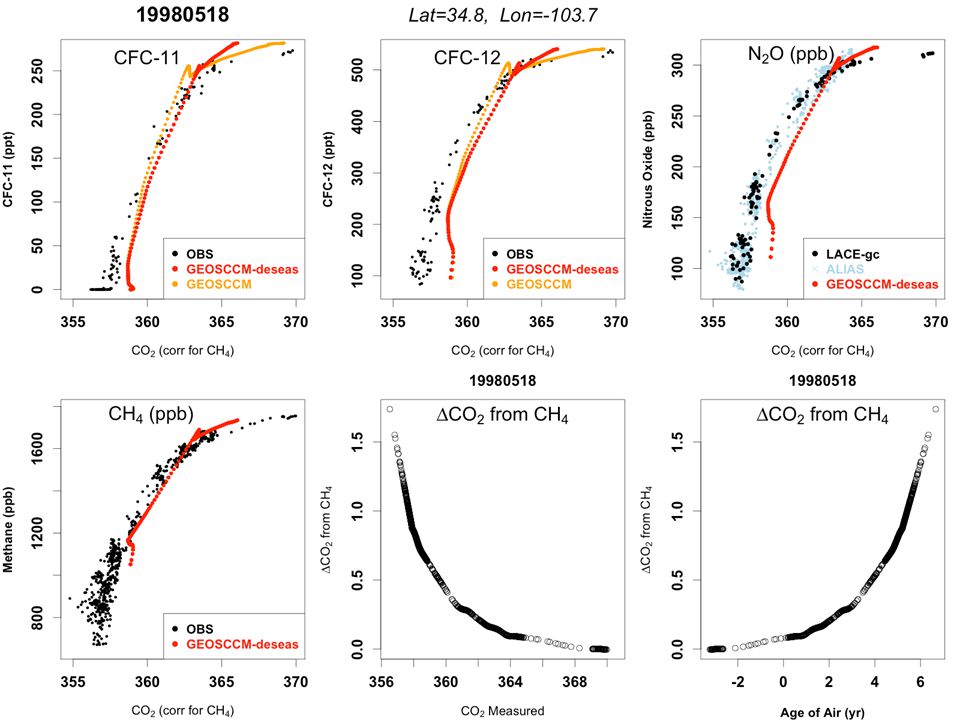
Vertically integrated global loss b x time rate of change of X b x time rate of change of x=CO 2 (corrected for CH 4 ) or change of SF 6 (corrected for mesospheric loss ) Mean Age Tracer-tracer and flux ratios Rate of change for tracer (e.g. N 2 O) affects slope and mean lifetime In a 1-d atmosphere, with gases emitted at the surface, the slope of a tracer-tracer plot at Z is proportional to the vertically integrated loss rate above Z + the rate-of-change of the concentration at the surface.
 affects slope and mean lifetime In a 1-d atmosphere, with gases emitted at the surface, the slope of a tracer-tracer plot at Z is proportional to the vertically integrated loss rate above Z + the rate-of-change of the concentration at the surface..")
10
We have (almost) inert tracers that increase linearly with time direct measure of mean age
 inert tracers that increase linearly with time direct measure of mean age")
11
De-seasonalized Tracer Trends

12
The stratosphere approximates the 1-dimensional atmosphere: quasi-horizontal transport rate >> chemistry, vertical transport rate How good is this approximation? CO 2 vs Age of Air:Age of Air vs height Data from GEOSCCM compact simple relationship above about 20 km

13
Models and Data: Changes over time of mean age and lifetimes for gases in the stratosphere

14
Vertical Profiles of Mean Age from CO 2 Engel et al., 2009 -2 0 2 4 6 8 CO 2 -derived mean age

15
GRL, 2006 Models: Large changes, noisy signal.

16
3.35 2.85 Austin and Li, 2006

17
Age of Air Global lifetime of ODSs and tracers

20
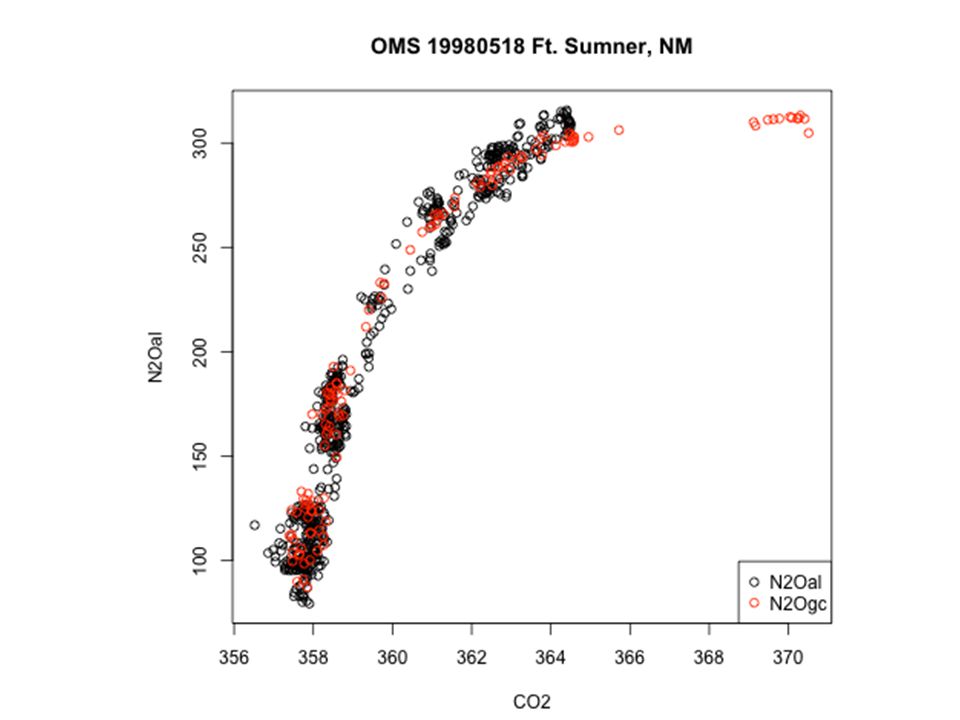
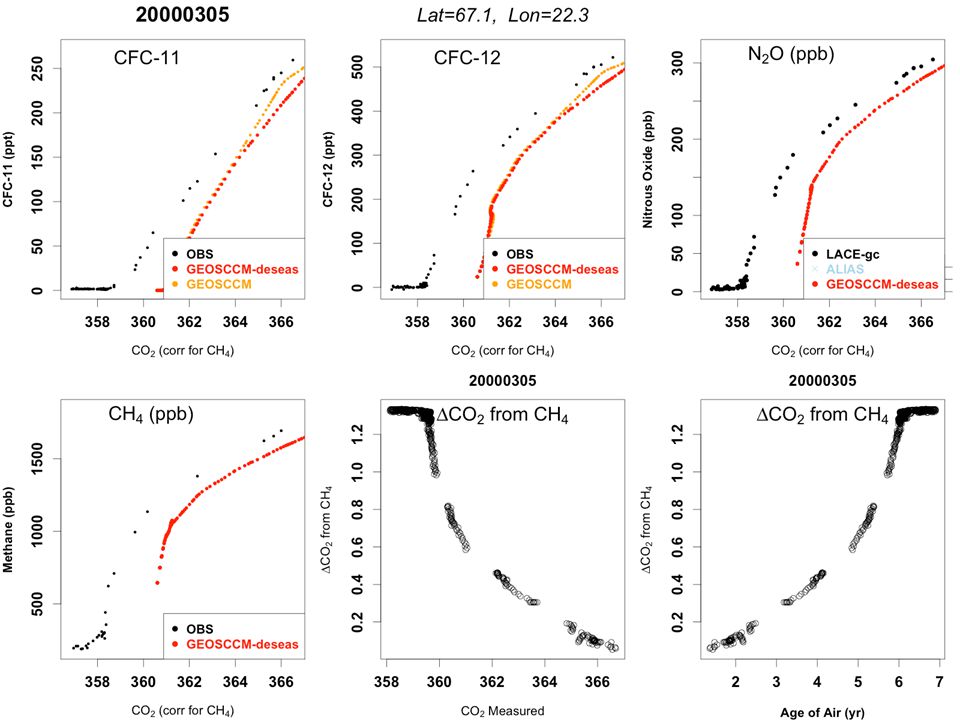
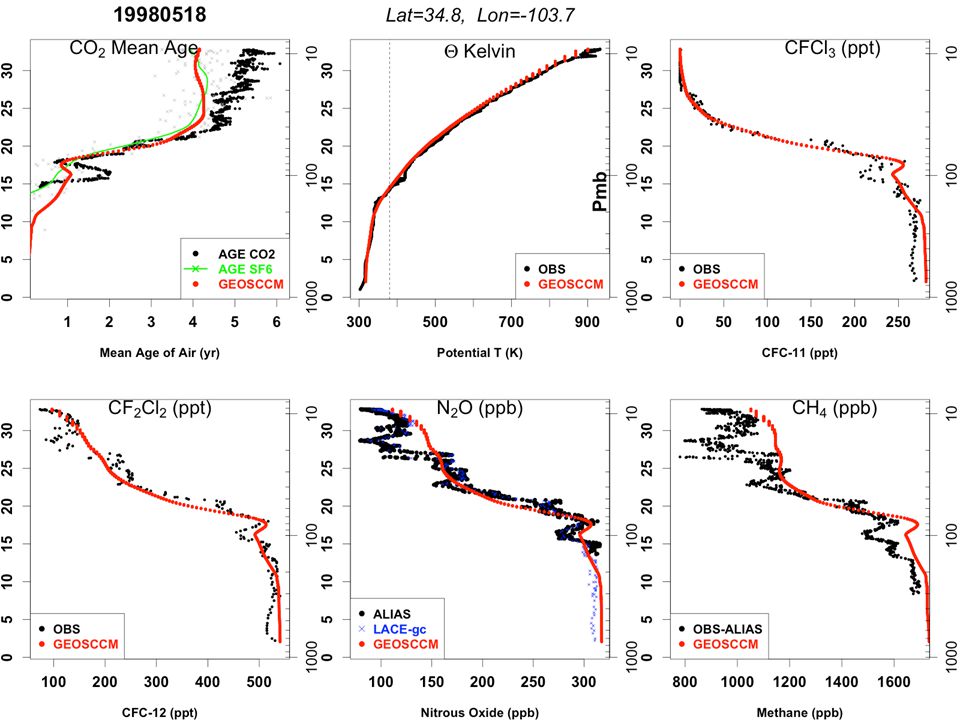
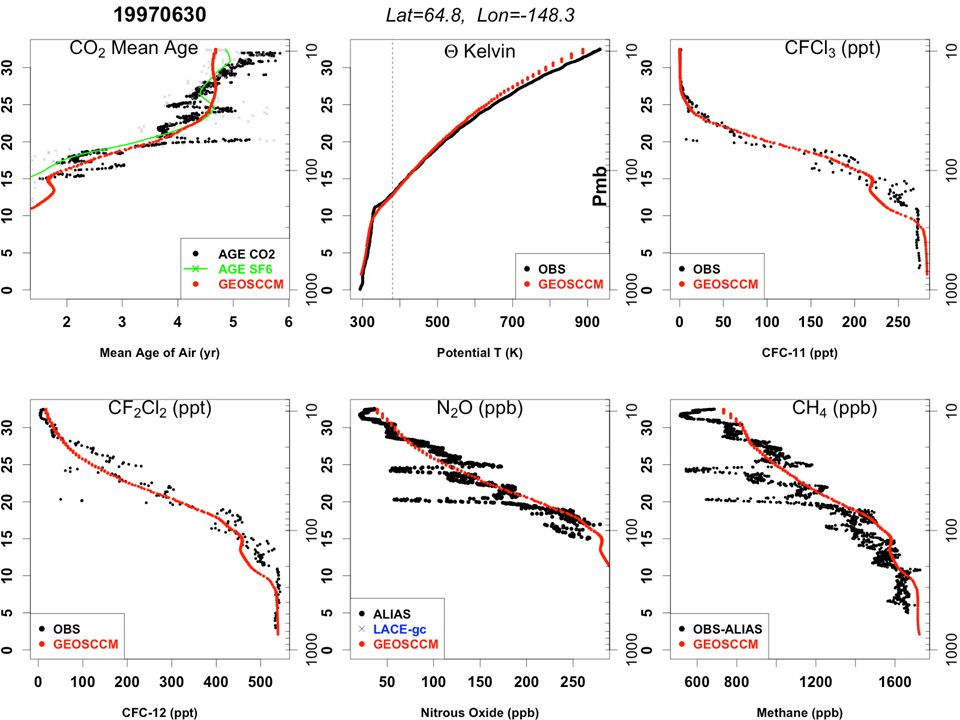
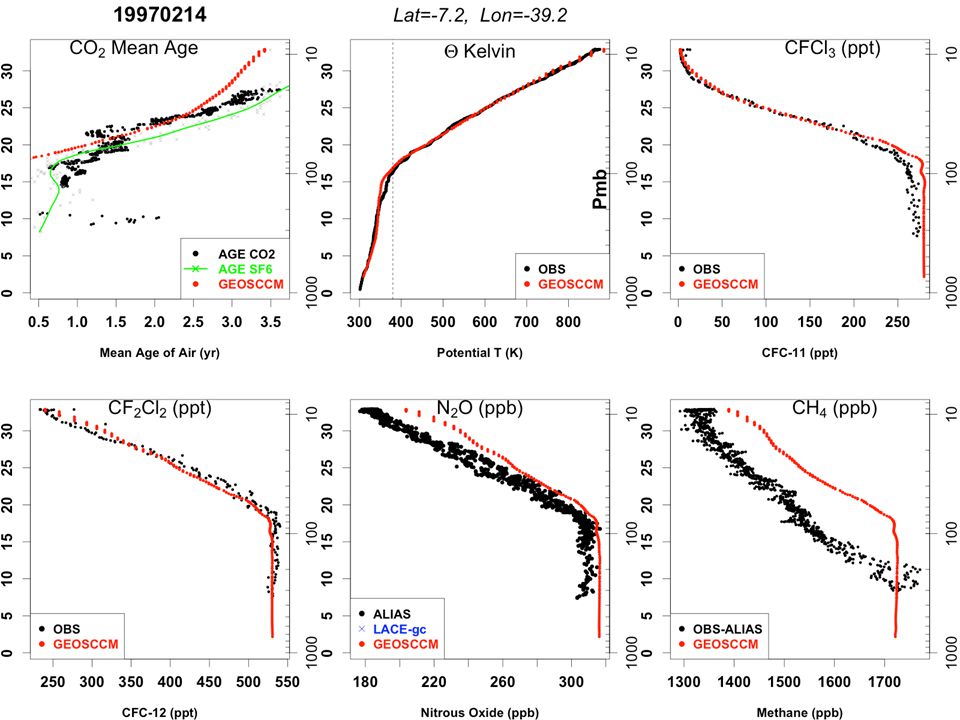
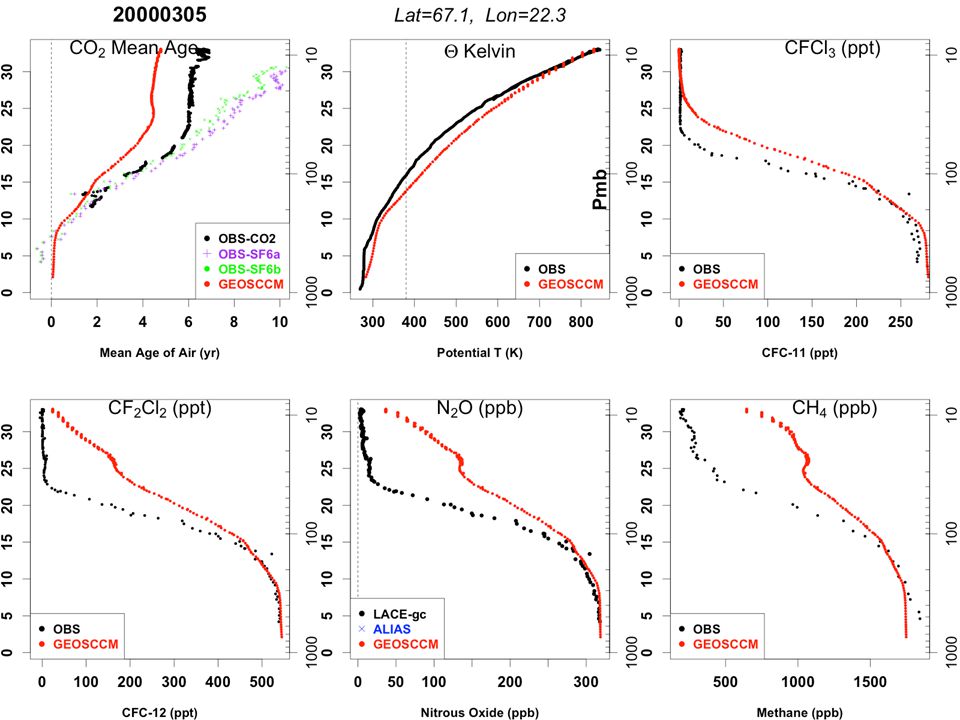
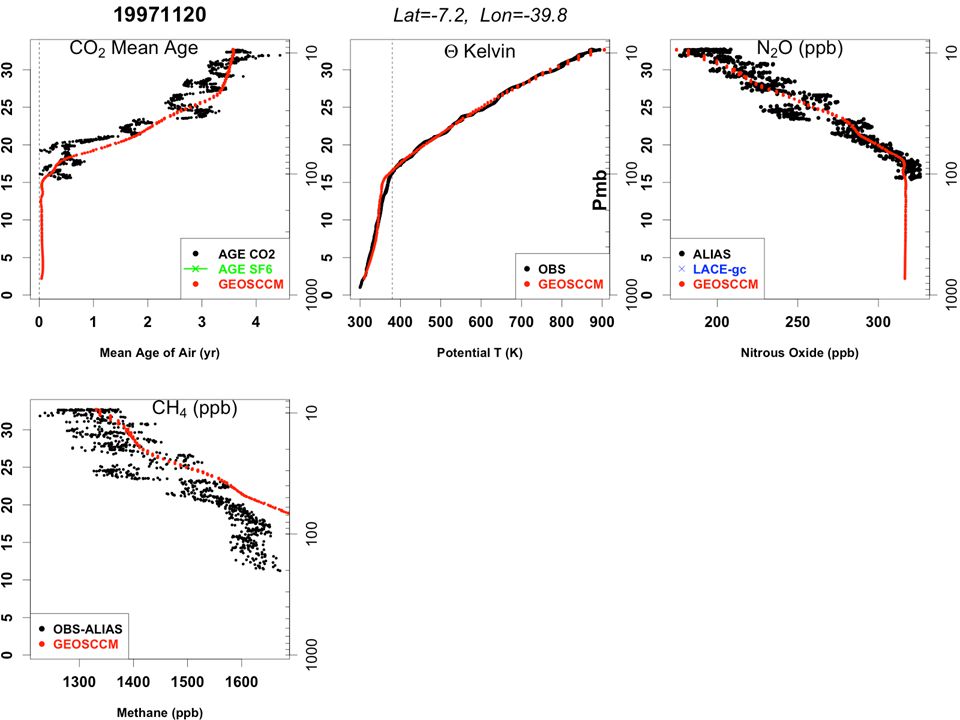
100 150 200 250 300 356 358 360 362 364 366 368 370 N 2 O (ppb) CO 2 (ppm) 0 50 100 150 200 250 CFCl 3 Observations of the Middle Stratosphere (OMS) 1998 05 18 Ft. Sumner (34 N) GEOSCCM Obs (corr CH 4 ) GEOSCCM Obs
 GEOSCCM Obs (corr CH 4 ) GEOSCCM Obs.")
21
Z* (km)
")
24
Eric Ray Andreas Engel Mean Age of Air 0 2 4 6 8 Observed mean ages in the middle stratosphere are older by 15-25% than for the GEOSCCM model – what is implied about ODS lifetimes? No trend can be discerned due to severe under-sampling, ~ 0 today 32 +/-2 km Mean Age 4.5 5.0 5.5 6.0 1985 1995 2005 Year

27
Tropical average local photolytic lifetimes, 20N—20S. Colored dashed lines represent the cutoff levels for each of the trace gases in the tropics. Source: Moore et al., BAMS 2014. Photolysis rates increase exponentially vs. altitude large change in loss rate w/ small change in vertical extent (Local Loss τ ) 16.1 24.5 32.2 40.7 48.3 Z* (km)
 Z* (km).")
28
Small shifts in tracer distributions in response to 10% increase in overturning circulation Fractional change in tracer vs. alt Change in mean age Fractional change in tracer vs. N 2 O

30
CFC-12 350 400 450 500 390 392 394 396 CO 2 SEAC4RS: Seasonal signal, attenuated full age spectrum Model Age Spectrum is generally excellent!

31
Age of Air (days; GEOSSCM) 0 200 400 600 800 1000 1200 0 500 1000 1500 2000 2500 3000 0 20 40 60 80 100 120 Ethane Ethyne Ethane vs. GEOSCCM mean age Ethyne

32
Ethyne CH 3 Cl CFC-12CO 2 SEAC4RS (all): Tracers of different character vs Potential T
: Tracers of different character vs Potential T")
33
Source: Anderson, Margitan, Stedman, Science, 1977

34
Summary and conclusions CO 2 and SF 6 observations provide accurate mean ages for the middle stratosphere and lifetimes for species removed in the stratosphere. CO 2 is better at high altitudes and latitudes (no mesospheric losses; need to measure CH4 also); SF 6 in lower stratosphere (small seasonal variation). CO 2 provides age spectra for the UT/LS. GEOSCCM tracer fields appear to agree well with many tracers, but too young in middle stratosphere We need a strategy for observing the ongoing evolution of stratospheric climate and composition.
; SF 6 in lower stratosphere (small seasonal variation). CO 2 provides age spectra for the UT/LS. GEOSCCM tracer fields appear to agree well with many tracers, but too young in middle stratosphere We need a strategy for observing the ongoing evolution of stratospheric climate and composition..")
36
SF 6 CCl 4 CFCl 3 HIPPO cross sections, mid-Pacific, Nov 2009 Also Jan 2009, Mar-April 2010, Jun-Jul-Aug-Sep 2011

37
slope=.601 Annual Emission Fluxes derived from HIPPO lower tropospheric gradients SF 6 10 Gg/yr 2010 (adopted from Rigby, based on interannual trend) CCl 4 62 Gg/yr (ratio 6.0 mole/mole vs. SF 6 ; no sink asymmetry adj) CFCl 3 86 Gg/yr (ratio 9.2 mole/mole vs. SF 6 : the elusive residual source) Note: SF 6 latent heat 12 kJ/mole > CFC-11; greater ΔP vap in summer? Similar approach to get emissions of species emitted in the NH & inert in the troposphere
 CFCl 3 86 Gg/yr (ratio 9.2 mole/mole vs. SF 6 : the elusive residual source) Note: SF 6 latent heat 12 kJ/mole > CFC-11; greater ΔP vap in summer. Similar approach to get emissions of species emitted in the NH & inert in the troposphere.")
38
TTL transport rates, Atmospheric Lifetimes, and Global Stratospheric Removal Rates for Greenhouse Gases and Ozone Destroying Substances from CO 2 -tracer relationships Steven C. Wofsy, Jasna V. Pittman, Bruce C. Daube Harvard University Paul A. Newman and Qing Liang Goddard Space Flight Center Elliot Atlas University of Miami Arlyn E. Andrews NOAA ESRL, Global Monitoring Division

40
Michael Volk et al. SH high lat

45
N2O CFC11 CFC12 H1211 lvl0 356.9 358.5 357.2 359.0 co2..ch4 1.5 0.7 1.3 0.6 #age.of.air.lvl0 # N2O CFC11 CFC12 H1211 #6.277696 4.698718 5.960831 4.310113 ## --- below, not corrected for CH4 (big error !) #N2O CFC11 CFC12 H1211 #5.290422 4.248600 5.095080 3.923031
 #N2O CFC11 CFC12 H1211 #")
53
Z* 7*ln( 1000/P) 0 10 20 30 Z* 7*ln( 1000/P) 0 10 20 30
 Z* 7*ln( 1000/P)")
Similar presentations


 continues to decrease in the atmosphere … but its abundance is not consistent with reported emissions and known lifetimes.>")


 An International Global Atmospheric Chemistry (IGAC) Program.>")

, Andreas Engel (1), Thomas Birner (2), Peter Hoor (3) (1)Institute.>")
 in the Upper Troposphere and Stratosphere Michael Barkley & Paul Palmer, University of Edinburgh Chris Boone.>")


 Steven C. Wofsy Global CH 4 Keynote Address, ICDC8, Jena, 18 Sep 2009.>")


