Download presentation
Presentation is loading. Please wait.

1
Contour Lines and Topographic Maps

4
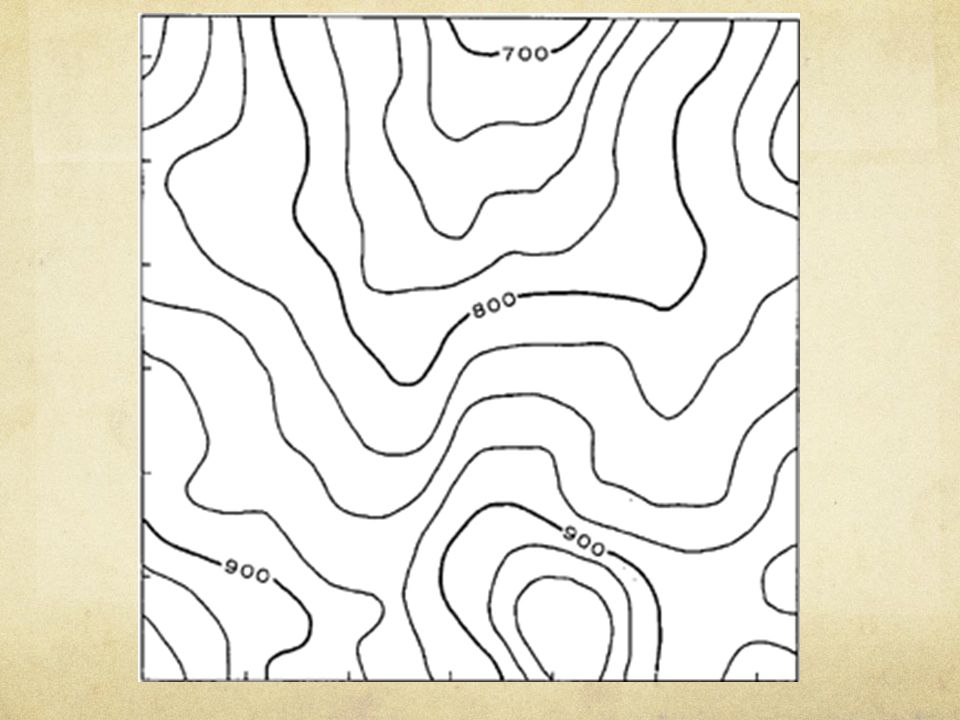
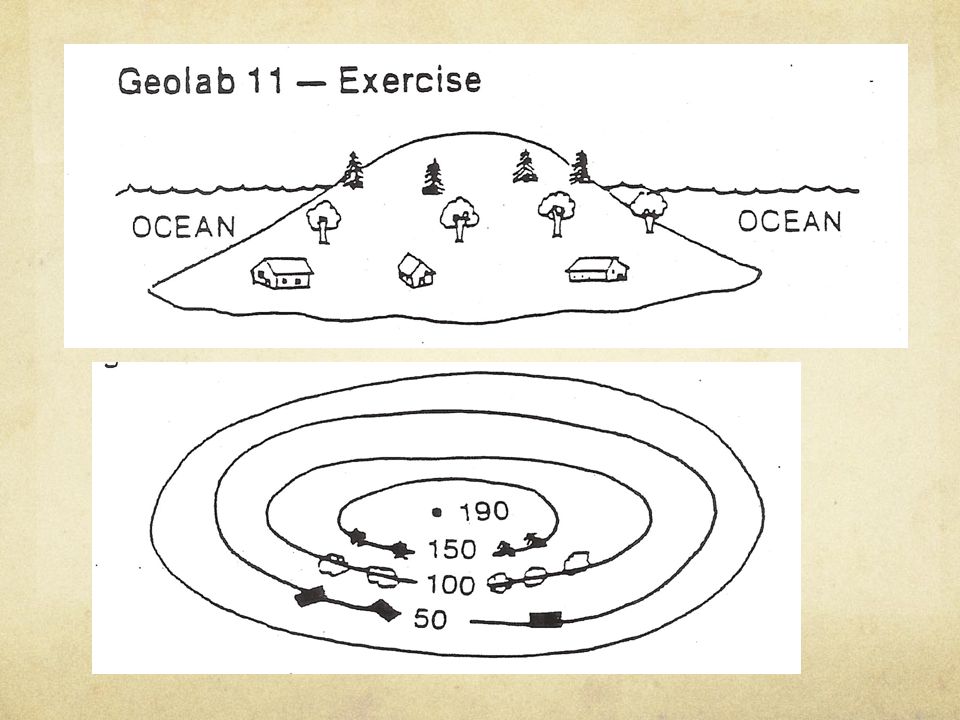
We use contour maps to help us show the 3 dimensional shape of the land on a 2 dimensional map!

5
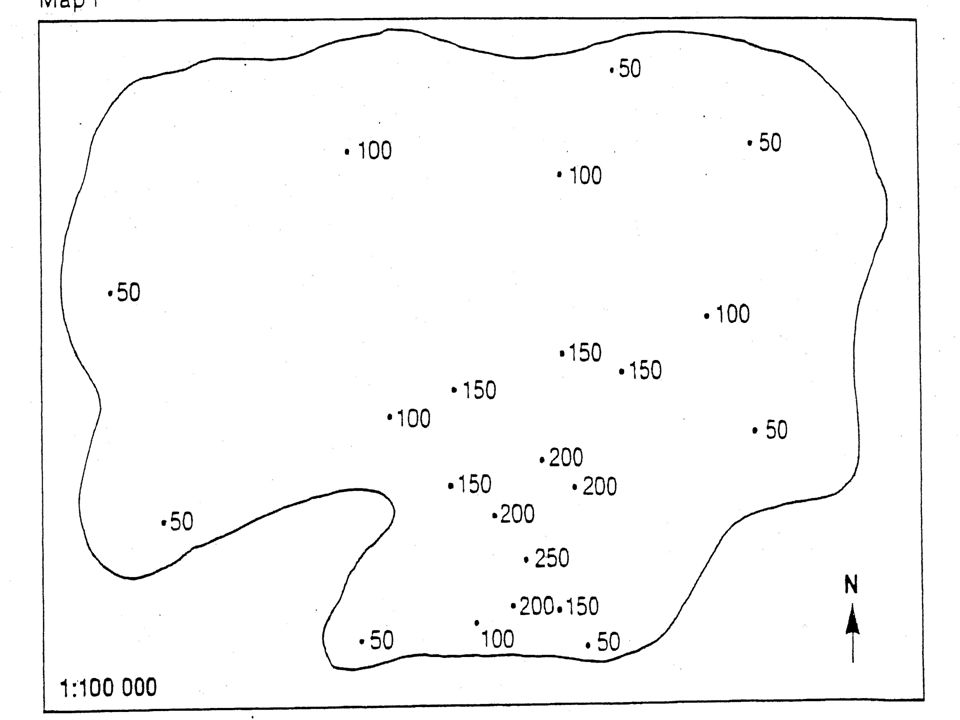
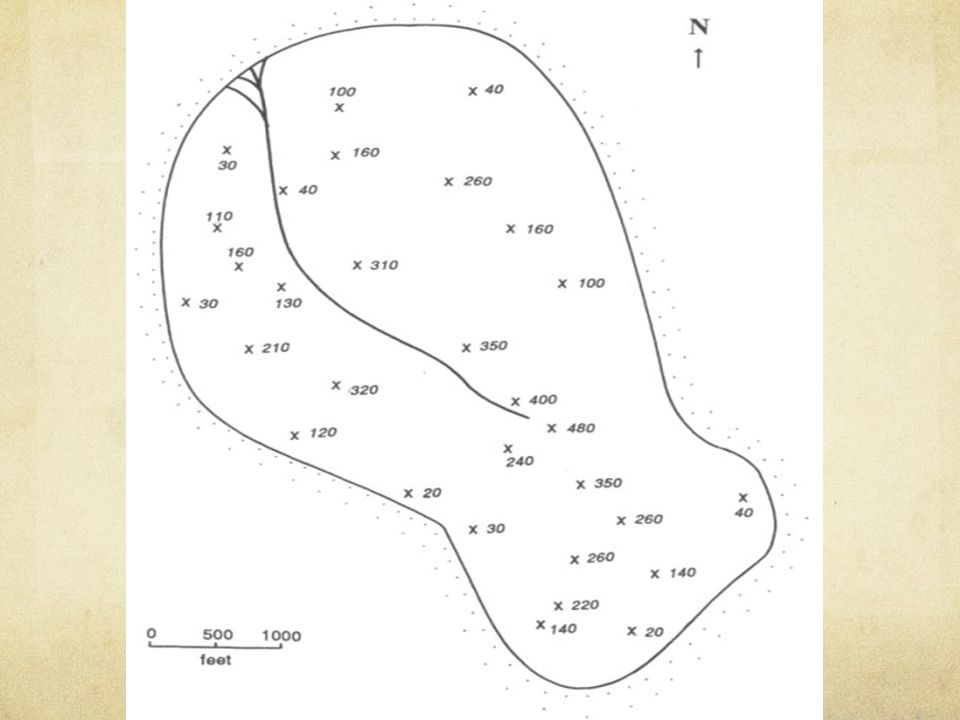
Contours are lines on a map that join places of the same elevation
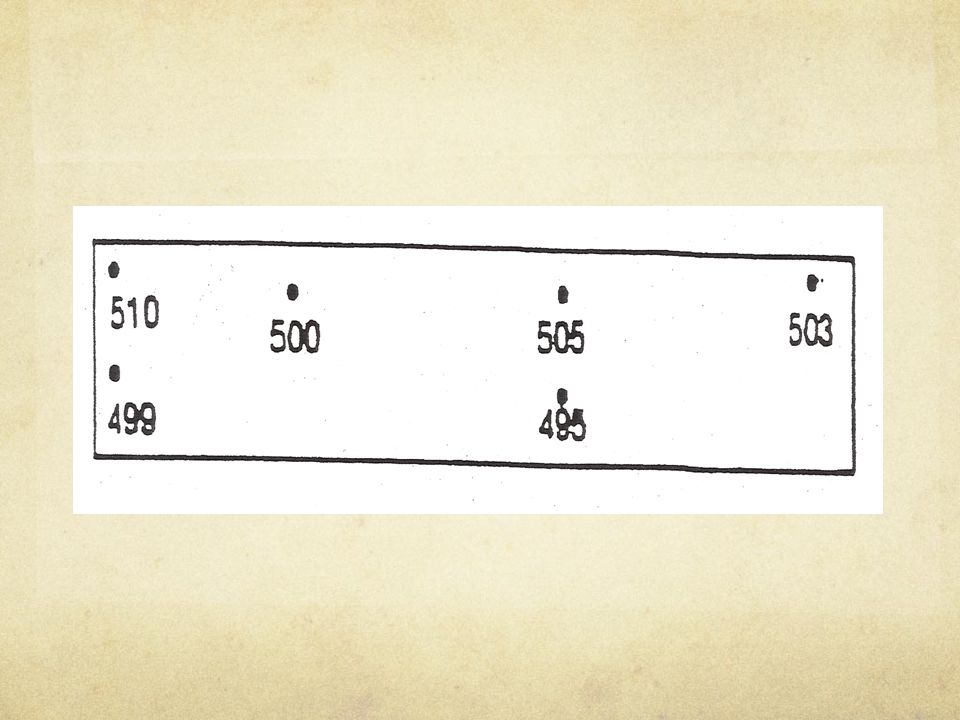
A single dot is the easiest way to show elevation above sea level on a map Contours are lines on a map that join places of the same elevation Contour lines show the form or shape of the land – ex. mountains, islands

7
Rules of Contour Lines Joins places of the same elevation above sea level They never cross or touch other contour lines Contours never end except at the edge of the map or by joining up with themselves A standard contour interval (difference in elevation) is always used. This means that there is an equal height interval between contour lines. The closer the contour lines are to each other, the steeper the slope.
 is always used. This means that there is an equal height interval between contour lines. The closer the contour lines are to each other, the steeper the slope.")
10
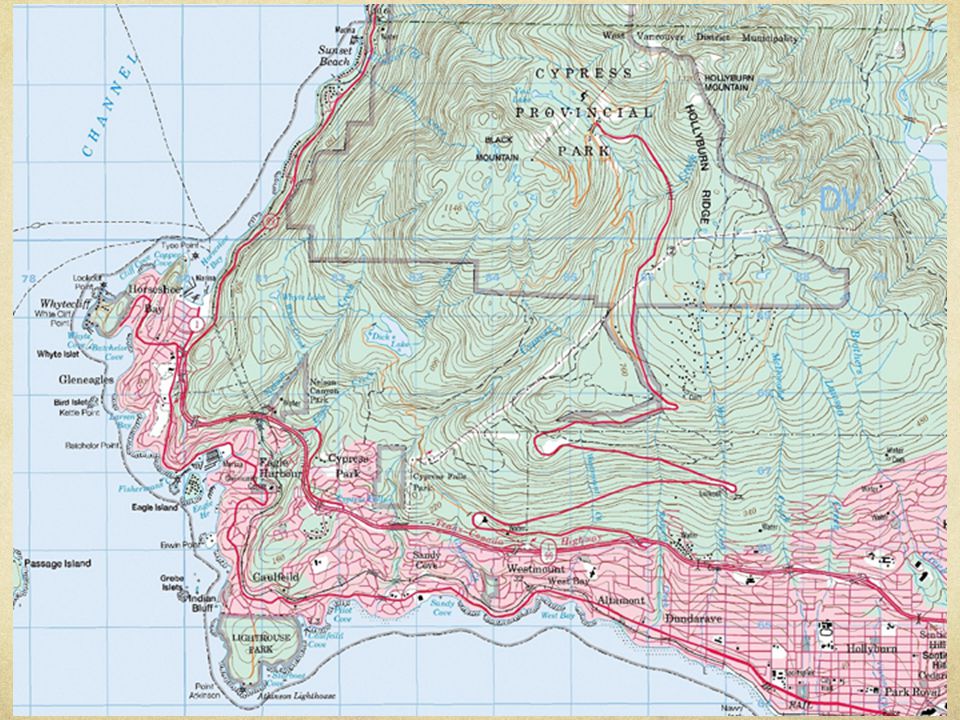
Showing different types of terrain on topographic maps…

Similar presentations


>")


