Download presentation
Presentation is loading. Please wait.

1
Inequality and Poverty in Mexico: 1982-2010 Nora Lustig Samuel Z. Stone Professor of Latin American Economics Tulane University New Orleans, November 17, 2011

2
Inequality and Poverty Trends Two distinct phases: – 1982-1994 - Debt crisis and structural reforms: inequality and poverty rose. – 1994-2006 - Post-NAFTA, economic crisis, recovery and slow-growth: inequality and poverty declined. More recently – 2006-2010 - Great Recession: poverty rose and the decline in inequality lost steam. Sources: Lustig (2010), Campos, Esquivel and Lustig (2011, in progress)
, Campos, Esquivel and Lustig (2011, in progress).")
3
Inequality (Gini) and Poverty (Headcount): 1984-1992 Gini Coefficient Headcount Ratio Gini Coefficient Headcount Ratio
 and Poverty (Headcount): Gini Coefficient Headcount Ratio Gini Coefficient Headcount Ratio")
4
Rise in Poverty: Debt Crisis or Policy? Debt crisis would have caused an increase in poverty no matter what. However: Evidence of “overadjustment:” fiscal policy more contractionary than required to restore macroeconomic balance. Brunt of adjustment was placed on Mexico; no “haircuts” for creditors until ten years later. Fiscal cuts did not protect spending on the poor. Elimination of general subsidies on staples and dismantling of agricultural support schemes were not replaced by compensatory programs => Policies exacerbated the impact of debt crisis on poverty.

5
Slight Decline in Poverty in the Early 1990s: Did Policy Help? Poverty declined slightly nationally, but rose in rural areas and the South and Southeast. Coincided with rural uprisings and revolts; Zapatista uprising the most salient. PRONASOL—Salinas’ administration flagship anti- poverty program– focused on building infrastructure in rural communities. But no safety nets to deal with sharp fall in international coffee prices and dismantling of price support and subsidies in agriculture. => Policy did not help.

6
Inequality (Gini) and Poverty (Headcount): 1984-1992 Gini Coefficient Headcount Ratio Gini Coefficient Headcount Ratio
 and Poverty (Headcount): Gini Coefficient Headcount Ratio Gini Coefficient Headcount Ratio")
7
Rise in Inequality: 1980s and Early 1990s Market Forces or Policy? Unequalizing effect of increase in skilled/unskilled wage gap: – Between 1984 and 1995, real wages for skilled workers rose by around 8 percent and unskilled wages decreased by around 22 percent. Increase in wage gap (skill premium) was linked to: – Trade liberalization and other factors which shifted labor demand towards workers with higher skills. – Reduction in real minimum wages and weaker unions. => Policy contributed to increase in earnings--and hence overall--inequality.
 was linked to: – Trade liberalization and other factors which shifted labor demand towards workers with higher skills. – Reduction in real minimum wages and weaker unions. => Policy contributed to increase in earnings--and hence overall--inequality..")
8
Relative Returns and Relative Supply

9
Decomposition of Differences in the Distribution of Earnings: 1989-1994 Returns (Wage gap)
")
10
Real Minimum Wage Index (Dec. 2010=100)
")
11
Real Minimum Wage 2010=100 Wage distribution with respect to median: 1989 and 2010

12
Unionization Rate

13
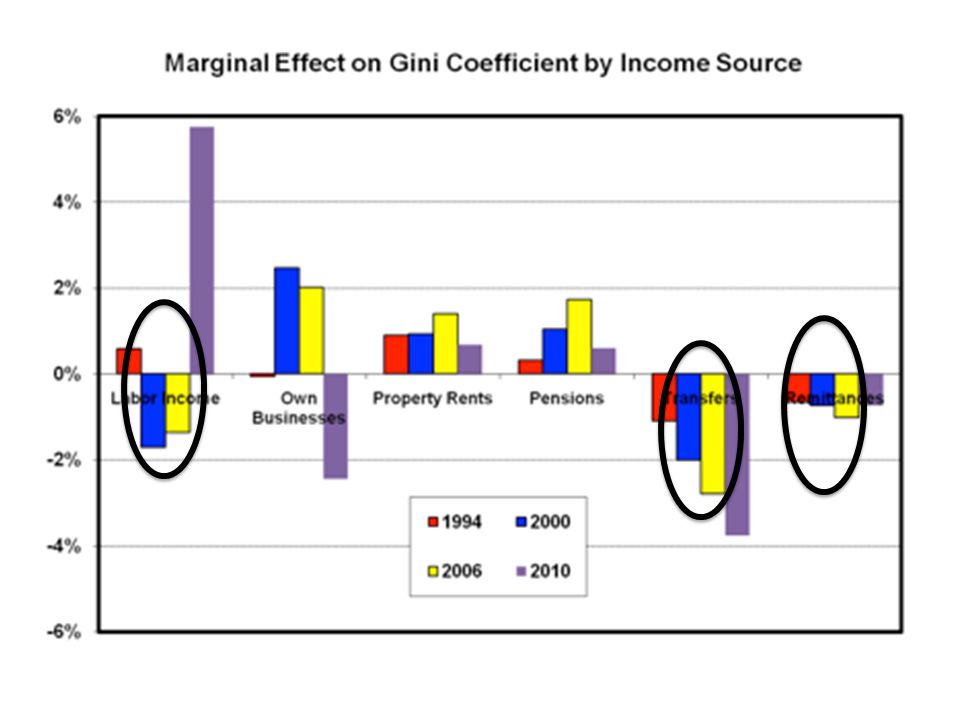
Decline in Inequality: 1994/96-2006 Market Forces or Policy? Labor earnings, government transfers and remittances have been equalizing. Labor earnings have been equalizing because skilled/unskilled wage gap decline. Decline in wage gap linked to rise in relative supply of skilled workers. Real minimum wages remained constant; irrelevant to earnings inequality trends. With launching of CCT Progresa/Oportunidades, government transfers became more progressive.

14
Gini Coefficient: 1984-2006

16
Decomposition of Differences in the Distribution of Earnings: 1994-2006 Returns (Wages gap)
")
17
Relative Returns and Relative Supply

18
Wage distribution with respect to median: 1989 and 2010

19
Decline in Inequality Loses Steam: 2006-2010 New Trend or Great Recession? Too early to tell. But, could be the result of slowing down of educational upgrading; barriers to tertiary education access due to low quality of basic education and opportunity cost of not working

20
Decomposition of Differences in the Distribution of Earnings: 2006 - 2010 Returns (Wage Gap)
")
21
Government Transfers: Change in Gini (Mexico 2008; in %) 21
 21")
22
Government Transfers: Change in Headcount Ratio (Mexico 2008; in %) 22
 22")
23
23

24
Conclusions Rise in poverty and inequality in 1980s and early 1990s: – Debt crisis – Overadjustment: excessive fiscal contraction. – Labor market policy: falling minimum wage and unionization rate. – Structural reforms-cum-wrong type of/missing safety nets: trade liberalization, dismantling of general subsidies with flagship anti-poverty program not focused on income support (PRONASOL).
..")
25
Conclusions Decline in poverty and, particularly, inequality in post-NAFTA 1994-2006: – Mild growth. – Educational expansion resulted in a reduction of skilled/unskilled wage gap. – Government transfers became more progressive and helped increase incomes of the poorest: Conditional Cash Transfer Program PROGRESA/OPORTUNIDADES. – However, there is still a large share of extreme poor not covered by existing safety net.

26
Conclusions Decline in inequality loses steam: 2006-2010; poverty increases in 2008 and 2010. – Educational upgrading might be constrained by both demand and supply factors => skilled/unskilled wage gap will not continue to decline and it may start rising again. – Safety nets not designed to cope with shocks: rising food prices and falling employment and incomes due to macroeconomic shock (Great Recession).
..")
27
THANK YOU

Similar presentations


 Inequality in Europe and the USA March 28 2014.>")


