Download presentation
Presentation is loading. Please wait.

1
Tecniche di amplificazione quantitative, Real-Time PCR Mauro Pistello Dipartimento Patologia Sperimentale Università di Pisa

2
Laser 5’ 3’ Reporter Quencher 5’ 3’ Fluorescence (Förster) Resonance Energy Transfer Light emission Light quenching
 Resonance Energy Transfer Light emission Light quenching")
3
Dye Absorbance (nm) Emission (nm) Extinction Coefficient (cm -1 M -1 ) Cy3552570150000 Cy5643667250000 6-FAM49452583000 Fluorescein49252078000 Joe52054871000 LC Red 640625640110000 Rox58560582000 Tamra56558091000 Tet521536- Light Absorbance and Emission of Fluorescent Dyes TAMRA Dye Spectra
 Emission (nm) Extinction Coefficient (cm -1 M -1 ) Cy Cy FAM Fluorescein Joe LC Red Rox Tamra Tet Light Absorbance and Emission of Fluorescent Dyes TAMRA Dye Spectra")
4
Optical Fiber Lens Cap Tube Thermal Cycler Block Heating Block

5
Laser 5’ 3’ Reporter Quencher 5’ 3’ Fluorescence Resonance Energy Transfer Light emission Light quenching

6
Raw Spectra Quencher Starting cycle Quencher End point Reporter

7
Positive Sample Negative Control Fluorescence Intensity Reporter emission Quencher emission Wavelength Increment of Fluorescence

9
HBV DNA

10
Variability of PCR (96 replicates) C.V. 20 - 50% Number of Cycles 2Rn2Rn
 C.V % Number of Cycles 2Rn2Rn")
11
Variability of PCR (96 replicates) C.V. 6 - 12% Number of Cycles 2Rn2Rn
 C.V % Number of Cycles 2Rn2Rn")
12
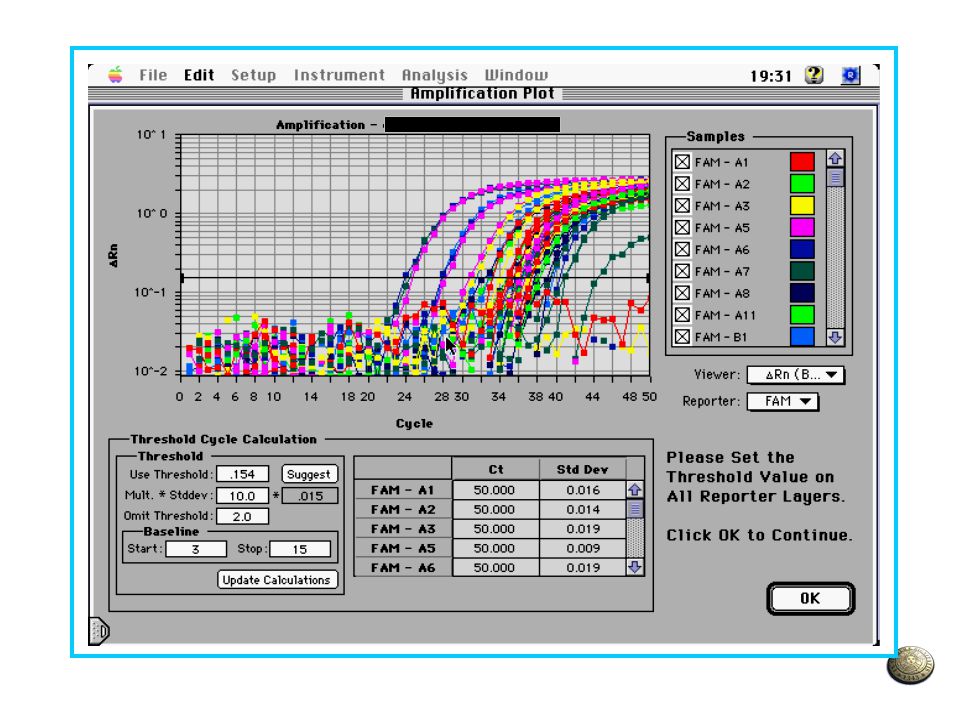
Threshold Cycle (C T ) CTCTCTCT Rn
 CTCTCTCT Rn")
13
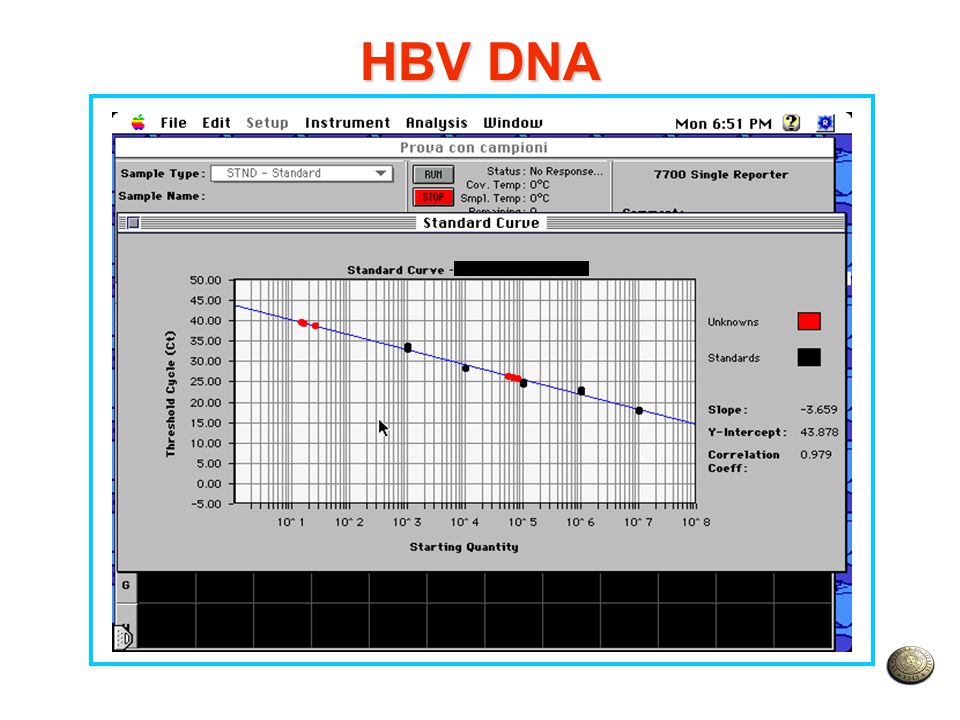
HBV DNA

15
Efficiency of PCR E = 10 (-1/S) – 1 where E = PCR efficiency S = slope SlopeAmplificationEfficiency -3.601.89570.8957 -3.501.93070.9307 -3.401.96840.9684 -3.302.00921.0092 -3.202.05351.0535 -3.102.10171.1017 -3.002.15441.1544
 – 1 where E = PCR efficiency S = slope SlopeAmplificationEfficiency")
16
HBV DNA E = 0.893

17
TTV DNA E = 0.959

18
TechnologyDetection SystemManufacturer PCRTaqMan probeABI, Roche PCRScorpionEurogentec PCRHairpin primerIntergen PCRMolecular BeaconStratagene PCRDye-aloneRoche PCRHybridization ProbesRoche NASBAMolecular BeaconbioMerieux Commercial Real-Time Systems

19
Taqman PCR (1) PolymerizationPolymerization 5’ 3’ 5’ 3’ 5’ R R = Reporter Q = Quencher Denaturation Annealing Q Q
 PolymerizationPolymerization 5’ 3’ 5’ 3’ 5’ R R = Reporter Q = Quencher Denaturation Annealing Q Q")
20
5’ 3’ 5’ 3’ 5’ R = Reporter Q = Quencher. Cleavage R Q Q Taqman PCR (2)
")
21
Scorpions Double-dye probe held in a hairpin loop configuration by a complementary stem sequence

22
Scorpions

23
Hairpin Primers

24
Molecular Beacons Double-dye probe with a stem-loop structure that changes its conformation when the probe hybridizes to the target

25
Hybridization Probes 1. Probes hybridize in head-to-tail arrangement 2. The green fluorescent light emitted by the Fluorescein excites the LC Red 640 that subsequently emits a red fluorescent light

26
Dye-alone a bc Double stranded DNA intercalating dyes (e.g. SYBR Green TM 1)
")
27
Primer-dimer results from extension of one primer using the other one as template, even though no stable annealing between primers is possible Once such an extension occurs, primer-dimer is amplified with high efficiency 5’ 3’ Primer 1 Primer 2

28
Methods for Confirming Specificity of Target Detection in Dye-alone Real-Time PCR Yield of fluorescence at “plateau” in the growth curve Yield of fluorescence at “plateau” in the growth curve T m analysis of the DNA products T m analysis of the DNA products Yield of fluorescence at “plateau” in the growth curve Yield of fluorescence at “plateau” in the growth curve T m analysis of the DNA products T m analysis of the DNA products Rate of increase in fluorescence Temp T m, temperature at which half the DNA is melted or annealed. It depends on DNA sequence and can be determined by heating the DNA to 95°C and slowly cooling. Double strand DNA- specific dyes intercalate with annealed DNA.

29
Quenching in the intact probe Hybridization conditions Cleavage of probe/amplimer hybrids Length and GC-content of oligonucleotides T m probe at least 5° higher than T m primers Avoid the G nucleotide at the 3’ end Avoid secondary structures Factors for Optimal Probe Performance

30
Real-Time NASBA

31
Advantages of Real-Time Amplification Test results in short time Reduced handling, material and labor costs Quantitation over a 5-6 log range High throughput Simultaneous detection of multiple analytes Long shelf-life of labeled probes Low risk of contamination

32
Amplicons Content After PCR Aerosol

33
Disadvantages of Real-Time Amplification Theoretical and real primer and PROBE performances can be very different Assay set up longer than conventional PCR High cost of the real-time instruments Cost of reagents (patent royalties) Cost of probe synthesis
 Cost of probe synthesis")
34
Ruolo dei microarrays in virologia clinica

35
Processes Involved in Making and Using an Array

36
The DNA Microarray Process Technological needs for DNA microarrays

37
Capture Molecules for Protein Arrays

38
TargetTransfusion TransmittedMandatory Testing HBV++ HIV-1,-2++ HCV++ HTLV-I, -II++ HAV+ (rarely)- HGV (GBV-C) a +- TTV a +- CMV++ (subset) HHV-8?- Prion nvCJD?- Parvovirus B19+- Potential Virus Targets for Blood Testing Chips a No disease association. Petrik, Vox Sanguinis 2001 (mod.)
.")
39
DNA microarrayReal-time PCR Sample preparation time4-8 h1.5-2 h Minimum sample volume4 x 10 6 cells 50-100 g RNA 1 to 1 x 10 4 cells 0.01-100 ng RNA Turnaround/data generation time2 days/sample1.5-3.0 h/plate Number of samples per run130-40 per 96-well 150-170 per 384-well Maximum number of targets/sample500-40,0004 Cost/sample$ 2000-8000$ 2-5 DNA Microarrays Versus Real-Time PCR

Similar presentations
>")


