Download presentation
Presentation is loading. Please wait.

1
Understanding User Mobility Based on GPS Data Yu Zheng Microsoft Research Asia

2
Outline Introduction Architecture Walk-Based Segmentation Feature Extraction Graph-based post-processing Experiments Conclusion

3
Introduction (1) Goal & Results: Inferring transportation modes from raw GPS data – Differentiate driving, riding a bike, taking a bus and walking – Achieve a 0.75 inference accuracy (independent of other sensor data) GPS log Infer model
 Goal & Results: Inferring transportation modes from raw GPS data – Differentiate driving, riding a bike, taking a bus and walking – Achieve a 0.75 inference accuracy (independent of other sensor data) GPS log Infer model")
4
Introduction (2) Motivation – For users: Reflect on past events and understand their own life pattern Obtain more reference knowledge from others’ experiences – For service provider: Classify trajectories of different transportation modes Enable smart-route design and recommendation Difficulty – Velocity-based method cannot handle this problem well (<0.5 accuracy) – People usually transfer their transportation modes in a trip – The observation of a mode is vulnerable to traffic condition and weather
 Motivation – For users: Reflect on past events and understand their own life pattern Obtain more reference knowledge from others’ experiences – For service provider: Classify trajectories of different transportation modes Enable smart-route design and recommendation Difficulty – Velocity-based method cannot handle this problem well (<0.5 accuracy) – People usually transfer their transportation modes in a trip – The observation of a mode is vulnerable to traffic condition and weather")
6
Introduction (2) Contributions and insights – A change point-based segmentation method Walk is a transition between different transportation modes Handle congestions to some extent – A set of sophisticated features Robust to traffic condition Feed into a supervise learning-based inference model – A graph-based post-processing Considering typical user behavior Employing location constrains of the real world WWW 2008 (first version)
 Contributions and insights – A change point-based segmentation method Walk is a transition between different transportation modes Handle congestions to some extent – A set of sophisticated features Robust to traffic condition Feed into a supervise learning-based inference model – A graph-based post-processing Considering typical user behavior Employing location constrains of the real world WWW 2008 (first version)")
7
Architecture

8
Walk-Based Segmentation Commonsense knowledge from the real world – Typically, people need to walk before transferring transportation modes – Typically, people need to stop and then go when transferring modes

9
Walk-Based Segmentation Change point-based Segmentation Algorithm – Step 1: distinguish all possible Walk Points, non-Walk Points. – Step 2: merge short segment composed by consecutive Walk Points or non-Walk points – Step 3: merge consecutive Uncertain Segment to non-Walk Segment. – Step 4: end point of each Walk Segment are potential change points

10
Feature Extraction (1) Features CategoryFeaturesSignificance Basic Features DistDistance of a segment MaxViThe ith maximal velocity of a segment MaxAiThe ith maximal acceleration of a segment AVAverage velocity of a segment EVExpectation of velocity of GPS points in a segment DVVariance of velocity of GPS points in a segment Advanced Features HCRHeading Change Rate SRStop Rate VCRVelocity Change Rate
 Features CategoryFeaturesSignificance Basic Features DistDistance of a segment MaxViThe ith maximal velocity of a segment MaxAiThe ith maximal acceleration of a segment AVAverage velocity of a segment EVExpectation of velocity of GPS points in a segment DVVariance of velocity of GPS points in a segment Advanced Features HCRHeading Change Rate SRStop Rate VCRVelocity Change Rate")
11
Feature Extraction (2) Our features are more discriminative than velocity – Heading Change Rate (HCR) – Stop Rate (SR) – Velocity change rate (VCR) – >65 accuracy
 Our features are more discriminative than velocity – Heading Change Rate (HCR) – Stop Rate (SR) – Velocity change rate (VCR) – >65 accuracy")
12
Graph-Based Post-Processing (1) Using location-constraints to improve the inference performance??
 Using location-constraints to improve the inference performance")
13
Graph-Based Post-Processing (2) Transition probability between different transportation modes – P(Bike|Walk) and P(Bike|Driving) Segment[i].P(Bike) = Segment[i].P(Bike) * P(Bike|Car) Segment[i].P(Walk) = Segment[i].P(Walk) * P(Walk|Car)
![Graph-Based Post-Processing (2) Transition probability between different transportation modes – P(Bike|Walk) and P(Bike|Driving) Segment[i].P(Bike) = Segment[i].P(Bike) * P(Bike|Car) Segment[i].P(Walk) = Segment[i].P(Walk) * P(Walk|Car)](http://images.slideplayer.com/19/5795856/slides/slide_13.jpg "Graph-Based Post-Processing (2) Transition probability between different transportation modes – P(Bike|Walk) and P(Bike|Driving) Segment[i].P(Bike) = Segment[i].P(Bike) * P(Bike|Car) Segment[i].P(Walk) = Segment[i].P(Walk) * P(Walk|Car)")
14
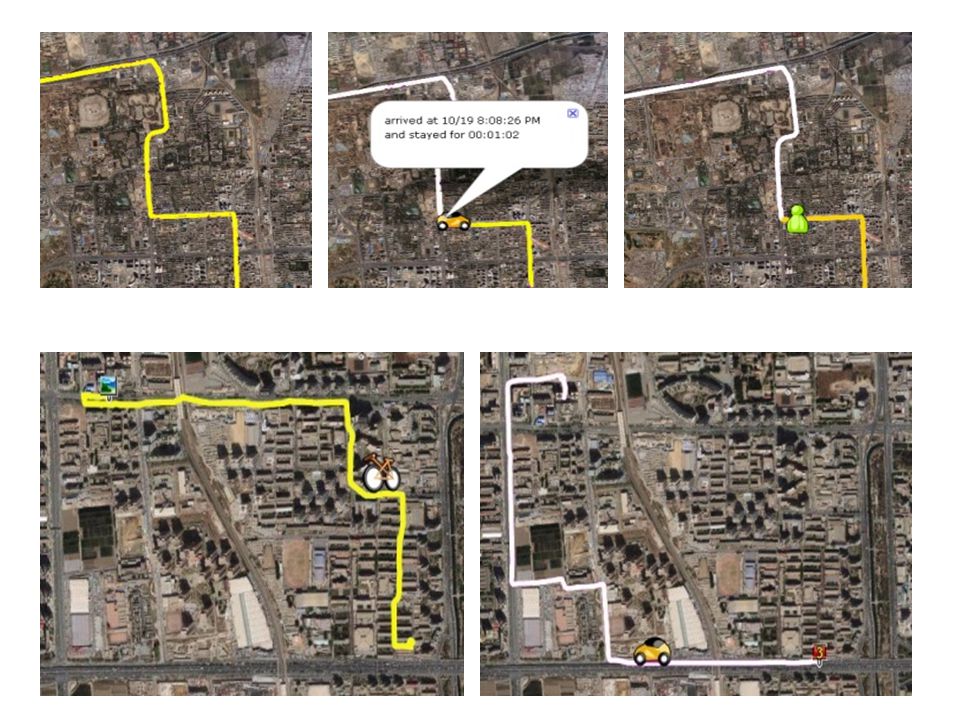
Graph-Based Post-Processing (3) Mine a implied road network from users’ GPS logs – Use the location constraints and typical user behaviors as probabilistic cues – Being independent of the map information
 Mine a implied road network from users’ GPS logs – Use the location constraints and typical user behaviors as probabilistic cues – Being independent of the map information")
15
Graph-Based Post-Processing (4)
")
16
Experiments (1) Framework of Experiments
 Framework of Experiments")
17
Data and Devices

18
Experiments (2) RankFeatureASAS ADAD RankFeatureASAS ADAD 1HCR0.3450.5618DV0.2690.357 2SR0.3350.5619MaxV20.3220.344 3AV0.3820.54710MaxV10.2940.257 4VCR0.3360.52611MaxA20.2390.217 5EV0.3750.52312MaxA10.2590.208 6Dist0.3020.49913MaxA30.2560.197 7MaxV30.3340.365 Single Feature Exploration
 RankFeatureASAS ADAD RankFeatureASAS ADAD 1HCR DV SR MaxV AV MaxV VCR MaxA EV MaxA Dist MaxA MaxV Single Feature Exploration")
19
Feature Combinations Transportation modeChang Point ASAS ADAD PrecisionRecall MaxA1 + MaxA2 + MaxA30.2970.2830.1180.584 MaxV1 + MaxV2 + MaxV30.4800.5260.1420.687 Distance + EV + AV0.4800.5500.2270.582 Distance + EV + MaxV10.5480.5970.2170.55 AV + EV + MaxV10.5580.6210.2530.603 MaxV3 + MaxA3 + AV0.5110.6320.1380.669 SR + HCR + VCR0.5750.6440.2860.643 Basic Features0.6180.6730.2840.681 Basic Features + Advanced Features0.6350.7150.3730.724

20
ADAD CP/PCP/R Enhanced Features (EF)0.7280.4910.817 EF + normal post-processing0.7410.5080.818 EF + graph-based post-processing0.7620.5160.818
 EF + normal post-processing EF + graph-based post-processing")
21
Ground truth Predicted Results (KM) WalkDrivingBusBike Walk 1026.4122.1386.5357.3 0.54 3 Recall Driving 42.62477.3458.5235.1 0.771 Bus 34.8164.71752.446.2 0.877 Bike 49.3113.531.91234.3 0.864 0.8910.8610.6660.659 0.762 Precision
 WalkDrivingBusBike Walk Recall Driving Bus Bike Precision")
Similar presentations


 Yu Zheng (Microsoft Research.>")


