Download presentation
Presentation is loading. Please wait.

1
Dropout Data Report State Information 2011-2012 February 12, 2013

2
Dropout Definition A dropout is an individual who Was enrolled in school at some time during the reporting year; Was not enrolled on day 20 of the current year; Has not graduated from high school or completed a state or district approved educational program; Does not meet any of the following reporting exclusions: Transferred to another public school district, private school, home school or state/district approved educational program including charter schools Temporarily absent due to suspension or school approved illness, or Death

3
Graduation Rate Definition The four year cohort graduation rate released by the state measures the percentage of students who enter high school and graduate in four years or less. The four year cohort graduation rate released by the state measures the percentage of students who enter high school and graduate in four years or less. This rate does not reflect students who may take five years to graduate from high school. This rate does not reflect students who may take five years to graduate from high school.

4
General Findings for North Carolina 2011-2012 High Schools in North Carolina reported a dropout rate of 3.01 %, a decrease from the 3.43% rate reported from the previous year. High Schools in North Carolina reported a dropout rate of 3.01 %, a decrease from the 3.43% rate reported from the previous year.

5
Dropout Count –The 13,488 dropouts recorded in grades 9-13 represented a 12.1 % decrease from the 15,342 reported in 2010-2011. –The largest 3-year decreases in high school dropout count were found in Forsyth, Gaston, Guilford, Charlotte-Mecklenburg, and Pitt. Charlotte-Mecklenburg, and Pitt. –This is the fourth consecutive year Forsyth has been recognized as a county with the largest 3 year drop.

6
Urban Comparison of School Systems 2011-2012 School SystemDropout Rate Charlotte-Mecklenburg3.20 Durham3.55 Guilford2.15 Wake2.83 WS/FCS3.38 State of North Carolina3.01%

7
Trend Data Urban Comparison: 7 years

8
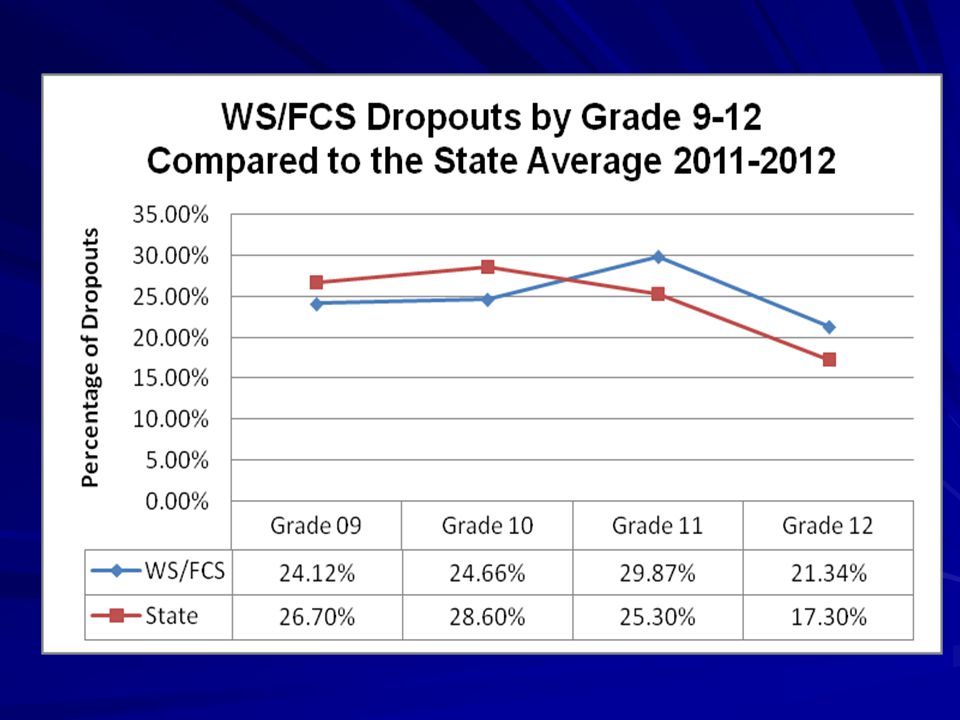
WS/FCS District Dropout Data 2011-2012

9
Twenty Three Years of Dropout Data 9-12 Forsyth County

10
State Rate Compared to Forsyth County Rate Grades 9-12 YearState Rate Forsyth County RatePercent Difference 2002-20034.78%5.33%+0.55 2003-20044.86%5.18%+0.32 2004-20054.74%5.00%+0.26 2005-20065.04%5.74%+0.70 2006-20075.24%6.43%+1.19 2007-20084.97%5.49%+0.52 2008-20094.27%4.76%+0.49 2009-20103.75%4.07%+0.32 2010-20113.43%3.81%+0.38 2011-20123.01%3.38%+0.37

11
Distribution of Dropouts for 2011-2012 Grades 1-12 Grade (s) Grade (s) Number of Students Percentage of Percentage of Students Students 1-620.36% 710.18% 861.10% 913023.72% 1013324.27% 1116129.38% 1211520.99% Total548100%
 Grade (s) Number of Students Percentage of Percentage of Students Students % % % % % % % Total548100%")
12
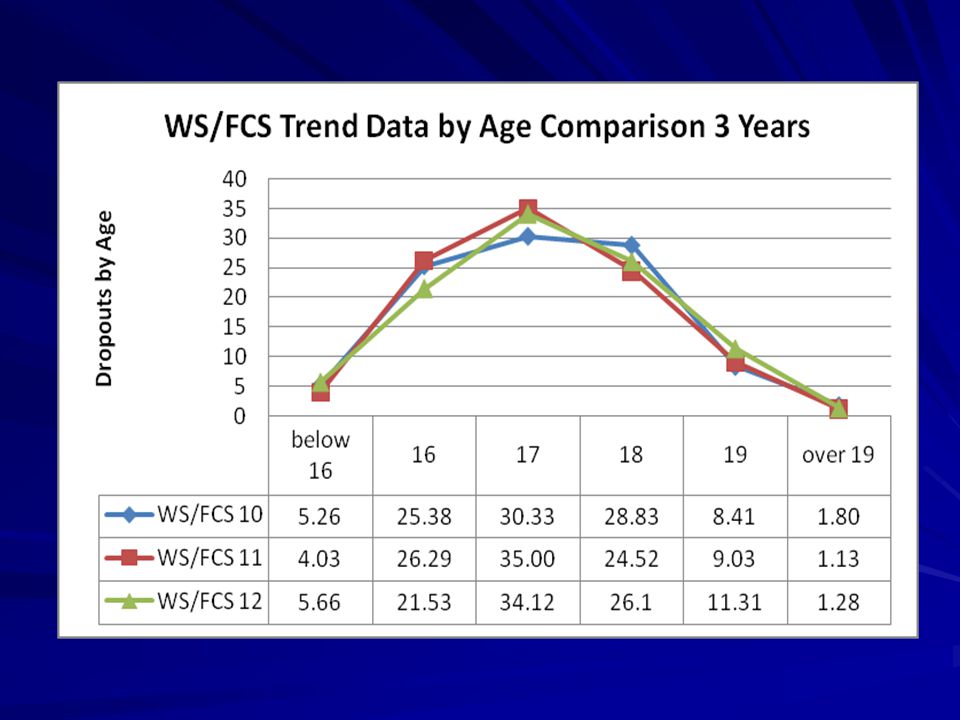
WS/FCS Grade Trend Data 2008-2009 to 2011-2012

15
Ethnicity Number of Students Percentage of Dropouts Percentage of Membership White18633.94%45.79% Black20337.04%31.41% Hispanic12923.54%16.30% Other305.48%6.50% Total548100%100% 2011-2012 Ethnic Breakdown of Dropouts 7-12

16
WS/FCS Race Gender Trend Data 2008-2009 to 2011-2012

17
Dropout Reasons 2011-2012

18
WS/FCS School Dropout Data 2011-2012

19
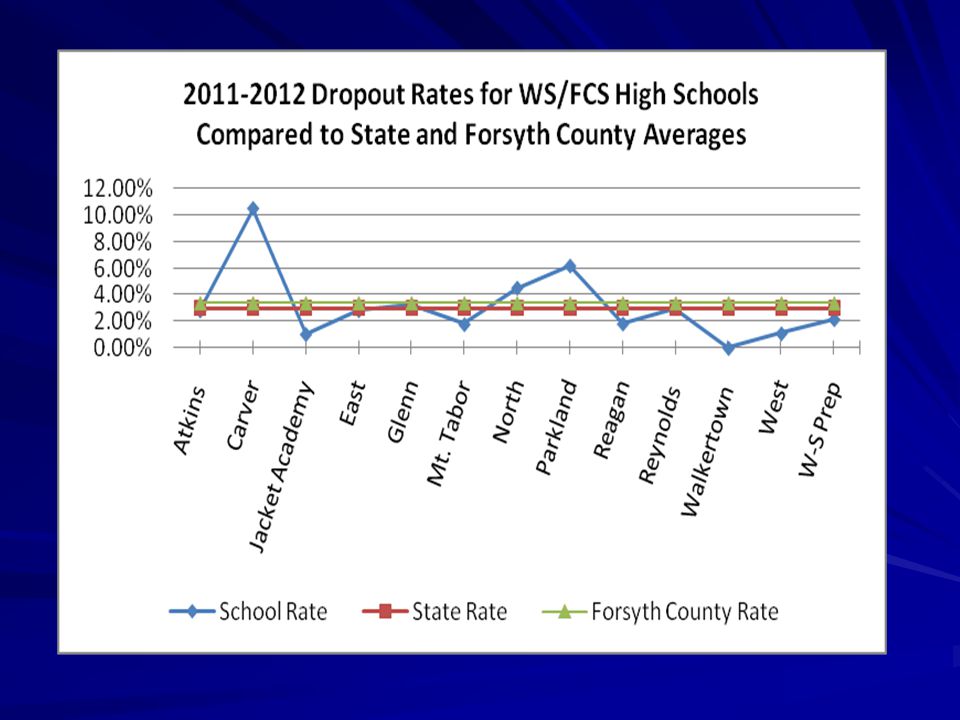
2011-2012 Dropout Data for High Schools WS/FCS Dropout Rate 3.38% School School Number Number Dropout Rate Dropout Rate Atkins Acad 10 10 2.81% 2.81% Carver High 80 80 10.46% 10.46% Carver Jacket 1 1.04% 1.04% East Forsyth 56 56 2.82% 2.82% Glenn 54 54 3.24% 3.24% Mount Tabor 29 29 1.78% 1.78%

20
2011-2012 Dropout Data for High Schools School School Number Number Dropout Rate North Forsyth 57 57 4.50% 4.50% Parkland 90 90 6.16% 6.16% Reagan 32 32 1.83% 1.83% Reynolds 53 53 2.98% 2.98% Walkertown0 0.00% 0.00% West Forsyth 22 22 1.10% 1.10% WS Prep 4 2.15% 2.15%

21
2011-2012 Dropout Data for Special Schools SchoolNumber Dropout Rate Carter High 2 1.18% 1.18% Early College 0 0.00% 0.00% Main Street Academy 20 20 54.05% 54.05% Middle College 23 23 25.56% 25.56%

23
Summary Schools working efficiently to reduce the number of students leaving school before graduation. Schools working efficiently to reduce the number of students leaving school before graduation. WS/FCS had a decrease of 72 students dropping out during the 2011-2012 school year. WS/FCS had a decrease of 72 students dropping out during the 2011-2012 school year. WS/FCS was cited by the state as one of the systems with the largest 3-year decreases in dropout counts for the fourth consecutive year. WS/FCS was cited by the state as one of the systems with the largest 3-year decreases in dropout counts for the fourth consecutive year.

24
Summary Continued 10 High Schools showed a decrease in their dropout rate. 10 High Schools showed a decrease in their dropout rate. WS/FCS continues to work with students, parents, and the community to provide opportunities for students to graduate. WS/FCS continues to work with students, parents, and the community to provide opportunities for students to graduate.

Similar presentations


 Credit Recipients Shoumi Mustafa and.>")


 Report 2010-2011 Presented to ACISD Board of Trustees 12/15/2011 ARANSAS COUNTY ISD – A TEA RECOGNIZED SCHOOL.>")


