Download presentation
Presentation is loading. Please wait.

1
Cape Town AIDS Cohort-CTAC Electronic Data Sets Robin Wood Desmond Tutu HIV Centre University of Cape Town

2
Photograph of Masiphumelele

3
CTAC Data Sets Natural history cohort 1984-2000 Hospital-based ART trials 1996-2003 Community-based ART programmes 2002-2003 Web-based ART Register

4
Natural History Cohort 1984-2000 Epi-info based –Flow charts of 2088 outpatients –Laboratory, clinical data, OI prophylaxis Pros –Doctors like flow charts of CD4 & WHO stages but not perceived non-useful data! Cons –Data transfer, LTFU, missed hospitalisations & deaths required other data sources Outputs –OI frequency, Kaplan-Meier survival

5
CTAC: Incidence Rates of Opportunistic Infections CTAC 2002 CD4+ T-cells/mm 3

6
Hospital-based ART Trials 1996- 2003 Excel spread sheet of CRF data –Lab, clinical events, hospitalisations, deaths Pros: –Trial data good quality, variable CD4 entry criteria, frequent visit intervals Cons: –Extracting data laborious Outputs: –Changed disease progression –Resource utilisation

7
TB incidence rates & cases prevented per 100 pys of HAART Cases saved 1.3 9.4 11.318.8 95% CI (0.3-2.9) (3.8-14.3) (6.2-19.1) (13.2-26.1) WHO 1&2 Badri, Wilson, Wood Lancet 2002
 ( ) ( ) ( ) WHO 1&2 Badri, Wilson, Wood Lancet 2002")
8
Progression-free survival of Triple vs NOART: WHO stage 1&2 CategoryNPatients progressing to to higher stages Patients not progressing To higher stages P-value Triple1286 (4.7%)122 (95.3%)<0.0001 NoART14052 (37.1%)88 (62.9%)
122 (95.3%)< NoART14052 (37.1%)88 (62.9%)")
9
Progression-free survival of Triple vs NOART: WHO stage 3 CategoryNPatients progressing to higher stages Patients not progressing to higher stages P-value Triple8513 (15.3%)72 (84.7%)0.014 No ART15546 (29.7%)109 (70.3%)
72 (84.7%)0.014 No ART15546 (29.7%)109 (70.3%)")
10
Progression-free survival of Triple vs NOART: WHO stage 4 CategoryNPatients progressing to higher stages Patients not progressing to higher stages P-value Triple354 (11.4%)31 (88.6%)0.19 NoART14230 (21.1%)112 (78.9%)
31 (88.6%)0.19 NoART14230 (21.1%)112 (78.9%)")
11
Days/yr (95% CI) OR (95% CI) AV cost PY (95% CI) WHO Stages 1&2 HAART0.7 (0.55-0.82)0.2 (0.14-0.27)525 (392-694) No ART4.4 (3.9-4.9)13,351 (2873-3888) WHO Stage 3 HAART1.4 (1.25-1.65)0.13 (0.11-0.15)1,113 (980-1293) No ART10.9 (10.29-11.46)18,512 (8065-8982) WHO Stage 4 HAART6.3 (5.58-6.98)0.4 (0.38-0.49)4,899 (4374-5471) No ART14.6 (13.81-15.33)111,412 (10824-12016) HAART impact on hospitalisation (1995-2000)
 OR (95% CI) AV cost PY (95% CI) WHO Stages 1&2 HAART0.7 ( )0.2 ( )525 ( ) No ART4.4 ( )13,351 ( ) WHO Stage 3 HAART1.4 ( )0.13 ( )1,113 ( ) No ART10.9 ( )18,512 ( ) WHO Stage 4 HAART6.3 ( )0.4 ( )4,899 ( ) No ART14.6 ( )111,412 ( ) HAART impact on hospitalisation ( )")
12
Usapho Lwethu Community ART Data sources and follow up Patient live in recruitment area & must have attended local HIV clinic for > 6 months Household support by “Sizophila monitor” Schedule 1 NNRTI, schedule 2 PI/r Single referral hospital Post mortem is requested on all deaths Access to national mortality data base via “ID number”

13
Community ART Programme 2002-2003 Sequel database, data capture sheets –Laboratory, clinical, QOL, adherence data Pros –Fixed visit schedule, LTFU rate low but deaths high, data captured on “lap-top” Cons –Needs data administrator, active search for missing data Outputs –Programme status reports of CD4, VL, survival etc

14
Clinical Trials vs Community Clinic Clinical trials n=299 Community n=103 Median CD4230 cells/ul82 cells/ul WHO stage 3&449.8%92.9% Treatment ART RegimenNNRTI 58.2% PI 39.1% Triple NRTI 2.7% NNRTI 100% Results at 16 weeks VL<400 copies/ml75.5% (CI 71-80)94.2% (CI 88-100) LTFU51 Deaths2 (0.69%)7 (6.8%)
94.2% (CI ) LTFU51 Deaths2 (0.69%)7 (6.8%)")
16
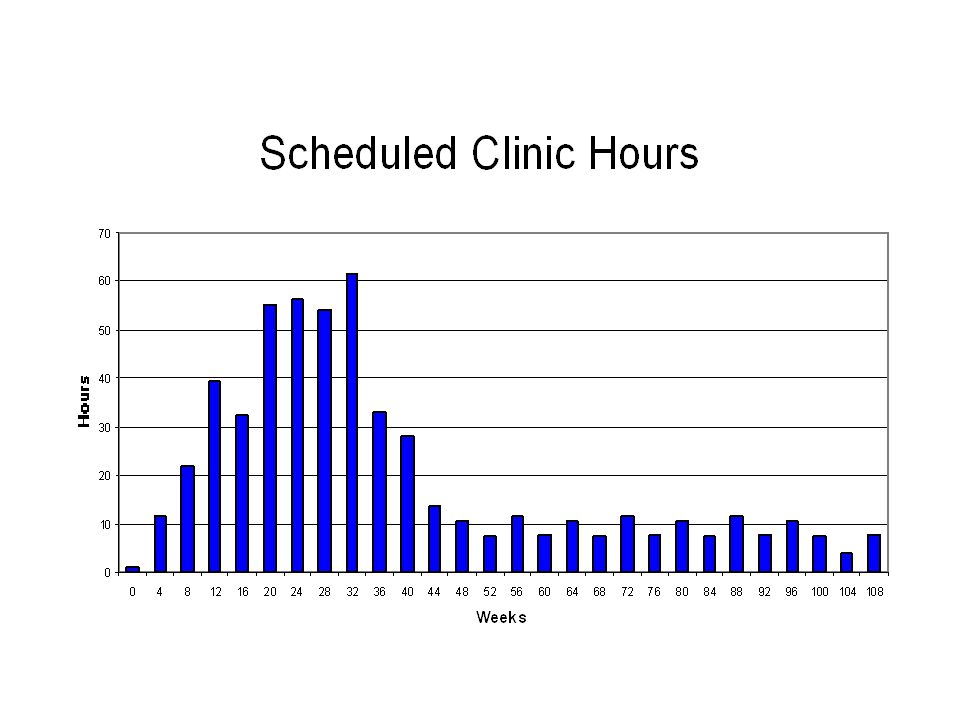
Monthly drug costs of d4T, 3TC, EFV in study period from Sept 02-May 03 $159 $73 $41 US$ cost calculated @ R8 per $

17
Cost per patient R8856 per annum

18
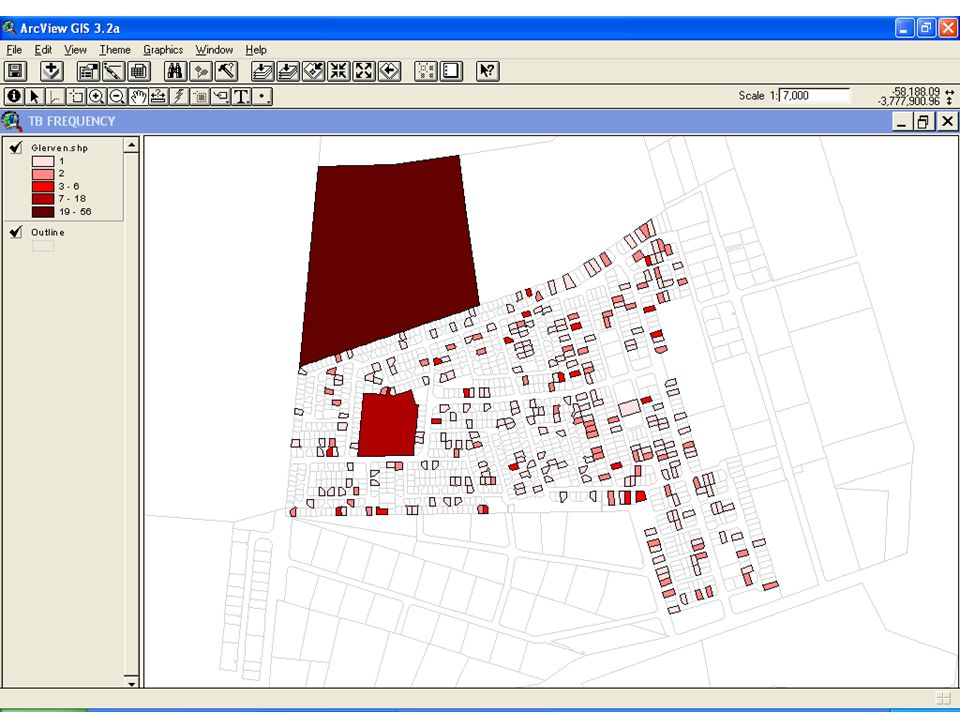
Aerial Photograph of Masiphumele

20
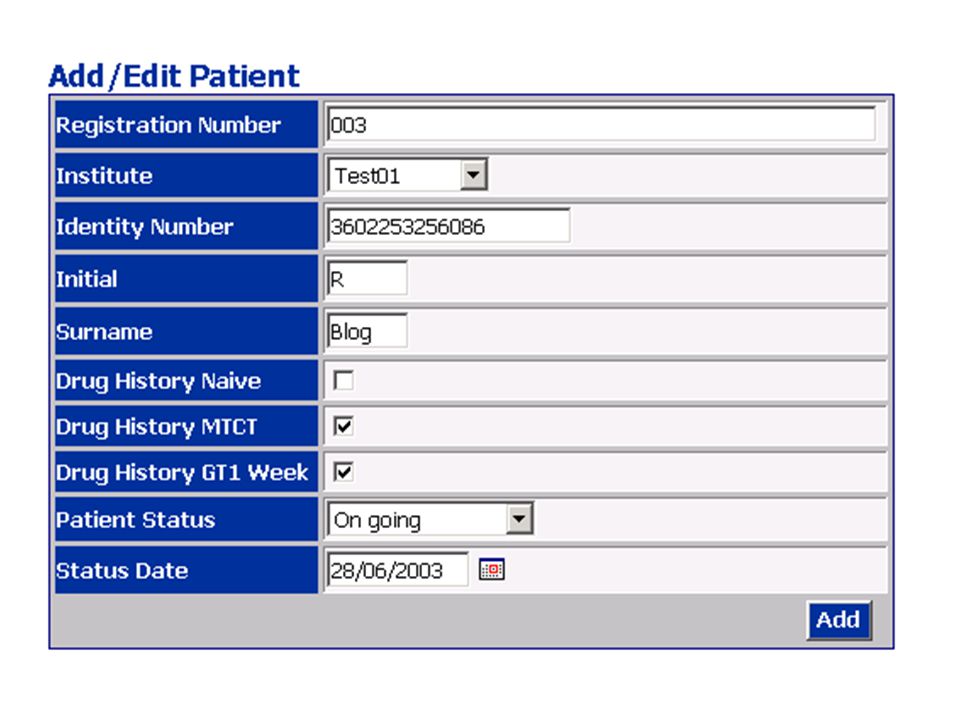
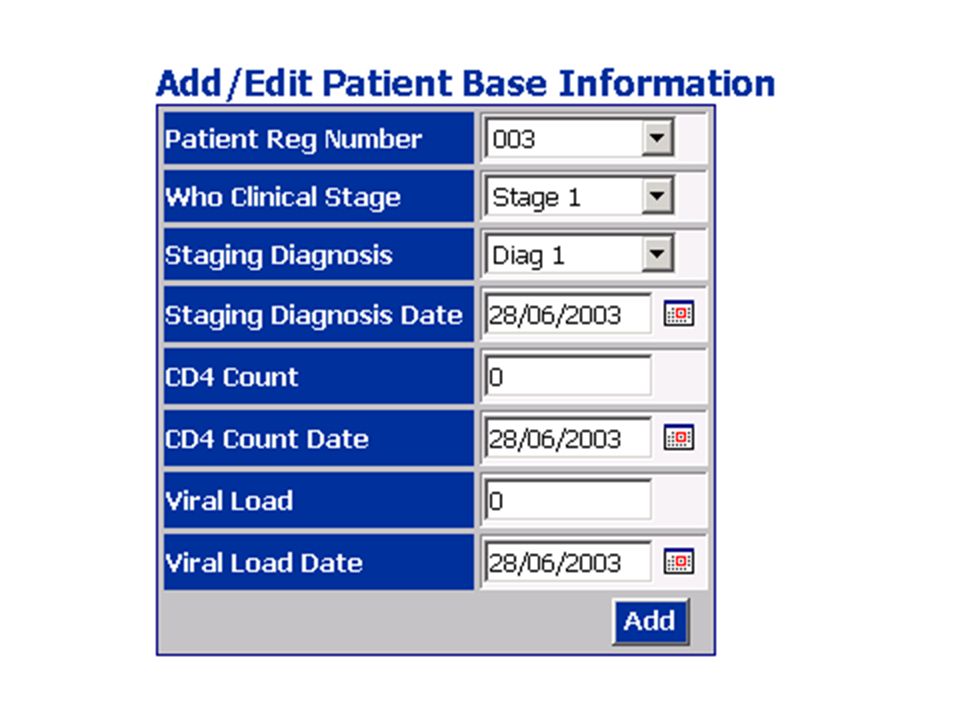
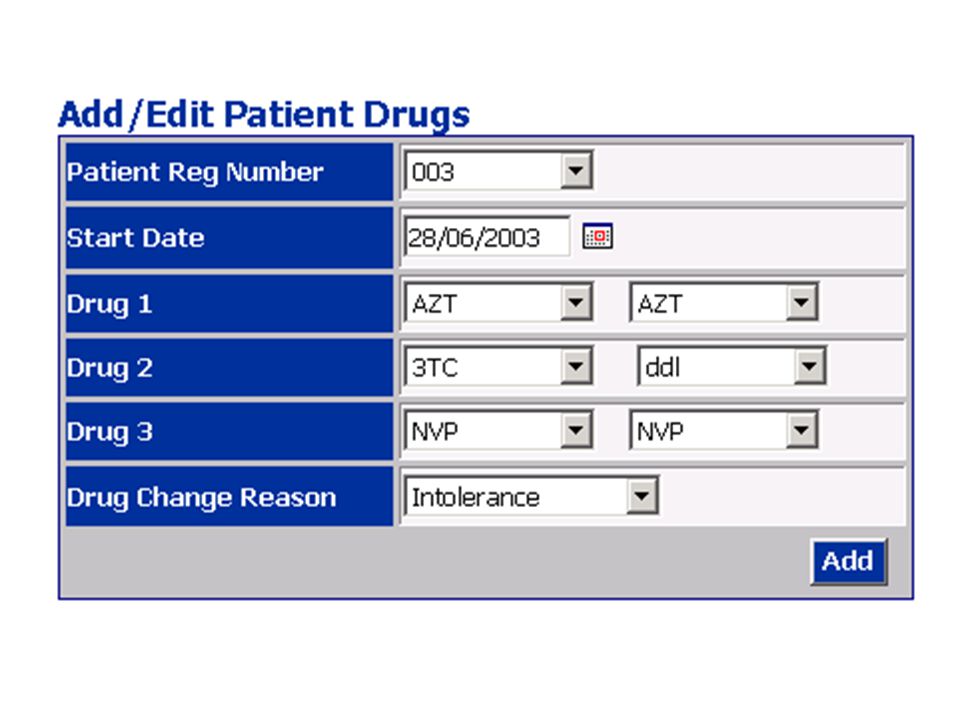
Pilot National ART Register Web-based minimum data from ART programme linked to drug supply –ID number –Clinical stage –Current drug prescriptions Linked to laboratory & pharmacy data –CD4 & Viral load monitoring –Drug monitoring

24
Proposed Register Outputs Patient retention, number on Rx, LTFU and discontinuing Drug switching patterns Time to first failure (MTCT exposure?) Survival (benefit if compare with natural history model!) Drug accountability, dispensing to patients & “leakage” Laboratory outcomes CD4/viral suppression at time-points, resistance
 Survival (benefit if compare with natural history model!) Drug accountability, dispensing to patients & leakage Laboratory outcomes CD4/viral suppression at time-points, resistance")
25
ACKNOWLEGEMENTS FUNDING AGENCIES NIH Cipra-SA BMS “Secure the Future” Foundation Hannan Crusaid Trusts Heiser Foundation Doris Duke Foundation UCT AIDS COHORT-CTAC Motasim Badri, Desmond Tutu HIV Centre, UCT Eduard Beck, McGill University, Montreal, Canada Linda-Gail Bekker, Desmond Tutu HIV Centre, UCT Gary Maartens, Dept of Medicine, Groote Schuur Hospital, UCT Kwesi Matoti, PAWC Gugulethu Catherine Orrell, Desmond Tutu HIV Centre, UCT Larissa Reader, Desmond Tutu HIV Centre, UCT Eve Sabotski, PAWC South Peninsula Douglas Wilson, Dept of Medicine, Somerset Hospital, UCT

26
Sizophila Team April 2003 Photograph of Sizophila Team

Similar presentations