Download presentation
Presentation is loading. Please wait.

1
CORRELATIO NAL RESEARCH METHOD

3
The researcher wanted to determine if there is a significant relationship between the nursing personnel characteristics and their assessment of the Training Program of a Private Hospital.

4
Nursing Personnel Characteristics as Correlates on their Assessment of the Basic Intravenous Therapy Training Program: Basis for Sustained Training Courses RESEARCH TITLE Researcher: Arlene Zita B. Brillantes

5
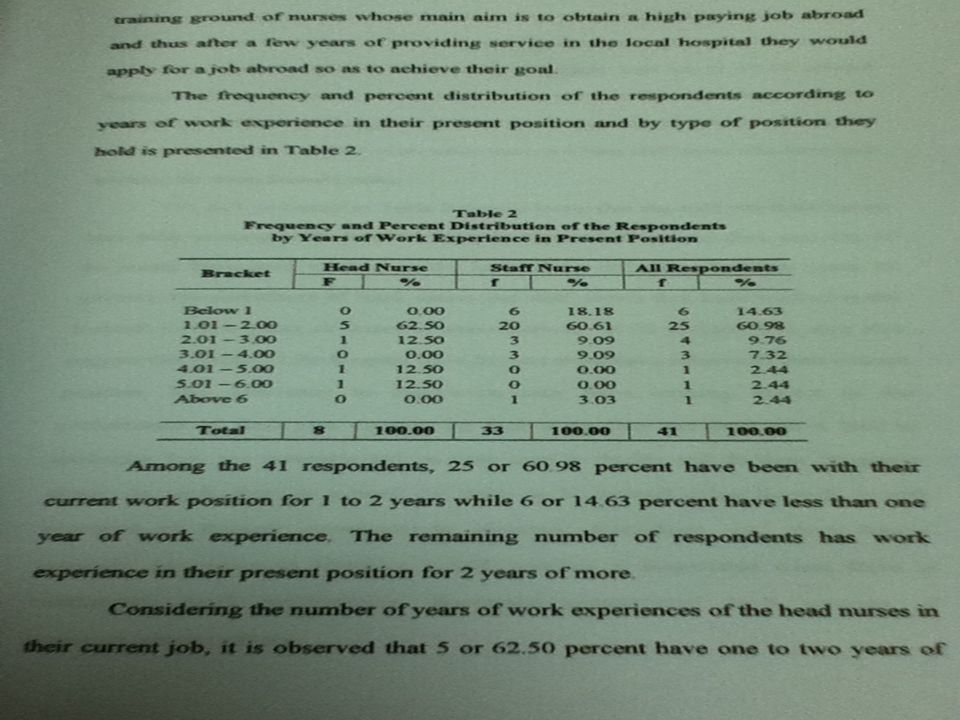
The participants in this study were the 32 staff nurses and 8 head nurses of the selected private hospital in Bulacan for a total of 40 sample respondents. They were selected considering that they have already attended the Basic Intravenous Therapy Training Program. RESEARCH SAMPLING

6
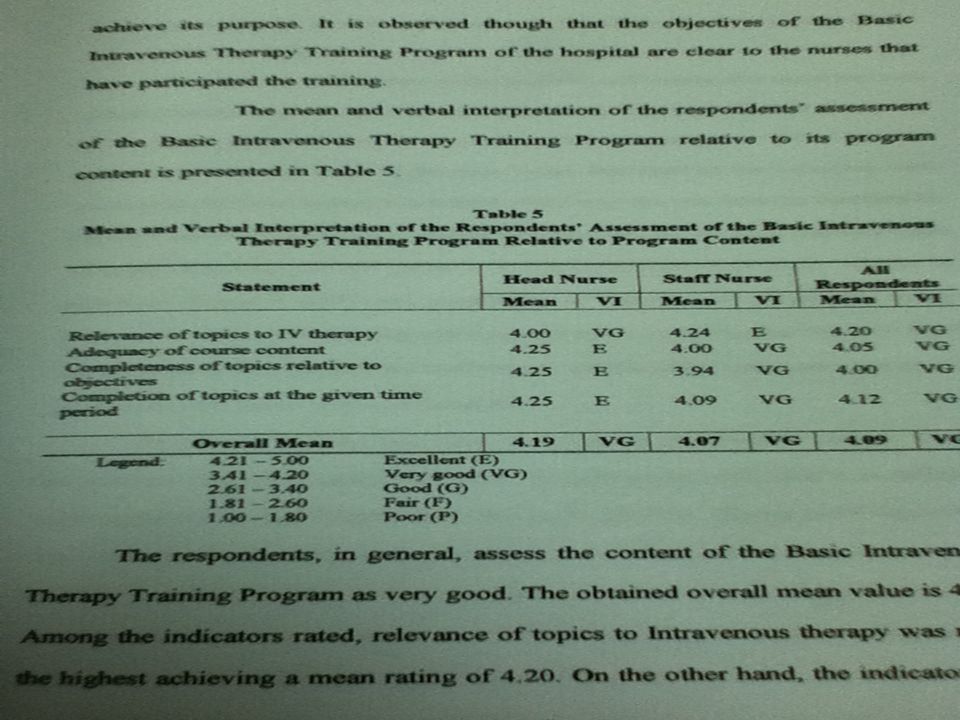
RESEARCH INSTRUMENTATION The main tool for data gathering is the questionnaire designed by the researcher. Part 1 is the respondents profile which includes the respondent’s age, length of service in the position and educational attainment. Part 2 is the assessment of the staff nurses and head nurses of the Basic Intravenous Therapy Training Program of a selected private hospital in terms of objectives, program content, methodology, and delivery of structure and evaluation. The instrument was validated in two ways: expert’s validation and pilot testing to a small group of staff nurses who are not included in this study.

7
RESEARCH DESIGN The study employed descriptive correlational research using survey questionnaire as its main instrument for data gathering. A correlational design is more appropriate for this study because it allows two variables to show if they have significant relationship.

8
STATISTICAL TREATMENT OF DATA Frequently and Percentage Distribution used to show the relationship between a part and a whole. Weighted Mean applied to determine the extent of the assessment of the training program of the two groups of respondents in terms of objectives, content methodology, delivery structure and evaluation.

9
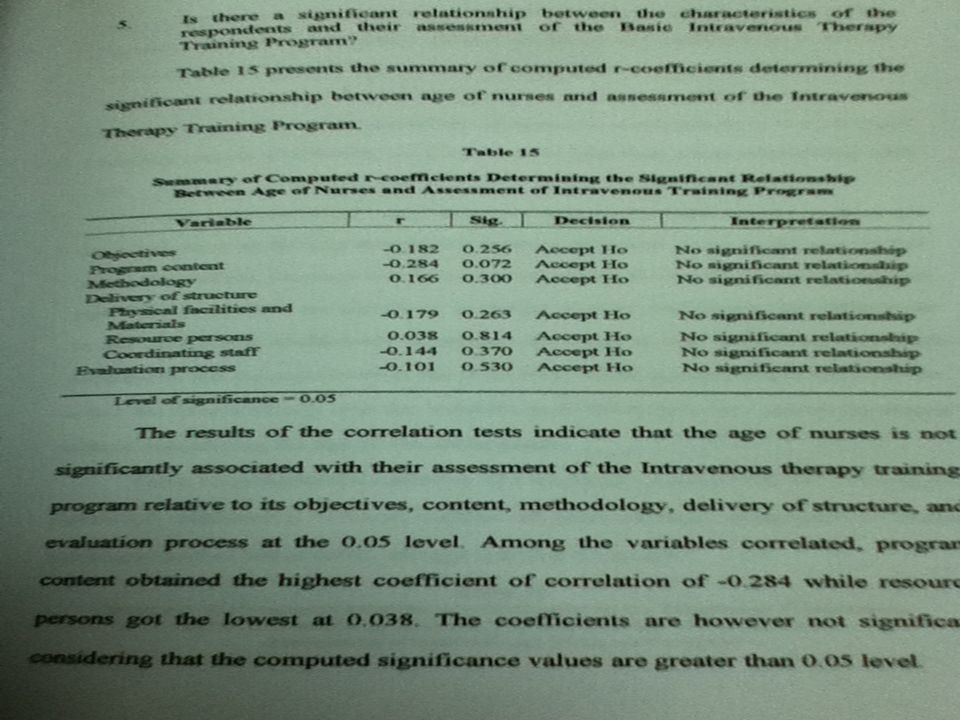
STATISTICAL TREATMENT OF DATA Analysis of Variance used to determine the significant difference in the assessment of the training program according to the category of the respondents. t-test also used to determine the significant difference in the assessment of the training program. Pearson’s Correlation Coefficient used to determine the significant relationship between the characteristics of nursing personnel and the assessment of the training program.

13
CONCLUSIONS The individual characteristics of training participants like age, work experiences, and educational qualifications when utilized as test factors do not necessarily influence how they would assess the training program they have attended. Personal characteristics like age, work experience, and educational qualifications are factors that do not significantly relate with the assessment of the training program.

14
Correlational Research The major characteristic of correlational research is seeking out associations among variables. The study should be related to requiring the identification of direction and degree of association between two sets of scores. It is carried out either to help explain important human behaviors or to predict likely outcomes.

15
Types of Design Models A.Explanatory Design Research looks for simple associations between variables and investigates the extent to which the variables are related. B. Prediction Design Research designed to identify variables that will positively predict outcomes.

16
Sampling in Correlational A minimum of 30 samples is required. Variables should not be manipulated. Independent variable in correlational research is called the “predictor variable”. Dependent variable in correlational research is called the “criterion variable”. Random and Convenience Sampling can be use in this type of research.

17
IN SELECTING INSTRUMENTS: Identify two or more characteristics which will be compared of a group, measures of variables in the research questions need to be identified. Instruments should have proven validity and reliability.

18
GATHERING PROCEDURES: Naturalistic Observation Involves observing and recording the variables of interest in the natural environment without interference or manipulation by the experimenter. The Survey Method A random sample of participants completes a survey test or questionnaire that relates to the variable of interest.

19
GATHERING PROCEDURES Archival Research Performed by analyzing studies conducted by other researchers or by looking at historical patient records.

20
Complex Correlational Techniques Pearson’s Correlation Coefficient indicates the strength of the correlation between the combination of the predictor variables and the criterion variable. Correlation Scores: below.35 = slight relationship between.40 and.60 = may have theoretical value depending on the context above.65 = reasonably accurate predictions over.85 = very strong relationship between variables

21
Complex Correlational Techniques Discriminant Function Analysis used when the criterion variable is categorical rather than quantitative. Factor Analysis technique that allows a researcher to determine whether many variables can be described by a few factors.

22
Complex Correlational Techniques Path Analysis technique used to test a theory about the likelihood of causal connections among 3 or more variables. Multiple Regression technique that enables a researcher to determine a correlation between a criterion variable and the best combination of two or more predictor variables.

23
Graphical Tools Scatter Plots plot two variables against one another to provide a visual picture of the relationship between the variables.

24
Graphical Tools Simple Graphical Regression indicates the rate of change between two variables.

25
Interpreting result in correlational research The result of the study should discuss the magnitude and direction of correlation coefficient. Regression weight of variables in a regression analysis and developing a predictive equation for use in a predictive study.

26
Criteria to evaluate Correlational Research Adequacy of sampling for hypothesis testing. Display the results in matrices and graphs. Assessment of the magnitude of the relationships based on the coefficient of determination, P values, effect size. Form of relationships and appropriate statistics.

27
Criteria to evaluate Correlational Research Identify predictor and criterion variables. Predicted the direction of relationship among variables on observed data. Statistical Procedures

28
Threats to Internal Validity Subject Characteristics individuals or groups have two or more characteristics; might be a cause of variation in the other two variables. Location location is different for different subject.

29
Threats to Internal Validity Instrumentation Instrument decay Data collector characteristics Mortality loss of subjects may make a relationship more or less likely in the remaining data.

30
Thank You By: Fay Nellyn D. Romarate, R.N.

Similar presentations


 for a given population different from.>")


