Download presentation
Presentation is loading. Please wait.

1
Commercial Real Estate Outlook IRR-Viewpoint 2010

3
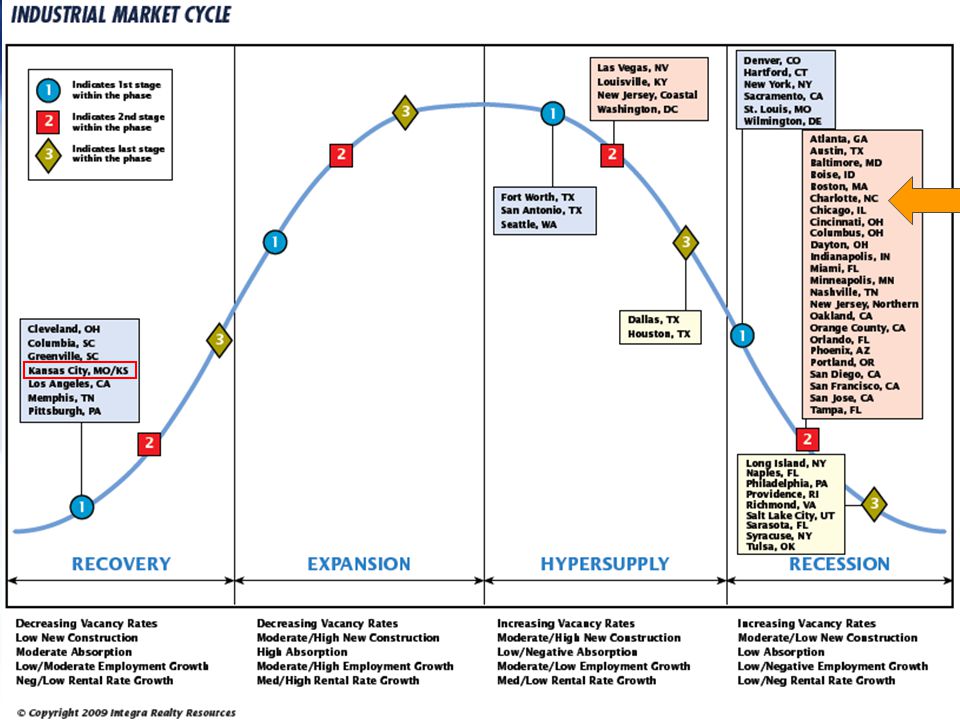
Industrial The Best, The Worst and The Local Market Top Three Markets By Vacancy… 1.Los Angeles, CA – 4.92% 2.Orange County, CA – 6.58% 3.Seattle, WA – 6.70% Local Market… 50. Charlotte, NC – 14.26% (3Q 2009);14.70% (1Q 2010-NA ) …and the Bottom Three Markets 54. Austin, TX – 18.40% 55. Boston, MA – 24.76% 56. Louisville, KY – 26.01%
;14.70% (1Q 2010-NA ) …and the Bottom Three Markets 54. Austin, TX – 18.40% 55. Boston, MA – 24.76% 56. Louisville, KY – 26.01%.")
4
Industrial Market Pricing

5
Industrial – Overall Capitalization Rates InstitutionalNoninstitutional National Flex 7.50 %-12.0% 9.38% - Average 100-400 basis points 250 or 11.88% - Average National Warehouse 7.00%-12.0% 8.60% - Average 100-300 basis points 225 or 10.85 % -Average Korpacz – Second Quarter 2010 –Investor Survey Realty Rates.com – Second Quarter 2010- Investor Survey Industrial - 9.59%

7
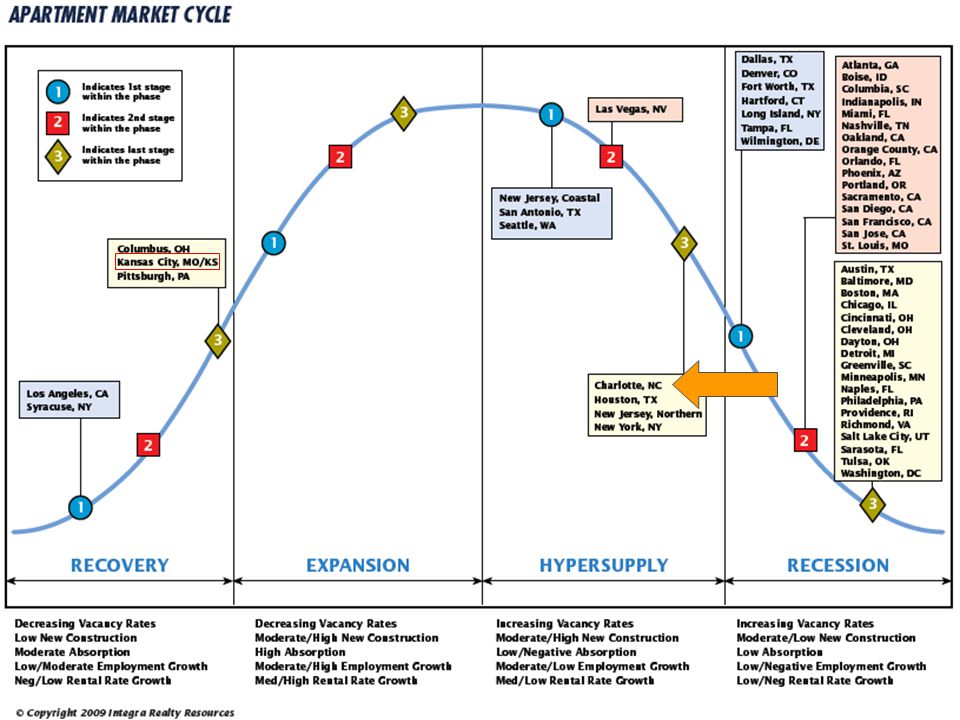
Apartment The Best, The Worst and The Local Market Top Three Markets By Vacancy… 1.San Francisco, CA – 3.59% 2.Syracuse – 3.94% 3.New York City – 4.80% Local Market… 49. Charlotte – 11.64% (3Q–2009);13.6% (1Q 2010) …and the Bottom Three Markets 54. Phoenix – 12.97% 55. Naples/Ft. Myers – 13.37% 56. Providence – 14.11%
;13.6% (1Q 2010) …and the Bottom Three Markets 54. Phoenix – 12.97% 55. Naples/Ft. Myers – 13.37% 56. Providence – 14.11%.")
8
Apartment Market Pricing

9
Apartment – Overall Capitalization Rates InstitutionalNoninstitutional National Apartment 5.00 %-11.00% 7.68% - Average 0-400 basis points 161 or 9.29% - Average Korpacz – Second Quarter 2010 –Investor Survey Realty Rates.com – Second Quarter 2010- Investor Survey Retail – 9.50% Average

10
Office Market Cycle

11
Office – CBD The Best, The Worst and The Local Market Top Three Markets By Vacancy… 1.Charlotte, NC – 6.43% 2.Boise, ID – 8.10% 3.Memphis, TN – 8.70% Local Market… 1. Charlotte, NC – 6.43% (3Q–2009); 12.0% (1Q-2010) …and the Bottom Three Markets 54. San Jose, CA – 23.90% 55. Detroit, MI – 25.00% 56. Dayton, OH – 26.00%
; 12.0% (1Q-2010) …and the Bottom Three Markets 54. San Jose, CA – 23.90% 55. Detroit, MI – 25.00% 56. Dayton, OH – 26.00%.")
12
Office – Suburban The Best, The Worst and The Local Market Top Three Markets By Vacancy… 1.Dayton, OH – 10.88% 2.Pittsburgh, PA – 11.09% 3.Los Angeles, CA – 11.30% Local Market… 41. Charlotte, NC – 19.07% (3Q–2009);19.77% (1Q–2010 ) …and the Bottom Three Markets 54. Detroit, MI – 23.89% 55. Phoenix, AZ – 27.41% 56. Hartford, CT – 29.45%
;19.77% (1Q–2010 ) …and the Bottom Three Markets 54. Detroit, MI – 23.89% 55. Phoenix, AZ – 27.41% 56. Hartford, CT – 29.45%.")
13
Office Market Pricing

14
Office – Overall Capitalization Rates InstitutionalNoninstitutional National CBD 6.00 %-10.50% 8.15% - AverageN/A Suburban 6.00%-12.00% 8.60% - Average 25-300 basis points 141 or 10.01 % -Average Korpacz – Second Quarter 2010 –Investor Survey Realty Rates.com – Second Quarter 2010- Investor Survey Office – 9.48% Average

15
Retail Market Cycle

16
Retail The Best, The Worst and The Local Market Top Three Markets By Vacancy… 1.San Francisco, CA – 3.08% 2.Los Angeles, CA – 4.87% 3.San Jose, CA – 5.03% Local Market… 12. Charlotte, NC – 6.77% (3Q–2009); 8.0% (4Q–2009) …and the Bottom Three Markets 54. Providence, RI – 17.00% 55. Dayton, OH – 17.30% 56. Detroit, MI – 17.35%
; 8.0% (4Q–2009) …and the Bottom Three Markets 54. Providence, RI – 17.00% 55. Dayton, OH – 17.30% 56. Detroit, MI – 17.35%.")
17
Retail Market Pricing

18
Retail – Overall Capitalization Rates InstitutionalNoninstitutional Regional Malls 5.00 %-10.50% 7.93% - Average 25-500 basis points 279 or 10.72% - Average Power Center 7.50%-10.00% 8.70% - AverageN/A Strip Center 7.00%-11.40% 8.38% - Average 50-1000 basis points 303 or 11.41%- Average Korpacz – Second Quarter 2010 –Investor Survey Realty Rates.com – Second Quarter 2010- Investor Survey Retail – 9.50% Average

19
Recent Development in Capitalization Rates Korpacz Survey data for investment grade property and our analysis are presented in the following table:

20
Recent Development in Capitalization Rates Korpacz Survey data for non-investment grade property and our analysis are presented in the following table:

21
Real Estate Listing Sources – For Sale & For Lease Loopnet http://www.loopnet.com/ Edis http://www.nccommerce.com/en/BusinessServices/LocateYourBusiness/BuildingsAndSites / (N.C. Department of Commerce Buildings & Sites EDIS) Mecklenburg County Real Estate Lookup http://meckcama.co.mecklenburg.nc.us/relookup/ (Market Analysis Link) National & Local Brokerage Firms –Apartment Realty Advisors http://www.arausa.com/Index.cfm http://www.arausa.com/Index.cfm –CB Richard Ellis (CBRE ) http://www.cbre.com/EN/Pages/default.aspx http://www.cbre.com/EN/Pages/default.aspx –Sperry Van Ness http://www.svn.com/ http://www.svn.com/ –Lincoln Harris CSG http://www.lincolnharris.com/Home/ http://www.lincolnharris.com/Home/ –The Stump Corporation http://www.stumpnet.com/ http://www.stumpnet.com/ –Marcus & Millichamp http://www.marcusmillichap.com/http://www.marcusmillichap.com/ –NAIGLOBAL http://www.naiglobal.com/http://www.naiglobal.com/
 Mecklenburg County Real Estate Lookup (Market Analysis Link) National & Local Brokerage Firms –Apartment Realty Advisors –CB Richard Ellis (CBRE ) –Sperry Van Ness –Lincoln Harris CSG –The Stump Corporation –Marcus & Millichamp –NAIGLOBAL")
22
National Real Estate Surveys IRR.com (Viewpoint – Real Estate Value Trends) Marcus & Millchap.com NAIGLOBAL www.pwc.com (Korpacz Real Estate Investor Survey )www.pwc.com ACLI (American Council of Life Insurers) Realty Rates.com (Developer Surveys, Financial Indicators, Market Surveys, Investor Surveys)
 Marcus & Millchap.com NAIGLOBAL (Korpacz Real Estate Investor Survey ) ACLI (American Council of Life Insurers) Realty Rates.com (Developer Surveys, Financial Indicators, Market Surveys, Investor Surveys)")
23
Vacancy and Rental Rate Surveys - SUBSCRIPTION Karnes (Office, Retail and Industrial) Real Data (Apartments) REIS
 Real Data (Apartments) REIS")
24
Real Estate Sales - SUBSCRIPTION Costar REIS Real Capital Analytics http://www.rcanalytics.com/

25
Integra Realty Resources Nation’s Largest Valuation and Counseling Firm 59 Offices in 33 states, plus DC and Mexico Over 800 Consultants & Advisors 150+ MAIs company-wide

Similar presentations


 is dedicated to moving low-wage workers into higher-paying jobs while providing employers.>")


