Download presentation
Presentation is loading. Please wait.

1
“How Do Pension Changes Affect Retirement Preparedness? The Trend to Defined Contribution Plans and the Vulnerability of the Retirement Age Population to the Stock Market Decline of 2008- 2009” Alan L. Gustman, Thomas L. Steinmeier and Nahid Tabatabai 1 Part 1 of this presentation provides background information drawn from our forthcoming book, Pensions in the Health and Retirement Study, Harvard University Press, which has benefitted from support by NIA grants IPOIAG022481, R01 AG024337, “R01 AG022956 and from the HRS. Part 2 has been supported by the Social Security Administration through MRRC under grant number UM09-09.

2
Press and Public Concerns with Adverse Effects of Stock Market Decline Special concern for those approaching retirement age – little time to adjust. Trend to DC and decline of DB plans increases vulnerability to stock market decline. Widespread discussion -- fall in stock prices will force people to delay their retirements. Some suggestion new labor market and pension policies should be aimed at older workers. 2

3
Two Parts I. Background discussion of relevant pension outcomes and trends in the Health and Retirement Study. – (drawn from our forthcoming book, Pensions in the Health and Retirement Study) 2. A paper entitled “The Retirement Age Population and the Stock Market Decline” – discusses the effects of the stock market decline on the financial assets and retirement behavior of the early boomer cohort of the HRS, in light of the trends discussed in part 1. 3
 2. A paper entitled The Retirement Age Population and the Stock Market Decline – discusses the effects of the stock market decline on the financial assets and retirement behavior of the early boomer cohort of the HRS, in light of the trends discussed in part")
4
HRS Cohorts Pension outcomes and trends based on three cohorts ages 51 to 56 in: 1992 (HRS) 1998 (War Babies) 2004 (Early Boomers) Effects of stock market decline on wealth: uses observations from Early Boomer cohort in 2006
 1998 (War Babies) 2004 (Early Boomers) Effects of stock market decline on wealth: uses observations from Early Boomer cohort in 2006")
5
Bottom Line: Effects of Stock Market Decline Overall those nearing retirement are not very vulnerable to stock market decline. – When a comprehensive measure of total wealth is used, only 13.2 percent of total assets held by Early Boomers are in stocks. – With even a 50% decline in stock prices, 6.6% average loss in wealth is not life changing. – Distributional effects are same order of magnitude. 5

6
Factors Cushioning Retirement Age Population from the Stock Market Decline Social Security accounts for over a third of total wealth. (Thanks to Kandice Kapinos and HRS for SS data.) Large growth in Social Security due to: Spouse earnings growth. Real earnings growth. Growth in cap on covered earnings during first decade of work has raised covered earnings for younger cohorts and forced saving. Early in their careers, the older HRS cohorts faced a maximum taxable earning of $4,000 or $5,000, while members of later cohorts had much higher maximums. Continued importance of DB wealth and immaturity of DC plans for retirement age population. Almost 40% of households do not own any stocks. Portfolio Diversification: Neither DC plans nor IRAs are fully invested in stocks. Growing importance of pensions and earnings of women. 6
 Large growth in Social Security due to: Spouse earnings growth. Real earnings growth. Growth in cap on covered earnings during first decade of work has raised covered earnings for younger cohorts and forced saving. Early in their careers, the older HRS cohorts faced a maximum taxable earning of $4,000 or $5,000, while members of later cohorts had much higher maximums. Continued importance of DB wealth and immaturity of DC plans for retirement age population. Almost 40% of households do not own any stocks. Portfolio Diversification: Neither DC plans nor IRAs are fully invested in stocks. Growing importance of pensions and earnings of women. 6.")
7
Table 1: Percent of Respondents Ages 51 to 56 with Any/Dormant/Live Pension from Current/Last or Previous Jobs by Cohort: Weighted 7 Pension StatusHRS 1992 War Baby 1998 Early Boomer 2004 Current job pension 43.046.246.8 Dormant pension 10.313.615.9 Pension in pay status 5.0 3.5 Live pension 52.756.956.6 Ever held a pension 62.468.768.0 Source: Gustman, Steinmeier and Tabatabai (forthcoming).
.")
8
Table 2: Percent of Households and Respondents With Any Own/Spouse/Partner Pension from Current/Last or Previous Jobs by Cohorts: Ages 51-56 in 1992, 1998, and 2004- Weighted 8 Household Members HRS War Babies Early Boomers All Respondents 78.881.280.4 All Households76.979.378.6 Source: Gustman, Steinmeier and Tabatabai (forthcoming). Respondent reported as covered if the respondent was covered in his or her own right or if respondent’s spouse is or was covered.

9
Table 3: Pension Plan Type Among Full Time Employees Ages 51 to 56 with a Pension: Weighted 9 Pension Characteristics 1992 HRS1998 Warbabies 2004 Early Boomers % with at Least One DB Plan 696151 % with at Least One DC Plan 587072 Source: Gustman, Steinmeier and Tabatabai (forthcoming).
.")
10
Table 4: Average Number of Years of Job Tenure and Pension Tenure by Plan Type and Cohort Ages 51 to 56 in 1992, 1998 and 2004: weighted 10 Cohorts DB PlansDC Plans Job Tenure Pension Tenure Job Tenure Pension Tenure HRS 17.616.415.68.1 (1540) (1197) War Babies 18.517.414.28.4 (622) (629) Early Boomers 16.816.313.89.7 (755) (990) Source: Gustman, Steinmeier and Tabatabai (forthcoming), Table 6.4.
 (1197) War Babies (622) (629) Early Boomers (755) (990) Source: Gustman, Steinmeier and Tabatabai (forthcoming), Table 6.4.")
11
Table 5: Observed Plus Imputed Pension Values From Current, Past and Previous Jobs Per Household, by Source of Pension by Plan Type, 1992, 1998, and 2004 (in 1992 Dollars)- Respondent Data: Weighted 11 Cohorts Total HH Pension Total Pension Due to DBs Total Pension Due to DCs % of Total HH Pension Due to DCs HRS: 51-56 149,753112,48037,27425% (3003) WBs: 51-56 158,432103,23055,20235% (1758) EBs: 51-56 163,642101,08262,76938% (1709) Source: Gustman, Steinmeier and Tabatabai (forthcoming), Table 9.19.
- Respondent Data: Weighted 11 Cohorts Total HH Pension Total Pension Due to DBs Total Pension Due to DCs % of Total HH Pension Due to DCs HRS: ,753112,48037,27425% (3003) WBs: ,432103,23055,20235% (1758) EBs: ,642101,08262,76938% (1709) Source: Gustman, Steinmeier and Tabatabai (forthcoming), Table 9.19.")
12
Table 6: Observed Plus Imputed Pension Values From Current, Past and Previous Jobs Per Household, by Source of Pension by Gender, 1992, 1998, and 2004 (in 1992 Dollars)- Respondent Data: Weighted 12 Cohorts Total HH Pension Wealth Total Pension Wealth Due to Men Total Pension Wealth Due to Women % of Total HH Pension Wealth Due to Women HRS: 51-56149,753112,48037,27425% (3003) WBs: 51-56158,432114,99743,43527% (1758) EBs: 51-56163,642111,23652,40632% (1709) Source: Gustman, Steinmeier and Tabatabai (forthcoming), Table 9.16.
- Respondent Data: Weighted 12 Cohorts Total HH Pension Wealth Total Pension Wealth Due to Men Total Pension Wealth Due to Women % of Total HH Pension Wealth Due to Women HRS: ,753112,48037,27425% (3003) WBs: ,432114,99743,43527% (1758) EBs: ,642111,23652,40632% (1709) Source: Gustman, Steinmeier and Tabatabai (forthcoming), Table 9.16.")
13
“The Retirement Age Population and the Stock Market Decline” Alan L. Gustman, Thomas L. Steinmeier and Nahid Tabatabai 13 We are grateful for support provided by the Social Security Administration through the Michigan Retirement Research Center under grant number UM09-09.

14
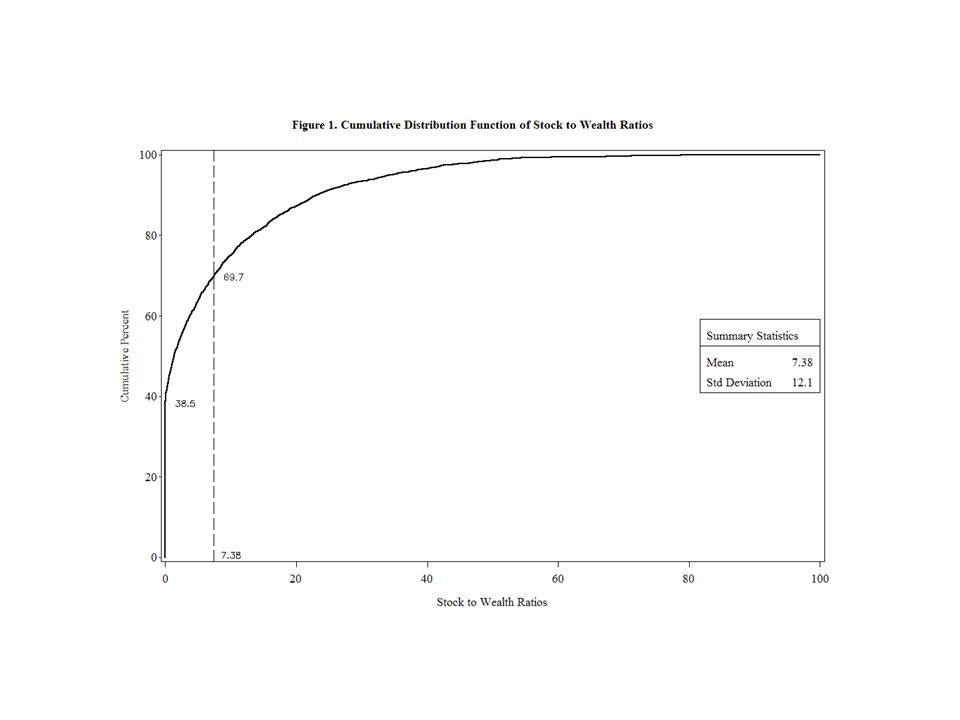
Share of Total Wealth in the Stock Market

15
Table 1: Components of Wealth in 2006 For Early Boomer Households : Current Dollars* 15 Source of Wealth MeanMean For The Median 10 Percent Of Wealth Holding Households Value ($) Percent of Total (%) Value ($) Percent of Total (%) Total 870,991100659,516100 Social Security Plus Pensions 482,25755.4439,73866.7 Social Security 304,80235.0328,30149.8 Pension Value 177,45620.4110,01216.7 DB Value 115,63813.379,86512.1 DC Value 61,8187.130,1474.6 Current DC Balances 44,4715.122,8713.5 Current DC in Stocks 27,4493.213,1542.0 House Value 168,79819.4118,85618.0 IRA Plus Direct Stock Holdings Plus DC in Stocks 115,38213.251,7807.9 Observations 2,492 * Households with the top and bottom 1% of total wealth excluded. Missing asset values imputed. Obs. are weighted. Social Security wealth from Kapinos et al.

16
Table 3: Distribution of Assets by Wealth Decile in 2006 For Households with at Least One Member Born from 1948 to 1953 16 Sources of Wealth Average Asset Value for Respondents in Indicated Total Wealth Deciles Total 1- 10 11- 20 21- 30 31- 40 41- 50 51- 60 61- 70 71- 80 81- 90 91- 100 Total Wealth ($000)70.41873124425837419181,1661,5662,714871.0 Total Wealth in Stocks/Total Wealth (%) 1.12.53.54.96.98.59.910.415.120.713.2 1. Households with top and bottom 1% of total wealth are excluded. 2. Values as of 2006 are reported in thousands of dollars.

18
Effect of Stock Market Decline on Retirement Goal: Isolate effect of stock market decline from other factors affecting retirement. Strategy, simulate effect of dot com decline, only slightly smaller than current decline. From peak in August 2000 to end of Sept. 2002, cumulative decline of 34 percent. Recession of 2008-2009. Dow peaked at 14,164 in October, 2007. Decline to date roughly similar.

19
19 3

20
Retirement Changes Are Likely to be Small. Retirement reductions due to stock market wealth losses alone are likely to be small. Layoffs will increase retirements. 20

21
Housing Wealth

23
Policy Issues Labor market policies will be very difficult to target efficiently. Difficult to distinguish market failure from voluntary retirements. Retirement age workers look like troubled workers. Many are jobless Exhibit earnings declines Transitions from full time to part time work Same characteristics usually used to distinguish those eligible for unemployment insurance, job training and transfers. Result: high probability of free riders. 23

24
Policy Issues Investments in older workers will often have lower returns. Remaining work life of older persons is relatively short. Attempts to encourage greater part time work by relaxing minimum hours constraints and pension rules will reduce work by those who otherwise would continue to work full time. Result is a wash. (Gustman and Steinmeier, 2008) 24
 24.")
25
Summary – The Good News Despite wide pension coverage and trend to DC plans, those on the verge of retirement not very vulnerable to stock market decline. – DC plans still immature. – DB plans remain dominant. – Heavy dependence on Social Security. – Many have no stock exposure at all. – As a result, o nly 13% of assets in stocks. Few will delay retiring due to fall in stocks. Nor will fall in house prices have immediate effect. 25

26
Caveats: Remaining Concerns Best Answered with Data From 2010 HRS Ultimate effects of layoffs – Potentially severe consequences for older job losers – Job loss may increase, not decrease retirements. Difficult for some to locate another job. Retire rather than accept a lower wage. Ultimate decline in DB values – limited by PBGC insurance and proximity to retirement. Who are the largest losers? – Incidence and effects of multiple adverse events. (Rohwedder, internet data)
.")
Similar presentations

>")
 Participant Behavior in a Volatile Economy Prepared for the 14 th Annual RRC Conference, August 2, 2012 by Barbara Butrica and Karen Smith 1.>")


 contribute a limited yearly.>")


