Download presentation
Presentation is loading. Please wait.

1
Restoring Harlem River’s water quality to swimmable and fishable
Gemma (Jingyu Wang), Ph.D. City University of New York (CUNY) BCEQ Annual Water Conference Manhattan College, 3/18/2015
, Ph.D. City University of New York (CUNY) BCEQ Annual Water Conference. Manhattan College, 3/18/2015.")
2
Waterfront accessibility
Harlem River has limited waterfront accessibility: railway-Metro-North; Industrial infrastructure Has been experienced decades of industrial abuse and remains gritty and industrial The Harlem River has always a major resource for water recreation throughout its history. Water quality concerns

3
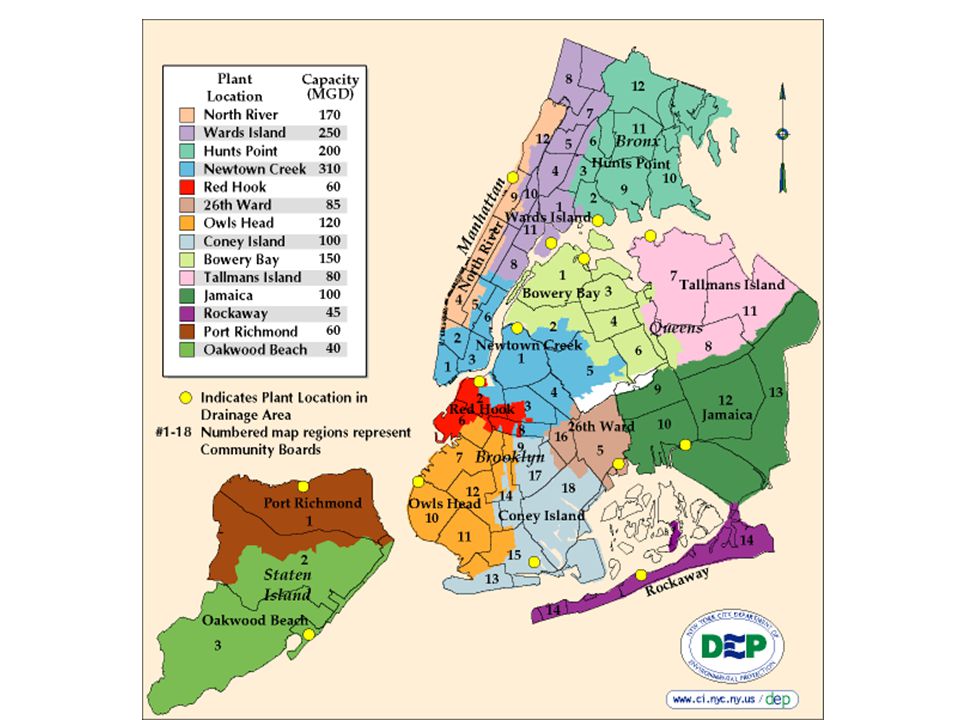
Zoom in Harlem River The Harlem River is located on the western boarder of the Bronx, separating it from Manhattan 9.3 miles, a natural straight The Harlem is connected to the Hudson and the East River Historically used for swimming and fishing

4
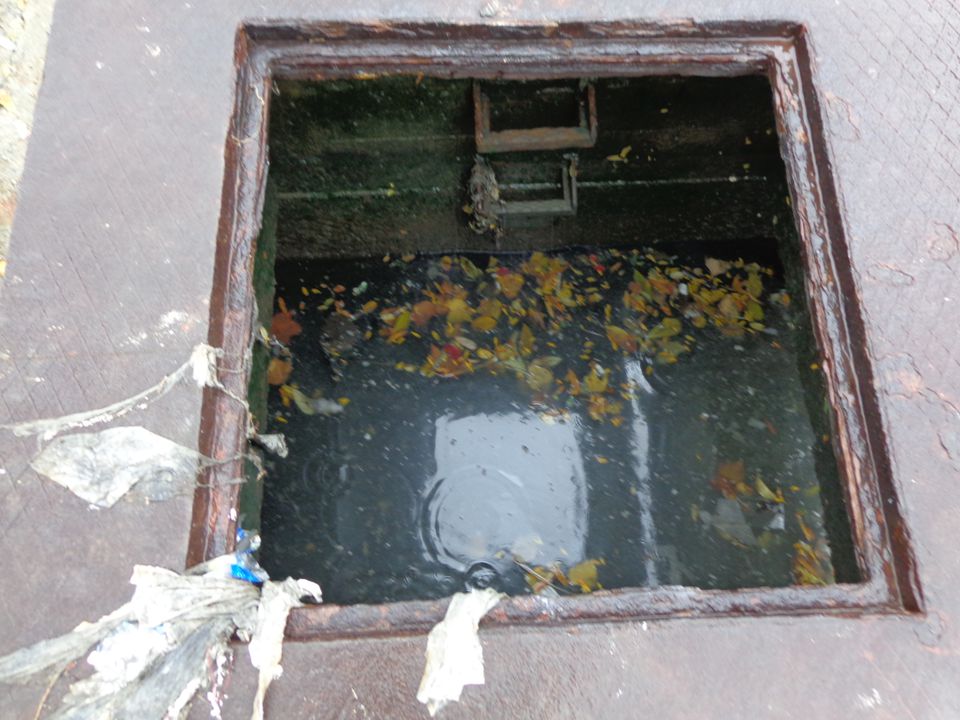
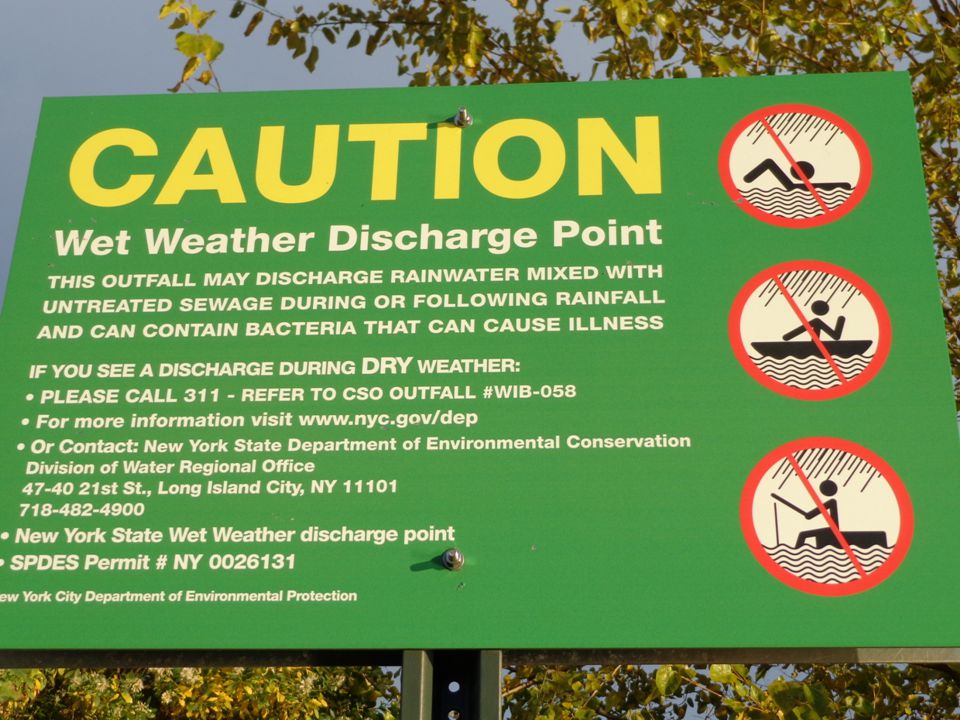
Discharge sewage into the river
Stormwater and sewage share the same pipe: combined sewer, when it rains, it overflow. CSOs discharge untreated sewage into the river, during rainstorms. There are more CSO’s in the Harlem River (>50) than any other water source in NYC Point pollution: CSOs Nonpoint pollution: stormwater runoff, adjacent waterway activities Increased nutrient and pathogen (bacteria) levels during storm. PCBs11 (Polychlorinated biphenyls): indicator of raw sewer, stormwater runoff and wastewater effluents
 than any other water source in NYC. Point pollution: CSOs. Nonpoint pollution: stormwater runoff, adjacent waterway activities. Increased nutrient and pathogen (bacteria) levels during storm. PCBs11 (Polychlorinated biphenyls): indicator of raw sewer, stormwater runoff and wastewater effluents.")
6
Restoring ecosystem Improve water quality
Connect community with their natural resource Reconnecting the waterfront with the people Reinvigorating in-the-water recreational and commercial activities Restore the river’s water quality to become swimmable/fishable Monitor and publicize water quality data

7
4/30/14 CSOs

8
7/2/14 DO: 4mg/L, 49%

9
7/2/14 CSO: 2.9mg/L, 35%

10
7/2/14 CSO

11
6/5/14 CSO

12
10/7/2013 CSO

15
Fish consumption safety
Men over 15 and women over 50 Women under 50 & children under 15 Chemicals of concern Blue crab meat Up to 4 meals/month (6 crabs per meal) Don’t eat PCBs, Cadmium Crab or lobster tomalley (hepatopancreas, mustard) and cooking liquid PCBs, Cadmium, Dioxin Channel catfish, Gizzard shad, White catfish PCBs Atlantic needlefish, Bluefish, Carp, Goldfish, Rainbow smelt, Striped bass, White perch Up to 1 meal/month All other fish Up to 4 meals/month
 Don’t eat. PCBs, Cadmium. Crab or lobster tomalley (hepatopancreas, mustard) and cooking liquid. PCBs, Cadmium, Dioxin. Channel catfish, Gizzard shad, White catfish. PCBs. Atlantic needlefish, Bluefish, Carp, Goldfish, Rainbow smelt, Striped bass, White perch. Up to 1 meal/month. All other fish. Up to 4 meals/month.")
16
Methodology Water sampling: CSO discharge sites
Ammonia: Nessler reagent method for ammonia (NH3-N) Phosphate: automated ascorbic acid method Turbidity: HACH 4000 spectrophotometer Fecal coliform, E.Coli., enterococcus: selective agar plates, 37°C/24h incubation, MPN/100ml PCBs: EPA 8082A, GC/MS
 Phosphate: automated ascorbic acid method. Turbidity: HACH 4000 spectrophotometer. Fecal coliform, E.Coli., enterococcus: selective agar plates, 37°C/24h incubation, MPN/100ml. PCBs: EPA 8082A, GC/MS.")
17
November 17, 2014 raining MPN/100ml
Fecal coliform: 800*2=1,600 Enterococcus: 600*2=1,200 Enterococcus: 150*2=300 July 29, 2014 Sunny (dry day) Fecal coliform: E.Coli.: 44 Enterococcus: 160
 Fecal coliform: E.Coli.: 44. Enterococcus: 160.")
18
July 2, 2014 bacteria April 30, 2014 bacteria
Fecal coliform: 1 million*5=5 million MPN/100ml E.Coli.: 1,000*5=5,000 Enterococcus: 2,000*5=10,000 April 30, 2014 bacteria Enterococcus: 2000*5=10,000 Fecal coliform: 1million*5=5 million E.Coli.: 100*5=500

19
Bacteria levels increased dramatically during heavy rainstorm
March 11, 2011 sunny (all units: MPN/100ml) Fecal coliform: >1,000 E.Coli.: >100 Enterococcus >2 May 8, 2013 heavy rainstorm Fecal coliform: >millions E.Coli.: >5,000 Enterococcus >500 EPA STANDARD: fecal coliform <200 E.Coli. <126 enterococcus <104 USGS fecal coliform surface in 5-year increments: >10,000, <200 average data from >2,500, 2009 <200 UNDERESTIMATION?
 Fecal coliform: >1,000. E.Coli.: >100. Enterococcus >2. May 8, 2013 heavy rainstorm. Fecal coliform: >millions. E.Coli.: >5,000. Enterococcus >500. EPA STANDARD: fecal coliform <200 E.Coli. <126 enterococcus <104. USGS fecal coliform surface in 5-year increments: >10,000, <200. average data from >2,500, 2009 <200 UNDERESTIMATION")
20
November 1, 2013 rainstorm (units: MPN/100ml)
Enterococcus > 1,000*5=5,000 Fecal coliform: millions E.Coli.: 100*5=500 Enterococcus: an indicator of raw sewer in a higher level than most of Riverkeeper’s data, and the maximum was similar October 7, 2013 heavy rains E.Coli.: 44*5=220 Fecal coliform: 1,500*5=7,500 Enterococcus: 120*5=600 Compared to Riverkeeper’s data (maximum) Willis Ave. Bridge-Harlem River: 5,635 North River Waste Water Treatment Plant: 2987; Superfund toxic sites: Gowanus Canal: >24,196; Newtown Creek-Metropolitan Ave. Bridge>24,196
 Willis Ave. Bridge-Harlem River: 5,635. North River Waste Water Treatment Plant: 2987; Superfund toxic sites: Gowanus Canal: >24,196; Newtown Creek-Metropolitan Ave. Bridge>24,196.")
21
2014 ammonia 4/22: afternoon shower
4/30 CSO: heavy afternoon rainstorm 6/5 CSO: morning rain 6/19/14: light morning rain 7/3/14 CSO: tropical storm Arthur 2014 ammonia 0.23 4/22 4/30 6/5 6/19 7/2

22
Ammonia level in 2013 3/30 5/9 7/8* 7/12 10/4 10/7 0.23
2013 weather condition 3/30/13: cloudy, storm 5/1/13: sunny 5/8-9/13: Rain storm 5/23/13: thunderstorm 7/8: sunny 7/12: shower 10/4: drizzle 10/7: heavy rains 11/1: rain Randall’s Island

23
Ammonia level in 2012: Superstorm Sandy
7/18 9/18 10/24 11/1 11/8 0.23 after Sandy Before Sandy after Nor’easter

24
Ammonia level in 2011 2011 weather condition: 3/10: rainy windy
3/17: sunny 3/24: The day after rain and snow, high tide, sunny, 38⁰F 4/7: raining in the morning, cloudy and sunny in late afternoon, 50⁰F, the day after raining on Wed 4/28: heavy thunderstorms, high 72⁰F 5/5: sun, mixing with clouds, windy, high 64⁰F 7/25: drizzle Ammonia level in 2011 3/10 3/24 4/7 4/28 5/5 7/13 9/28 site1 site2 site3b site3a site4 site3c 0.23

25
Phosphate concentration in 2013
2013 weather condition 3/30/13: cloudy, storm 5/1/13: sunny 5/8-9/13: Rain storm 5/23/13: thunderstorm 7/8: sunny 7/12: shower 10/4: drizzle 10/7: heavy rains 11/1: rain 5/1 5/8 5/9 5/23 7/8* 7/12 10/4 10/7 11/1 0.033 Radall’s Island

26
Phosphate concentration in 2011
3/10 3/17 3/24 4/7 4/28 5/5 5/12 site1 site2 site3a site3 site3b site4 0.033 2011 weather condition: 3/10: rainy windy 3/17: sunny 3/24: The day after rain and snow, high tide, sunny, 38⁰F 4/7: raining in the morning, cloudy and sunny in late afternoon, 50⁰F, the day after raining on Wed 4/28: heavy thunderstorms, high 72⁰F 5/5: sun, mixing with clouds, windy, high 64⁰F 7/25: drizzle

27
5.25 4/22 4/30 6/5 6/19 7/2

28
Turbidity in 2013 2013 weather condition 3/30/13: cloudy, storm
5/1/13: sunny 5/8-9/13: Rain storm 5/23/13: thunderstorm 7/8: sunny 7/12: shower 10/4: drizzle 10/7: heavy rains 11/1: rain 3/30 5/1 5/9 5/23 7/8* 7/12 10/4 10/7 11/1 Randall’s Island 5.25

29
Turbidity in 2012: Hurricane Sandy
7/18 9/18 10/24 11/1 11/8 5.25 after Sandy Before Sandy after Nor’easter

30
Turbidity in 2011 2011 weather condition: 3/10: rainy windy
3/17: sunny 3/24: The day after rain and snow, high tide, sunny, 38⁰F 4/7: raining in the morning, cloudy and sunny in late afternoon, 50⁰F, the day after raining on Wed 4/28: heavy thunderstorms, high 72⁰F 5/5: sun, mixing with clouds, windy, high 64⁰F 7/25: drizzle Turbidity in 2011 site1 site3a site2 5.25 3/24 4/7

31
Future perspective Continuous water quality monitoring along the river and share data to the community More sampling sites along the river, for a spatial variation analysis Wetland, green roof/wall build along the river to capture stormwater and reduce CSOs vimeo.com

32
Conclusion Nutrients, pathogens and turbidity increased dramatically during rainstorms, including Hurricane Sandy Not in accordance EPA regulated level and higher than USGS and Riverkeeper’s published data It’s not safe for swimming/fishing Waterfront access is limited Capture stormwater and reduce CSOs is the goal, make the river swimmable/fishable in near future

Similar presentations

 brings nitrogen.>")


 Permit.>")

