Download presentation
Presentation is loading. Please wait.

1
Looking at Processes Process Mapping Prepared by: Bernie McCulloch

2
Session Objectives To understand how mapping processes can help identify improvement opportunities To learn how process mapping can be used by anyone on processes small & large To identify and prioritise processes within your department where greater scrutiny is required Hands on process mapping

3
What is process mapping

5
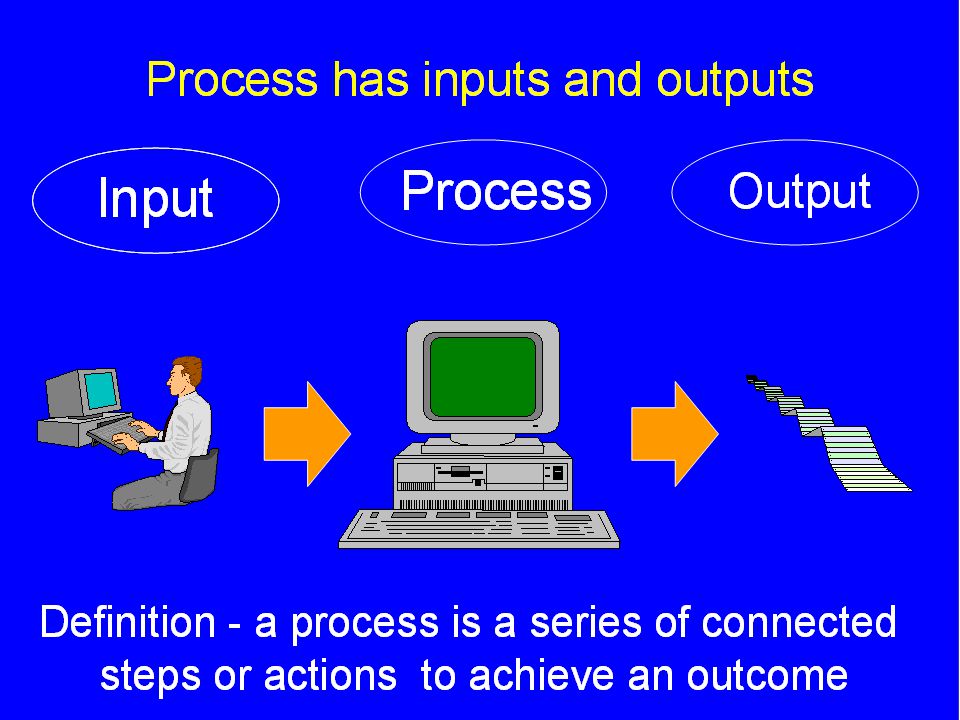
Every system is perfectly designed to achieve the results it gets

6
We design in the system capability “80% of the problem is in the system not the people” William Edward Deming

8
There are different ways of looking at the same thing

9
Process mapping…. Views the system from the patient perspective following their journey across organisational boundaries Helps staff understand how complex and confusing processes appear to the patient Organisation / service specific Diagnostic and used as a basis for redesign, actively involving frontline staff in the process. (Shows how things actually are)
.")
10
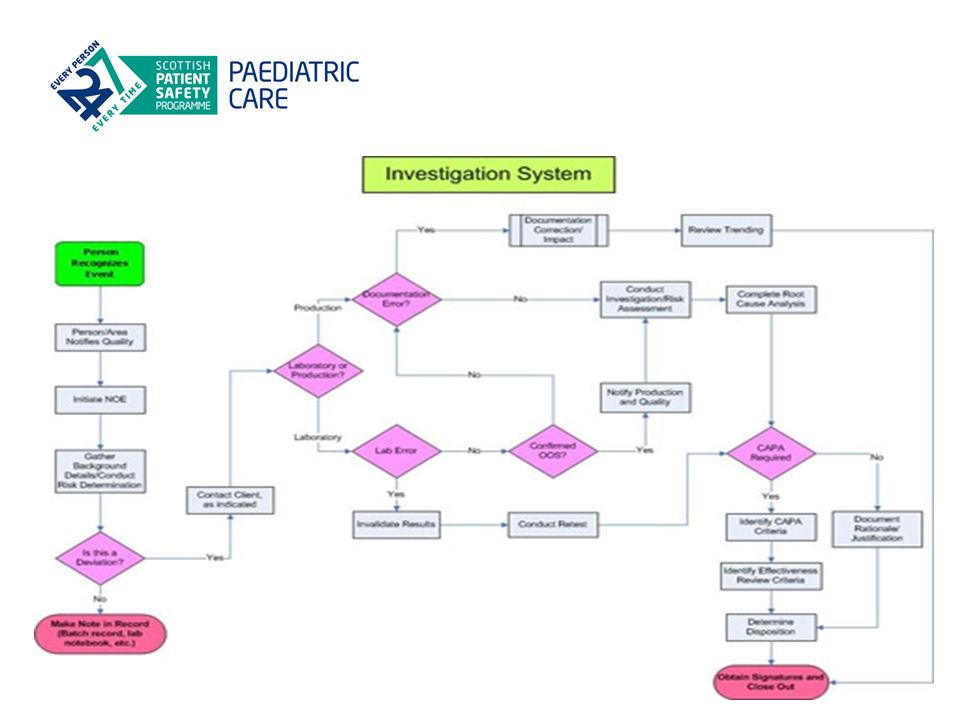
What is process mapping One page picture of all steps Create ‘end to end’ review that depicts the flow (information - reports/ test results) that drives activity Identifies the ‘current state’ Doing a process map builds consensus – helps share a vision of where we want to be Once current state understood, its a roadmap for the FUTURE or IDEAL state Helps team understand the reality of what's happening Identify ways to improve it (thereby add value) See the wastes in the system Can see flow of customer value
 that drives activity Identifies the ‘current state’ Doing a process map builds consensus – helps share a vision of where we want to be Once current state understood, its a roadmap for the FUTURE or IDEAL state Helps team understand the reality of what s happening Identify ways to improve it (thereby add value) See the wastes in the system Can see flow of customer value")
11
Why Process Map?

12
Why process map Enables standardisation Improves efficiency & effectiveness – Redesign process It captures Best Practice Stops reliance on one member of staff Acts as good working practices for new staff and aids their training Visual Management – Makes it easier to understand the process Aids Continuous Improvement, e.g. helps you see the source of waste Ensures that process has been thought through Provides a common language and reduces variation Clarity around roles and responsibilities

13
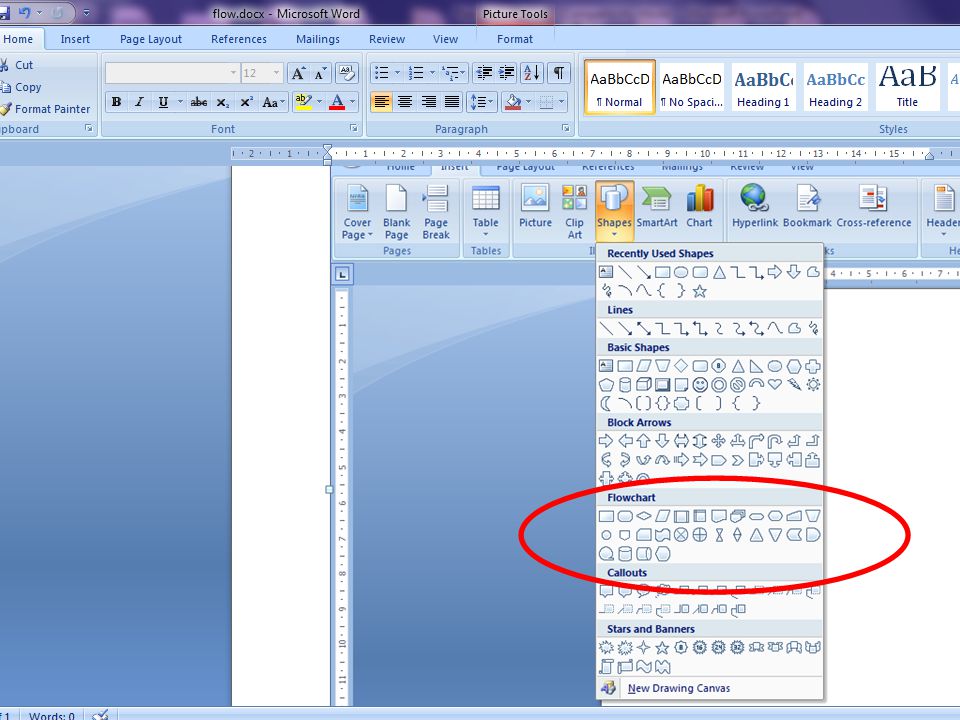
Process Flow Decision Point Document / Report Multiple documents / Reports Resource Tracker 04/05/201506/05/2015 05/05/2015 Process Mapping Key

16
Waste Is a Sensitive Issue Its critical to eliminate “waste” Its also critical to recognise that the non value adding activities may have been a core part of someone job for many years It’s the activities that are non value adding not the person

17
Waste Walking – Hints & Tips Approach to follow: Watch the process (think about waste type) Map the process Identify and tag the waste activities in the process What does the waste equate to (time and resource) Prioritise which waste to eliminate first
 Map the process Identify and tag the waste activities in the process What does the waste equate to (time and resource) Prioritise which waste to eliminate first")
18
Categories of Waste TransportMoving “stuff” InjuriesDamage to people MotionUnnecessary human movement Inventory“Stuff” waiting to be done WaitingPeople waiting for “stuff” to arrive Over processing“Stuff” we have to do but doesn’t add value Over productionProducing too much “stuff” Defects“Stuff” that’s not right and needs fixing StaffUntapped potential

19
High level process map 6 – 12 steps Generate in set time e.g. 20 minutes Use to identify scope and identify problem No rework loops and minimum complexity

20
Jim goes to see the GP Secretary posts letter & referral form Margaret reads through the referrals Places referral letter into appropriate box Jim receives new appointment Jim attends appointment Community Physiotherapy Scenario High level process map _________________________ 12 weeks___________________________ High Level Map

21
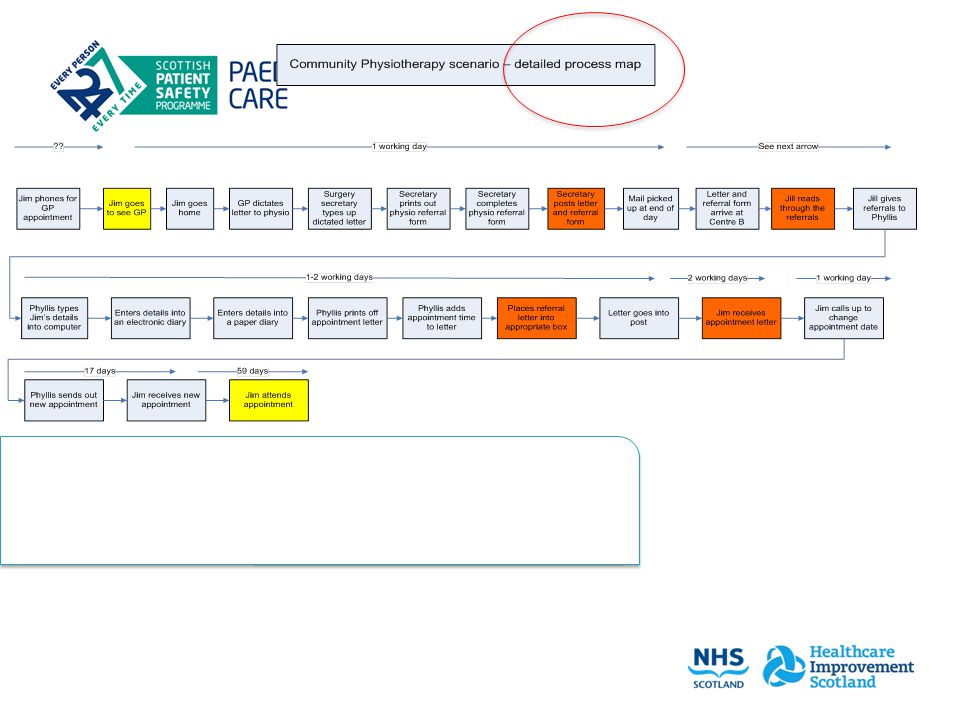
Low Level or Detailed process map –Dozens of steps –To establish loops and complexity –Good to establish roles and relationships within process –Use again in later phase to show effect of redesign

23
When undertaking a process map activity SCOPE – where does the process start and end? What demand is placed on it Who should be involved in the mapping process? Decide the level of detail Map what actually happens

24
Step 1 Step 2 Step 3 Step 4 Define what process is to be mapped, be clear on this and mindful of any interdependencies Create a Current state process map using “Post It’s” Review process map and identify waste and opportunities so you can create an Ideal State and Future State Create an Action Plan to achieve ideal and Future State Process Mapping – 4 key steps

25
Key elements to Process mapping Map what actually happens – most of time Time Lines Identify the types of waste? What value/waste is in the process? Include parallel processes Display the maps so all can see –Allow comments Don’t redesign for redesign sake

26
Practice with activities ! Don't worry

27
Lets have a go.....

28
‘Ground rules’ for the process Mapping Activity Everything is confidential Everyone has a valuable contribution to make Value the diversity of the group ‘Park’ issues Keep to time

29
Compiling a Process Map Name of the person completing task + verb Who does what and when?

30
Remember the following... Define where the process starts and ends Consider who you would involve in the mapping exercise? Use post-its to record the activities including time Assemble the post-its to create the journey (remembering that some activities happen in parallel) Keep a note of issues and opportunities
 Keep a note of issues and opportunities.")
31
On your table – Flip chart sheets Post it Notes

32
Activity 1 Define what process is to be mapped In groups try some process mapping… -Take 20 minutes to map the process for Medicine Reconciliation

33
Medicine Reconciliation Process - Get the notes (if yes) if no ? - Pt demographics documented - Allergy status documented - 2 or more sources to confirm meds -Parents -Notes, electronic system - Complete kardex

34
Stage 2: Analysis

35
Understanding the Patient Journey Process Mapping and Flow Analysis

36
Analysing the process map How many steps in your process? How many duplications? How many hand-offs? What is the approximate time of or between each step? Where are possible delays? Where are major bottlenecks? How many steps do not add value for patients? Where are the problems for patients and staff?

37
▲ The process STOPS ▲ Inhibits FLOW ▲ Does not add value for the PATIENT ▲ As a Clinician do you see the wait? Waiting

38
Referrals are posted on to the centre No cover while Phyllis on AL May 1st-May 4 th - 3 days to process referral. 1 st appt received on May 6 th – new appt sent out May 23 rd. Duplication Electronic and paper systems Rebooking of patient appointment. Examples

39
Bottlenecks All forms are returned to nearest centre Every patient appt is 30 mins 1 physio to triage referrals Phyllis multi-tasking / no cover for AL. EXAMPLES

40
BATCHING GP dictating at end of day Mail picked up daily Phyllis had 10 appts to make Physio reading all referral letters at once EXAMPLES

41
Value adding The activity transforms the patient and moves them towards the next defined outcome The activity is something that the patient cares about Non-value adding Do not serve any purpose (aim to remove these) Necessary non-value adding Do not directly benefit patient but are necessary e.g. completion of forms, logging patient details onto systems, numerous checks of details Value / non-value adding steps

42
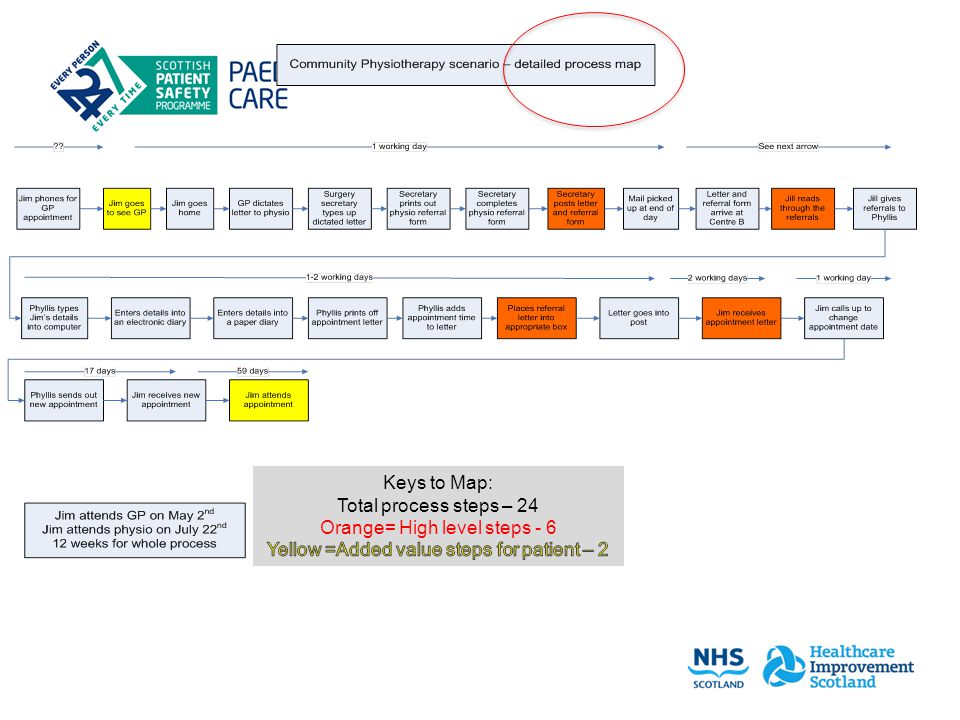
Jim goes to see the GP Secretary posts letter & referral form Margaret reads through the referrals Places referral letter into appropriate box Jim receives new appointment Jim attends appointment Community Physiotherapy Scenario High level process map Jim attends GP on May 2nd Jim attends physio on July 22 12 weeks for the whole process Total process time: 83 days, 119520 mins Value added time for patient= 40 mins Appt time with GP & Physio _________________________ 12 weeks___________________________

44
...............occurs when a step is the limiting rate of the process The step takes a significant time, and slows the whole process down. e.g. accuracy of information given (5mls calpol) Process Bottlenecks.....
 Process Bottlenecks")
45
Functional Bottlenecks occur when a resource is used by more than one process Junior Drs

46
Look for Batching Dr sees patients individually Requests sent in batches Results return in batches Does this apply to Med management (Discharge prescriptions)
")
47
Identify examples of: 1- batching 2- bottlenecks 3- waiting 4- duplication Activity 2: How much time 10 mins?

48
Walk the Patient Journey for yourself

49
Jim goes to see the GP Secretary posts letter & referral form Margaret reads through the referrals Places referral letter into appropriate box Jim receives new appointment Jim attends appointment Community Physiotherapy Scenario High level process map Jim attends GP on May 2nd Jim attends physio on July 22 12 weeks for the whole process Total process time: 83 days, 119520 mins Value added time for patient= 40 mins Appt time with GP & Physio _________________________ 12 weeks___________________________ Physio self referral

50
Analysis Summary Steps Total number of steps Number of value steps Value steps as % of total steps e.g. 2/24 = 8% Time Total time Hrs:Mins Time of value steps Value Time as % of total time e.g. 40/119520=0.03% Waste Transport Injuries Motion Inventory Waiting Over processing Over production Defects Staff

51
Stage 3: Redesigning Processes

52
Focus on the future process Think creatively/generate ideas Focus on ideas and opportunities Are the right people involved? – whole system approach where needed

53
Defining patient groups Runners Specials Strangers Group of patients No. in each category within the group

54
RunnersSpecials Share common characteristics Customised High volumeLower volume Fast throughputPredictable Highly predictableShare some steps but require Standard –patient routesextra steps Up to 90% pre-scheduledCan be pre-scheduled Strangers Low volume, unique requirements Unpredictable demand pattern Route unpredictable and complex Throughput time tends to be longer Tools for defining patient groups

55
Opportunities for Redesign

56
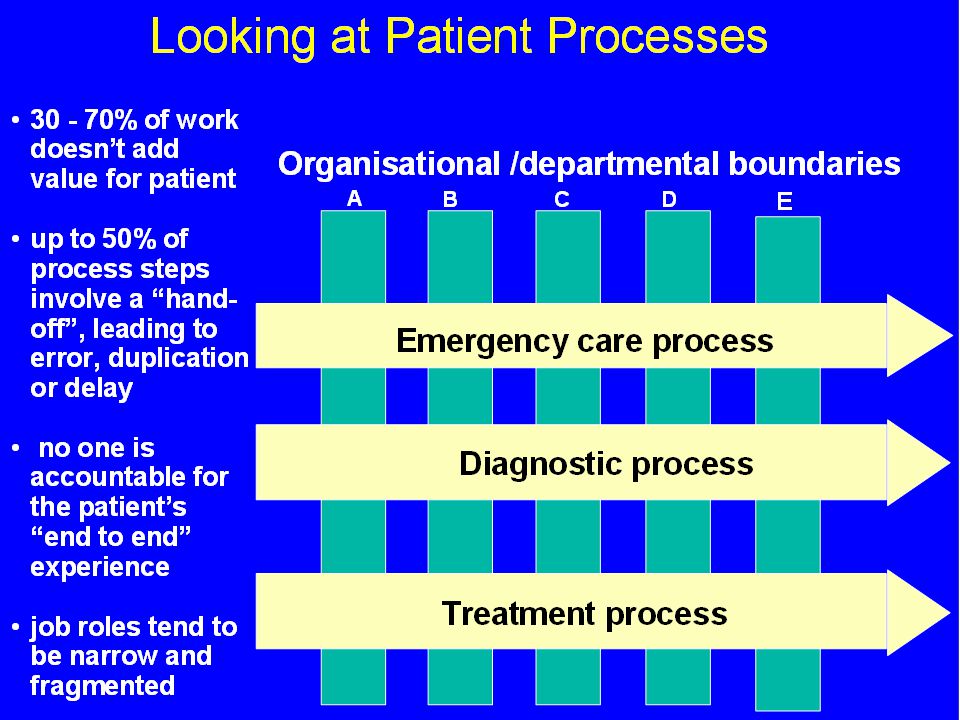
Current processes often operate in isolation from each other, particularly departments and directorates Each area needs to be linked to the one before, to ensure that they always have capacity to deal with what they are receiving Linked processes

57
Add value Remove waste Remember always aim to

58
How you will go about doing this? Who will you ask to attend? When will you hold it? Where will you hold it? What obstacles might you face? How will you address them? What will your role be during the session? What will the outcome of the session be if it is successful?

59
Questions?

60
Process mapping is a method of creating a “one page picture” of all the process steps that occur The goal in completing an effective process map is to create an “end to end” review of the process that depicts the “flow” of materials and information (reports, invoices etc) that drive the activity By completing this we can identify the flow of the customer value adding activity, see wastes in the process and identify opportunities to improve it A good process map helps the team understand the reality of what is happening In the process by using a “go see approach” builds consensus on the current state. They can also help to share a vision of where we want to get to Once a Current State process map has been developed, a Future State can be created as an implementation roadmap towards achieving excellence Introduction to Process Mapping

61
A handoff occurs in a process when responsibility for the next activity passes from one person to another.

62
Key elements to Process mapping Map what actually happens – most of time Time Lines Identify the types of waste? What value/waste is in the process? Include parallel processes Display the maps so all can see –Allow comments Don’t redesign for redesign sake

Similar presentations


 Robert Martin, PsyD Performance Excellence UCLA.>")


