Download presentation
Presentation is loading. Please wait.

1
Should the Rich Pay for Fiscal Adjustment? Income and Capital Tax Options Thomas Piketty Paris School of Economics Brussels, ECFIN Workshop, October 18 2012

2
This talk: two points 1. The rise of European wealth-income ratios - Top income shares ↑ much more in US than in Europe - But wealth-income ratios ↑ much more in Europe (EU GDP: 12tr €; net private wealth: 60tr € = 500% GDP) (memo: China’s reserves < 3tr €: 20 times smaller) → In Europe, main fiscal reserve = wealth taxation (while in US, main reserve = top income taxation) 2. A proposal for a European wealth tax - A comprehensive wealth tax with rate 1% above 1m€ and 2% above 5m€ would raise ≈ 2% of EU GDP - Other options (top income tax, corporate tax, FTT) are also useful, but raise less revenue
 (memo: China’s reserves < 3tr €: 20 times smaller) → In Europe, main fiscal reserve = wealth taxation (while in US, main reserve = top income taxation) 2. A proposal for a European wealth tax - A comprehensive wealth tax with rate 1% above 1m€ and 2% above 5m€ would raise ≈ 2% of EU GDP - Other options (top income tax, corporate tax, FTT) are also useful, but raise less revenue.")
3
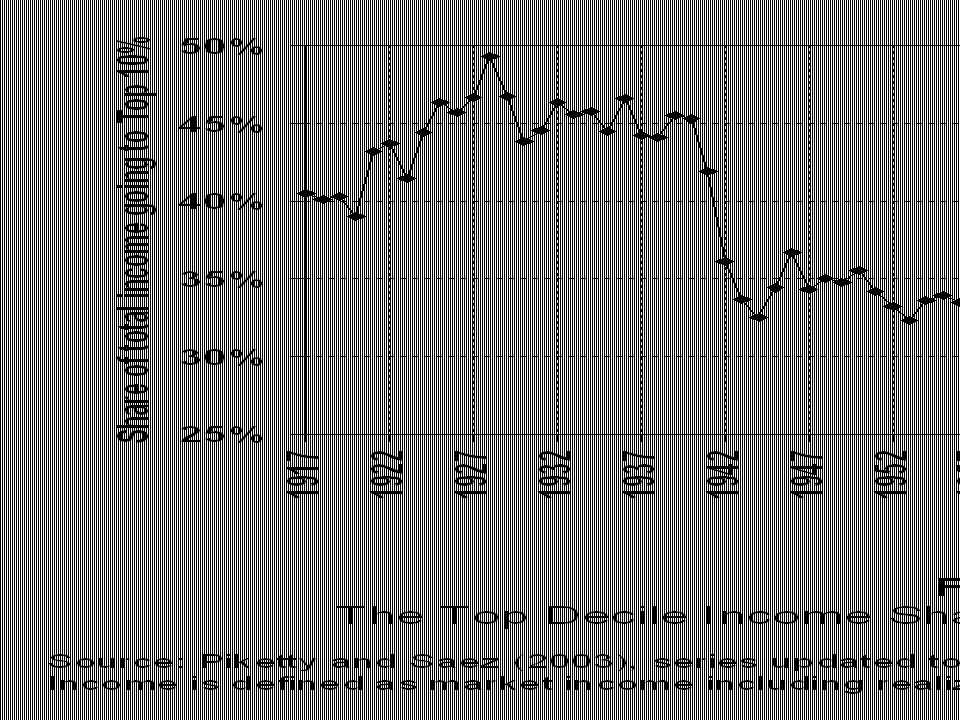
1. The Rise of European wealth-income ratios Top income shares ↑ much more in US than in Europe World Top Incomes Database: 25 countries, annual series over most of 20 C, largest existing historical data set on income inequality In US, top 10% income share rose from 35% to 50% of national income (top 1% share rose from 20%) and absorbed 70% of macro growth over 1980-2010 In Continental Europe, there was also a rise in top income shares, but it started later (mid 1990s rather than early 1980s) and was quantitatively much smaller F Hollande’s 75% top rate above 1m€ would be much more useful in US than in France
 and absorbed 70% of macro growth over In Continental Europe, there was also a rise in top income shares, but it started later (mid 1990s rather than early 1980s) and was quantitatively much smaller F Hollande’s 75% top rate above 1m€ would be much more useful in US than in France.")
11
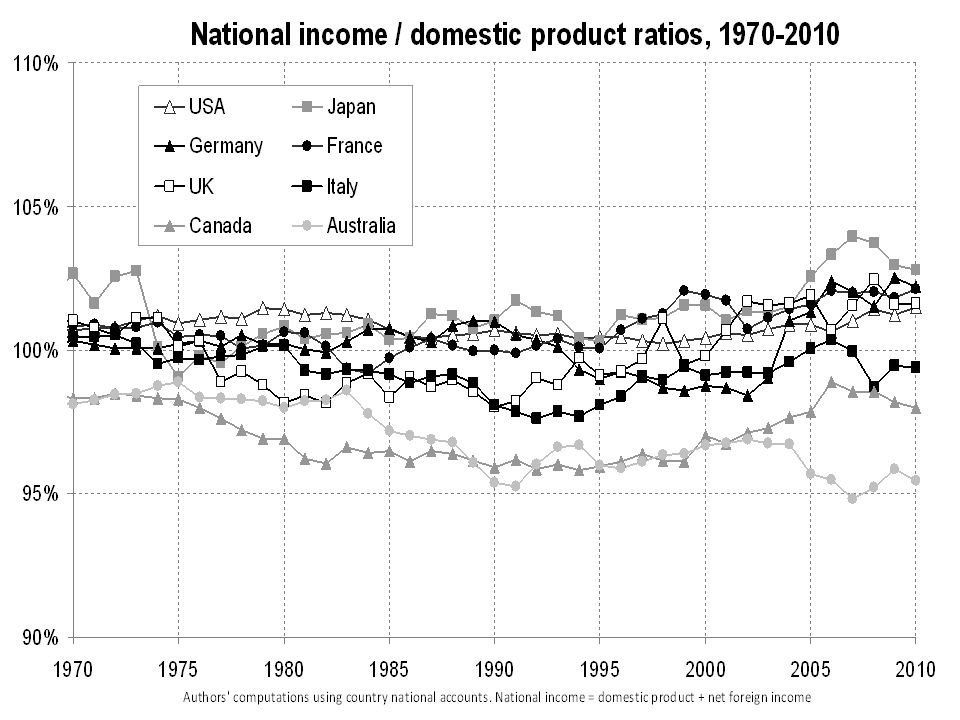
But wealth-income ratios ↑ much more in Europe Results from Piketty-Zucman, « Capital is Back: Wealth-Income Ratios in Rich Countries 1870-2010 » How do aggregate wealth-income ratios evolve in the long run, and why? Until recently, it was impossible to adress properly this basic question: national accounts were mostly about flows on income, output, savings, etc., and very little about stocks of assets and liabilities In this paper we compile a new data set of national balance sheets in order to adress this question: -1970-2010: US, Japan, Germany, France, UK, Italy, Canada, Australia (= top 8 rich countries) -1870-2010: US, Germany, France, UK (official national accounts + historical estimates)
 : US, Germany, France, UK (official national accounts + historical estimates).")
12
Result 1: we find in every country a gradual rise of wealth-income ratios over 1970-2010 period, from about 200%-300% in 1970 to 400%-600% in 2010 Result 2: in effect, today’s ratios seem to be returning towards the high values observed in 19 c Europe (600%-700%) This can be accounted for by a combination of factors: -Politics: long run asset price recovery effect (itself driven by changes in capital policies since WWs) -Economics: slowdown of productivity and pop growth Harrod-Domar-Solow: wealth-income ratio β = s/g If saving rate s=10% & growth rate g=3%, then β≈300% But if s=10% & g=1.5%, then β≈600% Explains long run change & level diff Europe vs US
 This can be accounted for by a combination of factors: -Politics: long run asset price recovery effect (itself driven by changes in capital policies since WWs) -Economics: slowdown of productivity and pop growth Harrod-Domar-Solow: wealth-income ratio β = s/g If saving rate s=10% & growth rate g=3%, then β≈300% But if s=10% & g=1.5%, then β≈600% Explains long run change & level diff Europe vs US")
18
2. A Proposal for a European Wealth Tax Comprehensive wealth tax based upon market-value personal net worth = non-fin. + financial assets – liabilities Very different from 19 c style wealth tax based upon cadastral values (→repealed in Germany, Spain, Sweden..) Closer to French ISF (annual wealth returns with assets valued at market prices; ISF created in late 20 c : inflation) But with a broader tax base than ISF, and with returns prefilled by tax administration on the basis of information transmitted by banks It requires a lot of information, but this is technically doable Key is political: we should not have free trade agreements without automated cross-border information exchange on financial assets and financial flows
 Closer to French ISF (annual wealth returns with assets valued at market prices; ISF created in late 20 c : inflation) But with a broader tax base than ISF, and with returns prefilled by tax administration on the basis of information transmitted by banks It requires a lot of information, but this is technically doable Key is political: we should not have free trade agreements without automated cross-border information exchange on financial assets and financial flows.")
19
An illustrative tax schedule: Marginal tax rate = 1% if net wealth > 1m € (about 2,5% of EU pop) Marginal tax rate = 2% if net wealth > 5m € (about 0,2% of EU pop) Simulations: this would raise ≈ 2% of EU GDP Why so much revenue? For two reasons: (1) Aggregate private wealth is very large : 500% GDP (2) Wealth is highly concentrated: top 10% wealth holders have 60% of aggregate wealth, and top 1% have 25% I.e. top 1% wealth tax base = 125% of GDP (top 2.5% wealth tax base = 200% GDP, top 0.1% = 50%)
 Aggregate private wealth is very large : 500% GDP (2) Wealth is highly concentrated: top 10% wealth holders have 60% of aggregate wealth, and top 1% have 25% I.e. top 1% wealth tax base = 125% of GDP (top 2.5% wealth tax base = 200% GDP, top 0.1% = 50%).")
21
Other options raise less revenue FTT: less than 0,5% GDP (much less if successful) (double dividend illusion) Top income tax: about 0,5% GDP with a 20% supplementary tax rate on top 1% incomes (100 000+) (top 1% income tax base = 5% GDP) Corporate tax: about 1% GDP with a 10% supplementary tax rate on corporate profits (corporate tax base = 10%-12% GDP) → all these options are useful, especially corporate tax, given tax competition and large decline in rates; but in the long run the wealth tax is even more useful
 (double dividend illusion) Top income tax: about 0,5% GDP with a 20% supplementary tax rate on top 1% incomes ( ) (top 1% income tax base = 5% GDP) Corporate tax: about 1% GDP with a 10% supplementary tax rate on corporate profits (corporate tax base = 10%-12% GDP) → all these options are useful, especially corporate tax, given tax competition and large decline in rates; but in the long run the wealth tax is even more useful")
24
Summing up Eurotax can be useful if it helps member countries raise the tax revenue (1) that are adapted to their economic fundamentals; (2) which they cannot raise on their own Wealth tax meets the two criteria Top income or corporate tax meets also the two criteria; corporate tax is a tempting and useful option, especially given large decline in tax rate; but in the long run wealth tax is even more useful: it raises more revenue, and in a more efficient manner (better to tax stock rather than flow) VAT or general income or payroll tax increase meets none of the criteria: it is not adapted to economic fundamentals, and countries can easily raise them alone
 that are adapted to their economic fundamentals; (2) which they cannot raise on their own Wealth tax meets the two criteria Top income or corporate tax meets also the two criteria; corporate tax is a tempting and useful option, especially given large decline in tax rate; but in the long run wealth tax is even more useful: it raises more revenue, and in a more efficient manner (better to tax stock rather than flow) VAT or general income or payroll tax increase meets none of the criteria: it is not adapted to economic fundamentals, and countries can easily raise them alone")
25
Supplementary slides

31
Concepts & methods National income Y = domestic output Y d + r NFA Private wealth W = non-financial assets + financial assets – financial liabilities (household & non-profit sector) β = W/Y = private wealth-national income ratio Govt wealth W g = non-fin + fin assets - fin liab (govt sector) National wealth W n = W + W g = K + NFA with K = domestic capital (= land + housing + other domestic k) NFA = net foreign assets β n = W n /Y = national wealth-national income ratio Domestic output Y d = F(K,L) (L = labor input) (e.g. K α L 1-α ) Capital share α = r β (r = average rate of return to wealth)
 Capital share α = r β (r = average rate of return to wealth).")
32
Table 2: Growth rate vs private saving rate in rich countries, 1970-2010 Real growth rate of national income Population growth rate Real growth rate of per capita national income Net private saving rate (personal + corporate) (% national income) U.S.2.8%1.0%1.8%7.7% Japan2.5%0.5%2.0%14.6% Germany2.0%0.2%1.8%12.2% France2.2%0.5%1.7%11.1% U.K.2.2%0.3%1.9%7.3% Italy1.9%0.3%1.6%15.0% Australia3.2%1.4%1.7%9.9%
 (% national income) U.S.2.8%1.0%1.8%7.7% Japan2.5%0.5%2.0%14.6% Germany2.0%0.2%1.8%12.2% France2.2%0.5%1.7%11.1% U.K.2.2%0.3%1.9%7.3% Italy1.9%0.3%1.6%15.0% Australia3.2%1.4%1.7%9.9%")
Similar presentations


 Thomas Piketty Academic year 2014-2015 Lecture 2: The dynamics of capital/income.>")


 Thomas Piketty Academic year 2015-2016 Lecture 4: Income Taxes.>")


 OECD Working Party on Financial Statistics 29 November ->")

