Download presentation
Presentation is loading. Please wait.

1
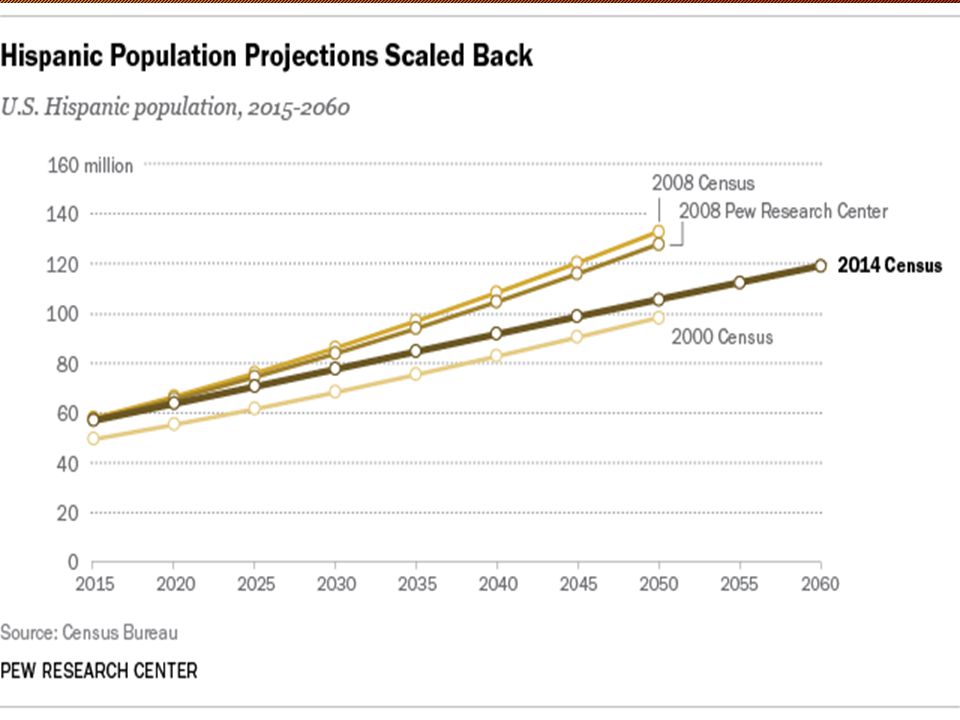
1 Population in millions Hispanic Population in the United States: 1970 to 2050 *Projected Population as of July 1 Projections Census Source: U.S. Census Bureau, 1970, 1980, 1990, and 2000 Decennial Censuses; Population Projections, July 1, 2010 to July 1, 2050

3
U.S. Population, by Race and Ethnicity, 2010 and 2000 (thousands) 2010 2000 Hispanic 50,478 [43.0%]* 35,306 White 196,818 [1.2%] 194,553 Black 37,686 [11.0%] 33,948 Asian 14,465 [42.9%] 10,123 American Indian/Alaska Native 2,247 [8.6%] 2,069 Native Hawaiian/Pacific Islander 482 [36.2%] 354 Some other race 604 [29.1%] 468 Two or more races 5,966 [29.6%] 4,602 *--Percentage growth in decade Notes: Racial groups include only non-Hispanics. Hispanics are of any race. Source: Pew Hispanic Center tabulations of U.S. Census Bureau Redistricting_Files-PL_94-171 for states PEW HISPANIC CENTER, March 24, 2011
 Hispanic 50,478 [43.0%]* 35,306 White 196,818 [1.2%] 194,553 Black 37,686 [11.0%] 33,948 Asian 14,465 [42.9%] 10,123 American Indian/Alaska Native 2,247 [8.6%] 2,069 Native Hawaiian/Pacific Islander 482 [36.2%] 354 Some other race 604 [29.1%] 468 Two or more races 5,966 [29.6%] 4,602 *--Percentage growth in decade Notes: Racial groups include only non-Hispanics. Hispanics are of any race. Source: Pew Hispanic Center tabulations of U.S. Census Bureau Redistricting_Files-PL_ for states PEW HISPANIC CENTER, March 24,")
6
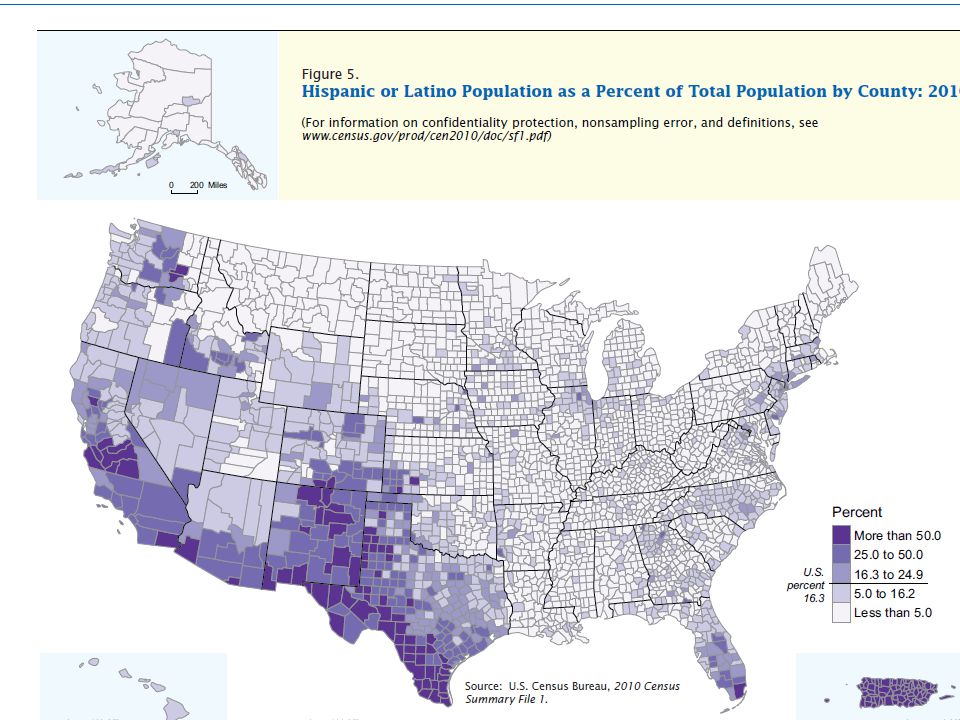
US Latinos, 2010 Census --there were 50.3 million in US, [In 1990, pop. was 22.4 & in 2000 it was 35.2] --represent 16.3% of the nation’s pop. --Latino pop. grew by 43% in decade --since 2000, total pop. of country grew by 27.3 mil. & Latinos were 15.1 mil., or 55.3% of the total country’s growth Source: US Census, June 2011

7
--In the 1990s, the Hispanic population grew by 8.1 million due to immigration and 7 million due to births. --But during the 2000s, Hispanic births (9.6 million) exceeded the number of new Hispanic immigrants (6.5 million).
 exceeded the number of new Hispanic immigrants (6.5 million)..")
8
US Latinos-- 2011 --Between April ’10, & July ‘11, US pop. grew by 2.8 million, 0.7% per year and smallest percentage increase since 1945 --Births rates among Hispanics, …declined by 17% from 2007 to 2010 [3.8% for Whites and 6.7% for Blacks]. --Rates dropped most sharply among young Hispanics, down by 23 percent for women 20 to 24 between 2007 and 2010. Source: NewYork Times, Dec. 22, ’11

9
U.S. Hispanic Population Growth, by Country of Origin, 2000-2010 POPULATION GROWTH 2010 2000 Number % All Hispanics 50,478 35,306 15,172 43.0% Guatemalan 1,044 372 672 180.3 Salvadoran 1,649 655 994 151.7 Colombian 909 471 438 93.1 Dominican 1,415 765 650 84.9 Mexican 31,798 20,641 11,158 54.1 Cuban 1,786 1,242 544 43.8 Puerto Rican 4,624 3,406 1,218 35.7 Notes: Hispanic population growth among country of origin groups with a population of 900,000 or more in 2010. Growth rates are computed from unrounded data. Source: 2010 Census and 2000 Census (Ennis, Ríos-Vargas and Albert, 2011) PEW HISPANIC CENTER
 PEW HISPANIC CENTER.")
10
Hispanic Child & Adult Populations, 2010 – 2000 ALL CHILDREN ADULTS Hispanic Population (thousands) 2010 50,478 17,132 33,346 200035,306 12,342 22,964 Hispanic Population Growth, 2000-2010 Growth (thousands) 15,172 4,790 10,382 Growth (%) 43.0 % 38.8% 45.2 % Hispanic Share of Total (%) 2010 16.3% 23.1% 14.2% 2000 12.5% 17.1 % 11.0 % Notes: Children are those younger than 18; Adults are those 18 years of age or older. Source: Pew Hispanic Center tabulations of U.S. Census Bureau Redistricting_Files-PL_94-171 for states PEW HISPANIC CENTER, March 24, 2011

12
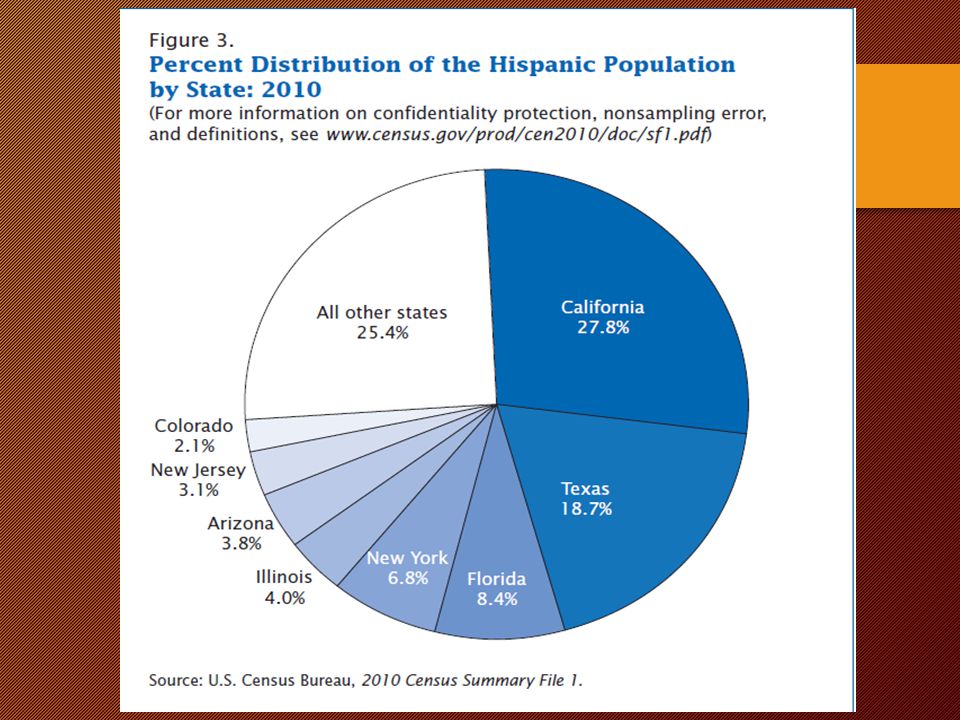
States with Largest Hispanic Populations, 2010 (thousands) STATE POPULATION California 14,014 Texas 9,461 23,475* [46.5%]** Florida 4,224 New York 3,417 Illinois 2,028 33,144 [65.7%] Arizona 1,895 New Jersey 1,555 Colorado 1,039 New Mexico 953 38,586 [76.4%] Georgia 854 North Carolina 800 Washington 756 40,996 [81.2%] *--Cummulative totals **--Cummulative percent Source: Pew Hispanic Center tabulations of U.S. Census Bureau Redistricting_Files-PL_94-171 for states PEW HISPANIC CENTER, March 24, 2011
![States with Largest Hispanic Populations, 2010 (thousands) STATE POPULATION California 14,014 Texas 9,461 23,475* [46.5%]** Florida 4,224 New York 3,417 Illinois 2,028 33,144 [65.7%] Arizona 1,895 New Jersey 1,555 Colorado 1,039 New Mexico ,586 [76.4%] Georgia 854 North Carolina 800 Washington ,996 [81.2%] *--Cummulative totals **--Cummulative percent Source: Pew Hispanic Center tabulations of U.S.](http://images.slideplayer.com/19/5740777/slides/slide_12.jpg "Census Bureau Redistricting_Files-PL_ for states PEW HISPANIC CENTER, March 24,")
13
US Latinos– 2000-2010 --Texas grew by more than four million people in the last decade, with about 65 percent of the growth coming in the Hispanic population. Source: New York Times, Jan. 21, ’12

14
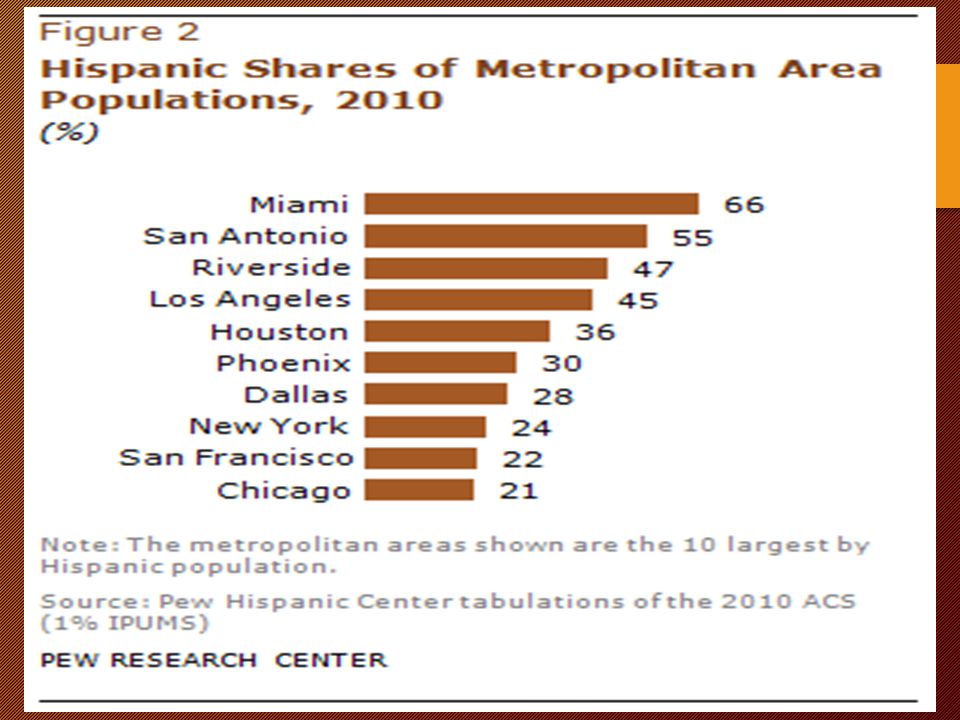
Miami-Dade County --”Cubans, …making up just over half of Hispanics and a third of total pop.” --”…Hispanics have gone from 23% of the pop. in ‘70 to 65% now, …” --Miami-Fort-Lauderdale region eclipsed Los Angeles in 2012 as the major metropolitan area with the largest share--42%-- of immigrant business owners…” --”Colombians now make up 5% of population, largest South American group.” --”The Venezuelan pop. jumped 117% in 10-yrs.” --Over half of Miami’s residents are foreign born, and 63% speak Spanish at home.” Source: Fiscal Policy Institute, New York Times, July 20, 2014

15
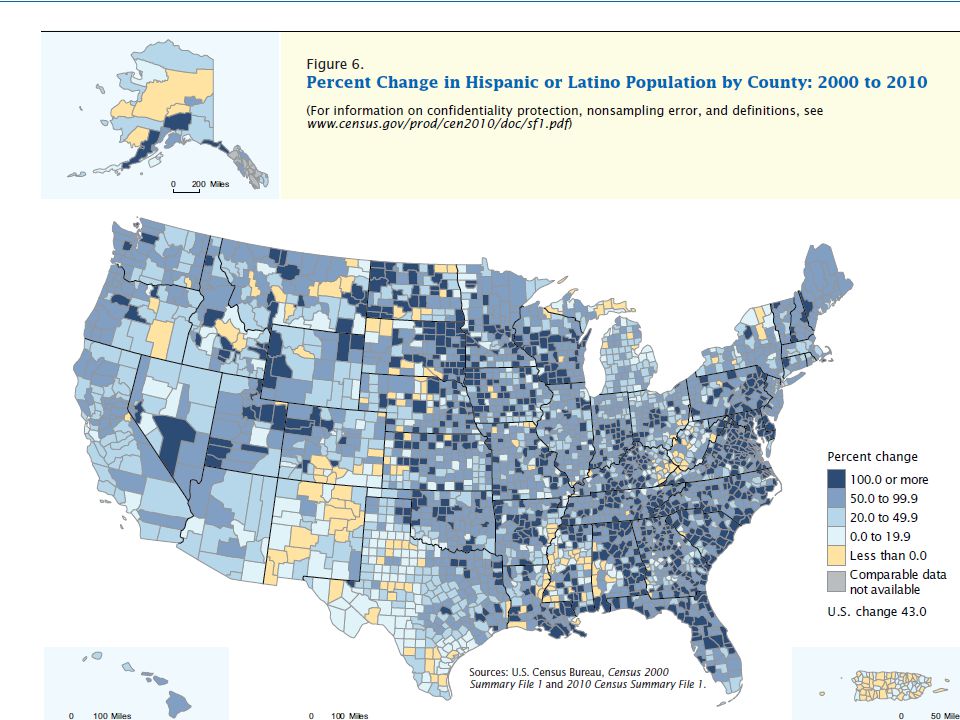
States with Largest Hispanic Population (Growth, 2000-2010) STATE GROWTH, 2000-2010 South Carolina 148 % Alabama 145 Tennessee 134 Kentucky 122 Arkansas 114 North Carolina 111 Maryland 106 Mississippi 106 South Dakota 103 Delaware 96 Georgia 96 Virginia 92 Source: Pew Hispanic Center tabulations of U.S. Census Bureau Redistricting_Files-PL_94-171 for states PEW HISPANIC CENTER, March 24, 2011

16
“Georgia’s Hispanic pop. nearly doubled between 2000 & 2010, according to federal census data. In suburban Atlanta’s Gwinnett County, the most heavily Hispanic locality in the state, the Latino population rose from 64,137 to 162,035.” Source: New York Times, June 26, 2013

17
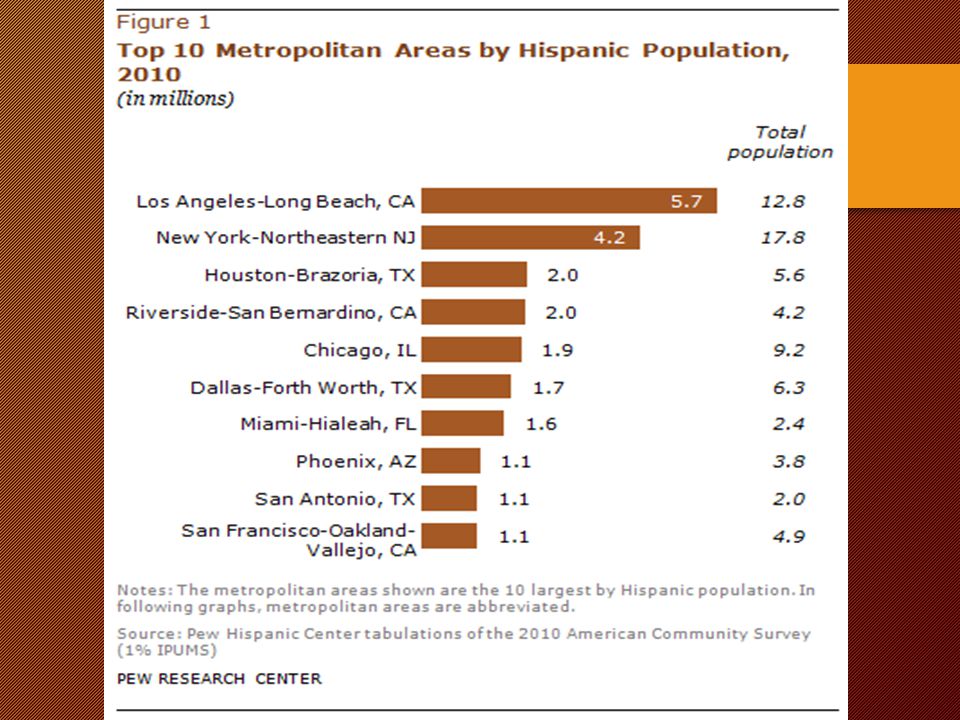
US Latinos, Counties, 2010 Census --Los Angeles = 4.7 million --Harris = 1.7 million --Miami-Dade = 1.6 million --Cook = 1.2 million --Maricopa = 1.1 million Source: US Hispanic population:2010, US Census, May, 2011

18
US Latinos, Counties, 2010 Census --Orange = 1.0 million --Bexar = 1.0 million --San Bernandino = 1.0 million --Top Eight Counties = 13.3 [26.3%] Source: US Hispanic population:2010, US Census, May, 2011
![US Latinos, Counties, 2010 Census --Orange = 1.0 million --Bexar = 1.0 million --San Bernandino = 1.0 million --Top Eight Counties = 13.3 [26.3%] Source: US Hispanic population:2010, US Census, May, 2011](http://images.slideplayer.com/19/5740777/slides/slide_18.jpg "US Latinos, Counties, 2010 Census --Orange = 1.0 million --Bexar = 1.0 million --San Bernandino = 1.0 million --Top Eight Counties = 13.3 [26.3%] Source: US Hispanic population:2010, US Census, May, 2011")
21
States with Largest Hispanic Share of Total Population, 2010 STATE HISPANIC SHARE New Mexico *[5]46.3% Texas 37.6 California 37.6 Arizona [11]29.6 Nevada [6]26.5 Florida [29] 22.5 Colorado [9] 20.7 New Jersey 17.7 New York 17.6 Illinois 15.8 Connecticut 13.4 Utah 13.0 *--Considered `swing’ states in presidential elections, have a total of 60 Electoral College votes Source: Pew Hispanic Center tabulations of U.S. Census Bureau Redistricting_Files-PL_94-171 for states, PEW HISPANIC CENTER, March 24, 2011
![States with Largest Hispanic Share of Total Population, 2010 STATE HISPANIC SHARE New Mexico *[5]46.3% Texas 37.6 California 37.6 Arizona [11]29.6 Nevada [6]26.5 Florida [29] 22.5 Colorado [9] 20.7 New Jersey 17.7 New York 17.6 Illinois 15.8 Connecticut 13.4 Utah 13.0 *--Considered `swing’ states in presidential elections, have a total of 60 Electoral College votes Source: Pew Hispanic Center tabulations of U.S.](http://images.slideplayer.com/19/5740777/slides/slide_21.jpg "Census Bureau Redistricting_Files-PL_ for states, PEW HISPANIC CENTER, March 24,")
23
Teen/Adult Demographics --”About 45% of American citizens in their teenage years are either Latino or a member of a racial minority, compared with only 29% of citizens 20 and older.” Source: New York Times, July 8, 2014

24
Latinos --ECONOMIC CLOUT --Latino purchasing power now exceeds 1.2 trillion. [will top 1.5 trillion by 2015] --Latino market will be [2015] the 11 th largest in the world. --Latinos per capita purchasing power is $20,400. --16% of American workers are Latinos, with 23 million holding jobs. --Latinos have the highest labor-participation-rate of any other race/ethnic group, equaling 67%. --At least 1.1 million Latino youths will turn 18 every year, for the next 20-yrs. --Baby-boomers will retire at the rate of 10,000 per day for the next 18-yrs. Source: Wall Street Journal, February 2, ‘13

26
Earnings per Year, ‘08 --Asian college graduates earned $62,500* --White college graduates earned $52,400 --Black college graduates earned $48,800 --Hispanic college graduates earned $47,300 *--per full-time job --Male graduates earned $57,800 while female graduates earned $47,700 Source: National Center for Educational Statistics, Milwaukee Journal/Sentinel, July 9, 2014

27
Newlyweds in 2010 --9% of whites married outside of their racial/ethnic group. --17% of blacks married outside of their racial/ethnic group. --26% of Hispanics married outside of their racial/ethnic group. --28% of Asians married outside of their racial/ethnic group. Source: New York Times, May 7, 2013

28
Wisconsin Hispanics, 2010 --Total State Pop. in 2010 = 5.712 million --Hispanic Pop. In 2010 = 348,432, 6.1% of state’s population --WI Latinos represent 0.7% of US Latino pop., 24 th in country --66% of WI Latinos are Native-Born --79% of WI Hispanics are of Mexican heritage --Median age of WI Latinos is 25-yrs….16 for Native-born and 35 for foreign-born, non- Hispanic whites = 41-yrs Source: US Census, State & County Quick Facts, August, 2012

29
Wisconsin Hispanics, 2010 Between 2000 and 2010, WI’s pop. grew by 348,000 [6.49%] and of those, 98,389 were Hispanics, representing 28.3% of the total growth. The Hispanic population grew by 39.4%, more than six-times the rate of the entire state. Source: US Census, July 9. 2011

30
--Percent of WI Latinos that are 9-yrs or younger is 24.8% --Percent of WI Latinos that are 19-yrs or younger is 42.9%

31
WI County Hispanic Pop., ‘10 --Milwaukee = 129,544 13.6% 37.1% --Dane = 30,253 6.1 8.7 --Racine = 22,860 11.7 6.5 --Kenosha = 20,075 12.0 5.7 --Brown = 18,856 7.5 5.4 --Waukesha = 16,801 4.3 4.8 --Rock = 12,487 7.8 3.6 --Walworth = 10,808 10.5 3.4 --Outagamie = 6,761 3.8 1.9 --Sheboygan = 6,448 5.6 1.8 TOTALS = 349,310 78.9% Source: US census

32
Milwaukee Hispanics, 2010 --Milwaukee Co Pop. Estimate is 952,532 --Milwaukee Co. Hispanic Pop. is 129,544, representing 13.6% of county’s pop. --From 2000 to 2010, Milwaukee Co. pop. grew by only 12,368, while Latino pop. grew by 47,138—e.g. without Latino pop., county would have declined in pop…Latino pop. grew by 57.2% --Between 1990 and 2000, Milwaukee Co. pop. declined by 19,000, while Latino pop. grew by 37, 700 Source: US Census, July 9, 2010

33
Latinos —RESHAPING US? --Numerically, the US is being transformed.—are our institutions are being transformed?. --More US babies are now born to minorities than whites --45% of K-12 students are minorities --CA, DC, HA, NM, & TX have minority pop. > whites [by 2020, AZ, FL, GA, MD, MS, NV, NJ, & NY will be same] --By 2039, racial & ethnic minorities will make up the majority of of US working-age pop. [more than 25% will be Latinos] --A first-of-its-kind AP poll conducted in 2011 found that a slight majority of whites expressed racial bias against Hispanics and that their attitudes were similar to or even greater than the bias they held toward blacks. Source: Milwaukee Journal Sentinel, March 13, ‘13

34
34

35
35

36
36

37
37

41
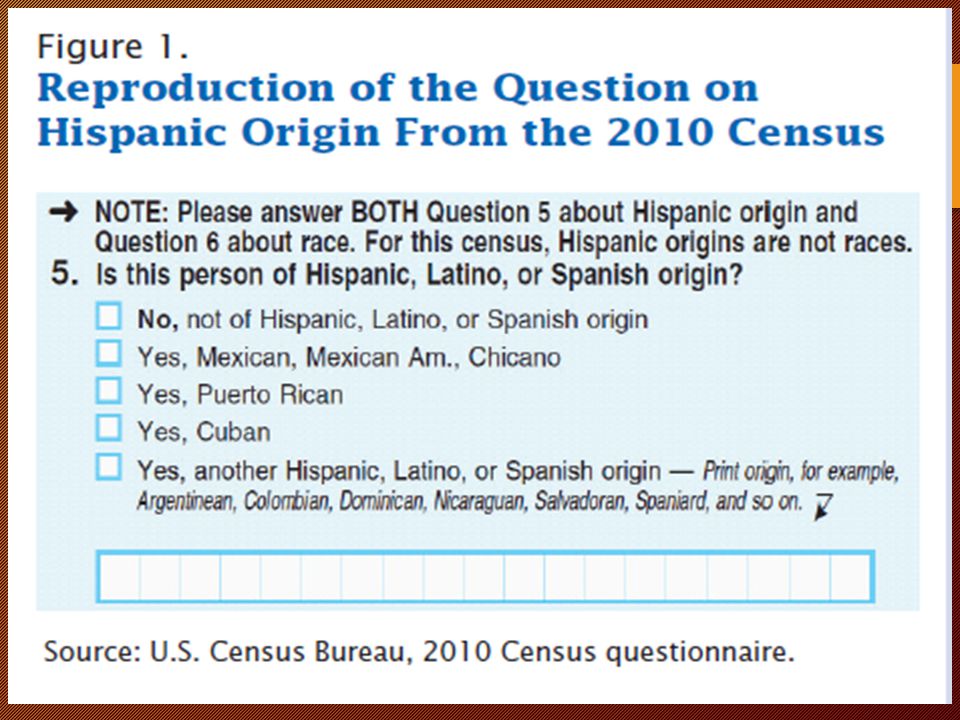
Latinos and The Census Is it Race or Ethnicity? 1960 1970 1980 1990 2000 Race (one-race); No Data Collected for Latinos Race (one-race);Spanish Origin Yes or No Race (one-race); Spanish/Hispanic Origin Mex/PR/Cuban/Other Race (one-race); Hispanic Origin Mex/PR/Cuban/Fill-in-the-Blank Race (multi-race); Hispanic/Latino Mex/PR/Cuban/Fill-in-the-Blank “Latinos Can be of Any Race”
; No Data Collected for Latinos Race (one-race);Spanish Origin Yes or No Race (one-race); Spanish/Hispanic Origin Mex/PR/Cuban/Other Race (one-race); Hispanic Origin Mex/PR/Cuban/Fill-in-the-Blank Race (multi-race); Hispanic/Latino Mex/PR/Cuban/Fill-in-the-Blank Latinos Can be of Any Race .")
42
Latinos —A RACE? --Census is considering eliminating the Hispanic origin question and combining it with the race question in a “race” or “origin” category. --Added a “some other race” category in 1980 and so many Hispanics chose it. --95% choosing “some other race” are Hispanics. Source: USA TODAY, January 4, ‘13

43
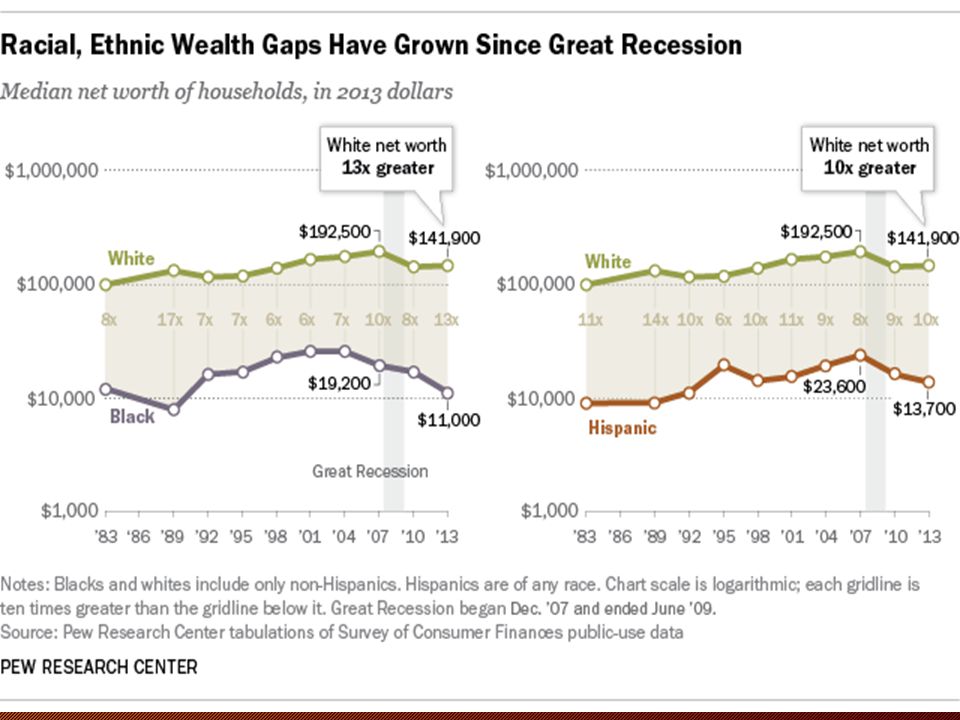
US Latinos --Declining Status --”Over the past two decades, Hispanics have moved from the middle of the socioeconomic hierarchy, between blacks and whites, to a position below both. On virtually every indicator of socioeconomic welfare, Hispanics fell relative to blacks.” Source: Massey, Douglas,Ss., “Isolated, Vulnerable And Broke”, Op-Ed., New York Times, August 5, 2011

44
HODGEPODGE, ‘10/’11 --More than 41% of births were to unwed mothers. [33% a decade before] --College loan debt in a household headeed by a college graduate is $36,809. [$12,373 three decades earlier] --Hispanics make up a disproportionate number of carwash workers; Asians of nail salons, and blacks of security services. --Liquor stores outnumber bookstores by 3-to-1. --Average household spent $100 on reading materials and $2,504 on other forms of `entertainment’. --The are 10.6 million fantacy sports league members, but only 5.7 book-club members. Source: New York Times, December 12, ‘12

Similar presentations

 981-4076>")


