Download presentation
Presentation is loading. Please wait.

1
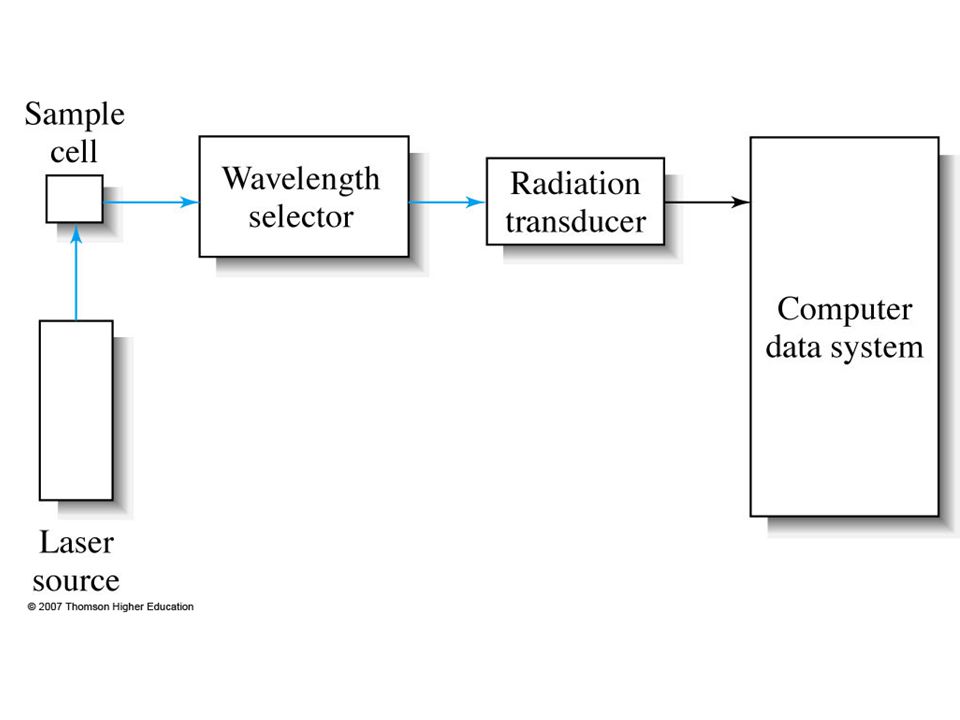
RAMAN INSTRUMENTATION
Modern Raman spectroscopy consists of three components: Laser source sample illumination system suitable spectrometer. 1. Source: The sources used in are nearly always lasers Because their high intensity is necessary to produce Raman scattering of sufficient intensity to be measured with a reasonable S/N ratio. Because the intensity of Raman scattering varies as the fourth power of the frequency, argon and krypton ion sources that emit in the blue and green region of the spectrum have an advantage over the other sources.

2
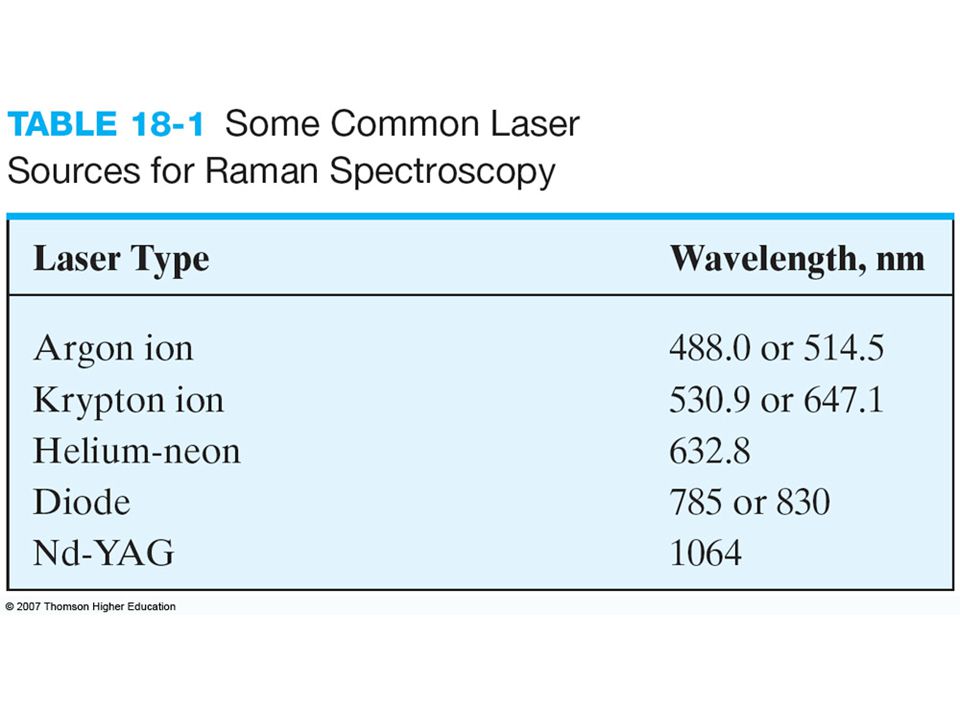
EXERCISE Which of the following lasers would yield best results when measuring weak Raman signals, and approximately by how much? Green argon line (514.5 nm) vs. blue argon line (488 nm): Nd:YAG fundamental (1064 nm) vs. diode laser (785 nm):
 vs. blue argon line (488 nm): Nd:YAG fundamental (1064 nm) vs. diode laser (785 nm):")
5
CCD Detectors charge-coupled devices
Most of the current dispersive Raman set-ups are now equipped with multichannel two-dimensional CCD detectors. The main advantages of these detectors are: - The high quantum efficiency. The extremely low level of thermal noise (when effectively cooled). Low read noise. The large spectral range available. Many CCD chips exist, but one of the most common spectroscopy sensor formats is the 1024 x 256 pixel array.
. Low read noise. The large spectral range available. Many CCD chips exist, but one of the most common spectroscopy sensor formats is the 1024 x 256 pixel array.")
6
CCD detectors TE cooled charge-coupled device (CCD) detector or “Camera” that allows simultaneous collection of a wide spectral wavelength range. A water cooling option allows -90º C operation. Thermoelectric (TE) cooling is efficient, maintenance-free and requires no liquid nitrogen TE cooling provides long-term stability at optimum quantum efficiency Longer wavelengths can be detected more efficiently at higher temperatures than liquid nitrogen cooling. Thermoelectrically (TE) cooled CCD.
 detector or Camera that allows simultaneous collection of a wide spectral wavelength range. A water cooling option allows -90º C operation. Thermoelectric (TE) cooling is efficient, maintenance-free and requires no liquid nitrogen. TE cooling provides long-term stability at optimum quantum efficiency. Longer wavelengths can be detected more efficiently at higher temperatures than liquid nitrogen cooling. Thermoelectrically (TE) cooled CCD.")
8
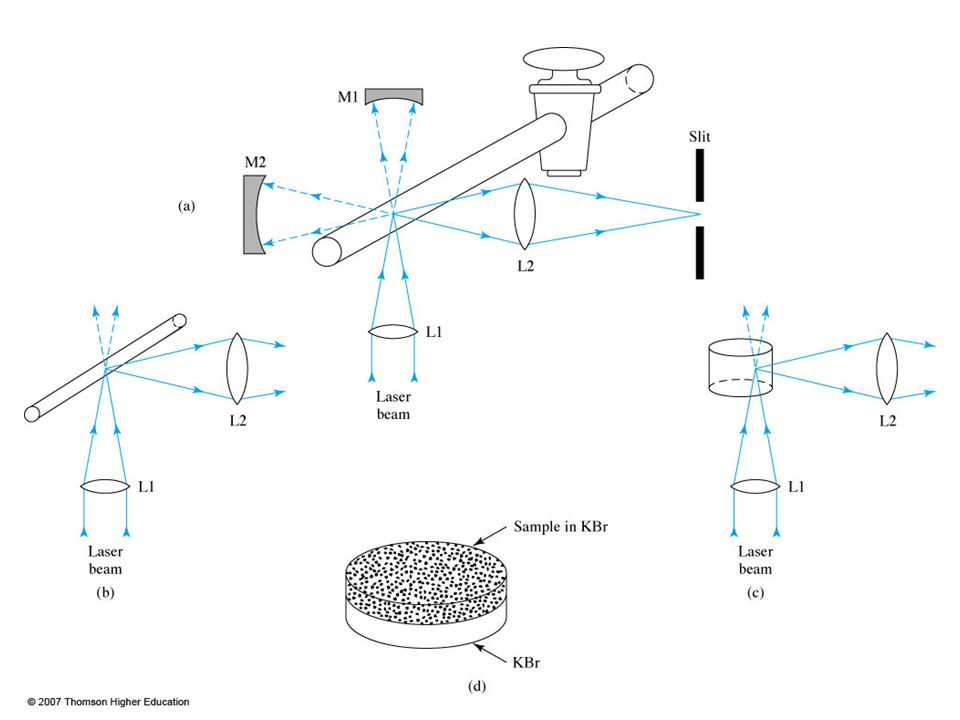
Sample Illumination System
Sample handling for Raman spectroscopic measurements is simpler than for infrared spectroscopy. because glass can be used for windows, lenses, and other optical components instead of the more fragile and atmospherically less stable crystalline halides. In addition, the laser source is easily focused on a small sample area and the emitted radiation efficiently focused on a slit. Consequently, very small samples can be investigated. A common sample holder for nonabsorbing liquid samples is an ordinary glass melting-point capillary.

9
If the sample is colourless, it does not absorb a visible laser.
If the compound is colored, it can absorb the laser, get hot and decompose. Some techniques are: • Reduce the laser power (defocus) and/or change wavelength; • Dilute the sample into a KBr pellet; • Cool the sample • Rotate or oscillate the laser beam on the sample
 and/or change wavelength; • Dilute the sample into a KBr pellet; • Cool the sample. • Rotate or oscillate the laser beam on the sample.")
10
Gases: use gas cell Liquids and solids can be sealed in a glass capillary:

11
Sample Illumination System
Liquid Samples: A major advantage of sample handling in Raman spectroscopy compared with infrared arises because water is a weak Raman scatterer but a strong absorber of infrared radiation. Thus, aqueous solutions can be studied by Raman spectroscopy but not by infrared. This advantage is particularly important for biological and inorganic systems and in studies dealing with water pollution problems. Solid Samples: Raman spectra of solid samples are often acquired by filling a small cavity with the sample after it has been ground to a fine powder. Polymers can usually be examined directly with no sample pretreatment.

12
Introduction to Optical Fibers.
Fibers of glass Usually 120 micrometers in diameter Used to carry signals in the form of light over distances up to 50 km.

13
Constituents Core – thin glass center of the fiber where light travels. Cladding – outer optical material surrounding the core Buffer Coating – plastic coating that protects the fiber.

14
Advantages of Optical Fibre
Thin. Not Expensive Higher Carrying Capacity Less Signal Degradation& Digital Signals Light Signals Non-Flammable Light Weight

15
Areas of Application Telecommunications Local Area Networks Cable TV Optical Fiber Sensors

16
Types of Fibers Optical fibers come in two types:
Single-mode fibers – used to transmit one signal per fiber (used in telephone and cable TV). They have small cores(9 microns in diameter) and transmit infra-red light from laser. Multi-mode fibers – used to transmit many signals per fiber (used in computer networks). They have larger cores(62.5 microns in diameter) and transmit infra-red light from laser.
. They have small cores(9 microns in diameter) and transmit infra-red light from laser. Multi-mode fibers – used to transmit many signals per fiber (used in computer networks). They have larger cores(62.5 microns in diameter) and transmit infra-red light from laser.")
17
Total Internal Reflection in Fiber Transmit light signal

18
Fiber-Optic Sampling One of the significant advantages of Raman spectrometry is that it is based on visible or near-IR radiation that can be transmitted for a considerable distance (as much as 100 m or more) through optical fibers. The arrangement of a typical Raman instrument that uses a fiber-optic probe.
 through optical fibers. The arrangement of a typical Raman instrument that uses a fiber-optic probe.")
19
Here, a microscope objective lens is used to focus the laser excitation beam on one end of an excitation fiber of a fiber bundle. These fibers bring the excitation radiation to the sample. Fibers can be immersed in liquid samples or used to illuminate solids. A second fiber or fiber bundle collects the Raman scattering and transports it to the entrance slit of the spectrometer. Several commercial instruments are now available with such probes. Fiber-optic probes are proving very useful for obtaining Raman spectra in locations remote from the sample site. Examples include: hostileعدائية environments, such as hazardous reactors or molten salts; biological samples, such as tissues and bacterial walls; and environmental samples, such as groundwater and seawater.

20
Raman Spectrometers Raman spectrometers were similar in design and used the same type of components as the classical ultraviolet/visible dispersing instruments. Most employed double grating systems to minimize the spurious radiation reaching the transducer. Photomultipliers served as transducers. Now Raman spectrometers being marketed are either Fourier transform instruments equipped with cooled germanium transducers or multichannel instruments based upon charge-coupled devices.

21
Raman Spectrophotometer

22
FT-Raman Spectrometer

23
APPLICATIONS OF RAMAN SPECTROSCOPY
Raman Spectra of Inorganic Species The Raman technique is often superior to infrared for spectroscopy investigating inorganic systems because aqueous solutions can be employed. In addition, the vibrational energies of metal-ligand bonds are generally in the range of 100 to 700 cm-1, a region of the infrared that is experimentally difficult to study. These vibrations are frequently Raman active, however, and peaks with values in this range are readily observed. Raman studies are potentially useful sources of information concerning the composition, structure, and stability of coordination compounds.

24
Raman studies have been useful in determining the probable structures of many species.
For example: in perchloric acid solutions, vanadium(lV) appears to be present as VO (aq) rather than as V(OH)22+ (aq). Studies of boric acid solutions show that the anion formed by acid dissociation is the tetrahedral B(OH)4-, rather than H2 BO3-. Dissociation constants for strong acids such as H2SO4, HNO3, H2SeO4 and H5IO6 have been calculated from Raman measurements.
 appears to be present as VO 2+ (aq) rather than as V(OH)22+ (aq). Studies of boric acid solutions show that the anion. formed by acid dissociation is the tetrahedral B(OH)4-, rather than H2 BO3-. Dissociation constants for strong acids such as H2SO4, HNO3, H2SeO4 and H5IO6 have been calculated from Raman measurements.")
25
Typical Raman spectrum Plot of signal intensity vs Raman shift
(Raman shift, in cm-1 = energy of photon in-energy of photon out) shows 3 vibrations of octahedral BiCl63-
 shows 3 vibrations of octahedral. BiCl63-")
26
Raman Spectra of Organic Species
Raman spectra are similar to infrared spectra in that they have regions that are useful for functional group detection and fingerprint regions that permit the identification of specific compounds. Raman spectra yield more information about certain types of organic compounds than do their infrared counterparts.

27
Biological Applications of Raman Spectroscopy
Raman spectroscopy has been applied widely for the study of biological systems. The advantages of his technique include: The small sample requirement. The minimal sensitivity toward interference by water. The spectral detail. The conformational and environmental sensitivity.

28
Quantitative applications
Advantages: Raman spectra tend to be less cluttered with peaks than infrared spectra. As a consequence, peak overlap in mixtures is less likely, and quantitative measurements are simpler. In addition, Raman sampling devices are not subject to attack by moisture, and small amounts of water in a sample do not interfere. Disadvantages: Despite these advantages, Raman spectroscopy has not yet been exploited widely for quantitative analysis. This lack of use has been due largely to the rather high cost of Raman spectrometers relative to that of absorption instrumentation.

29
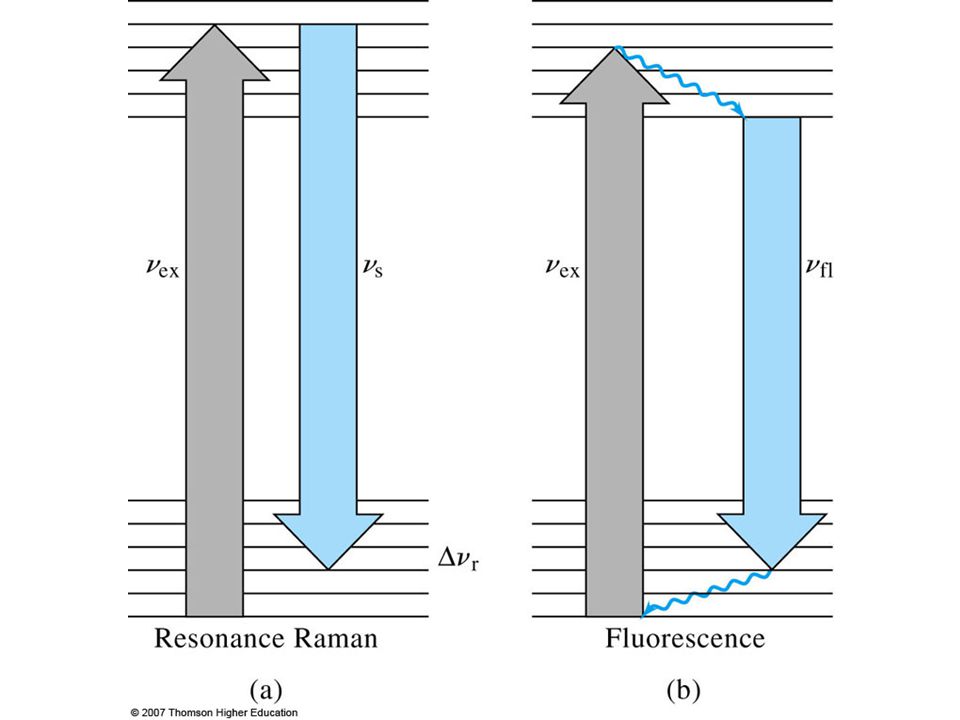
Resonance Raman Spectroscopy
Resonance Raman scattering refers to a phenomenon in which Raman line intensities are greatly enhanced by excitation with wavelengths that closely approach that of an electronic absorption peak of an analyte. Under this circumstance, the magnitudes of Raman peaks associated with the most symmetric vibrations are enhanced by a factor of 102 to 106. As a consequence, resonance Raman spectra have been obtained at analyte concentrations as low as 10-8 M.

31
Resonance Raman Spectroscopy (Biolgical applications)
The most important application of resonance Raman spectroscopy has been to the study of biological molecules under physiologically significant conditions; that is , in the presence of water and at low to moderate concentration levels. As an example, the technique has been used to determine the oxidation state and spin of iron atoms in hemoglobin and cytochrome-c. In these molecules, the resonance Raman bands are due solely to vibrational modes of the tetrapyrrole chromophore. None of the other bands associated with the protein is enhanced, and at the concentrations normally used these bands do not interfere as a consequence.

32
Surface-Enhanced Raman Spectroscopy (SERS)
Surface enhanced Raman spectroscopy involves obtaining Raman spectra in the usual way on samples that are adsorbed on the surface of colloidal metal particles (usually silver, gold, or copper) or on roughened surfaces of pieces of these metals. For reasons that are not fully understood, the Raman lines of the adsorbed molecule are often enhanced by a factor of 103 to 106. When surface enhancement is combined with the resonance enhancement technique discussed in the previous section, the net increase in signal intensity is roughly the product of the intensity produced by each of the techniques. Consequently, detection limits in the 10-9 to M range have been observed.
 or on roughened surfaces of pieces of these metals. For reasons that are not fully understood, the Raman lines of the adsorbed molecule are often enhanced by a factor of 103 to 106. When surface enhancement is combined with the resonance enhancement technique discussed in the previous section, the net increase in signal intensity is roughly the product of the intensity produced by each of the techniques. Consequently, detection limits in the 10-9 to M range have been observed.")
33
Nature of SERS Not extremely well understood. Arises from two effects:
Electromagnetic interactions Chemical enhancement Electromagnetic: Dominant. Depends on the metal surfaces’ roughness features, which can be attained via small metal particles. The metal particles create an EM field (plasmon) proximal to the analyte, enhancing its Raman signal. Chemical: Electronic coupling with the metal surface, creating a higher Raman scattering cross-section via a variety of pathways (charge-transfer intermediates, interactions with free electrons, etc.).
 proximal to the analyte, enhancing its Raman signal. Chemical: Electronic coupling with the metal surface, creating a higher Raman scattering cross-section via a variety of pathways (charge-transfer intermediates, interactions with free electrons, etc.).")
34
Surface-enhanced Raman
Can increase the Raman signal by a factor of regularly, with even for some systems. Surface selective, highly sensitive: allows for trace analysis. Best when (Au, Ag, Cu) or (Li, Na, K) used a-C:H a-C The spectra at right show the regular spectra of a-C:H and a-C (bottom curves), and the (From Veres, M. et al, 2004, see ref.) Advanced Vitreous State 2007, Raman spectroscopy 2, M. Affatigato SERS enhancement (top curves)
 or (Li, Na, K) used. a-C:H. a-C. The spectra at right show the. regular spectra of a-C:H and. a-C (bottom curves), and the. (From Veres, M. et al, 2004, see ref.) Advanced Vitreous State 2007, Raman spectroscopy 2, M. Affatigato. SERS enhancement (top curves)")
35
Advantages of Raman Spectroscopy

38
Raman Spectrum of Cholesterol

39
General Applications of Raman Spectroscopy
Structural chemistry Solid state Analytical chemistry Applied materials analysis Process control Microspectroscopy/imaging Environmental monitoring Biomedical

40
General Comparison to Infrared Absorption
(N)IR absorption directly interrogates molecular vibrations Requires change in dipole moment No symmetric stretches observed No diatomic activity Only observed in NIR and IR spectral regions High water absorption Broad spectral features Raman requires a change in polarizability with vibrational motion Occurs at all wavelengths Weak signal Sharp spectral features for molecular fingerprinting Complementary techniques Symmetric molecules with a center of inversion have vibrations which are either Raman or IR active, but not both (e.g. benzene) Molecules with no symmetry are active in both methods
IR absorption directly interrogates molecular vibrations. Requires change in dipole moment. No symmetric stretches observed. No diatomic activity. Only observed in NIR and IR spectral regions. High water absorption. Broad spectral features. Raman requires a change in polarizability with vibrational motion. Occurs at all wavelengths. Weak signal. Sharp spectral features for molecular fingerprinting. Complementary techniques. Symmetric molecules with a center of inversion have vibrations which are either Raman or IR active, but not both (e.g. benzene) Molecules with no symmetry are active in both methods.")
42
Raman Spectra: Fingerprinting a Molecule
Raman spectra are molecule specific Spectra contain information about vibrational modes of the molecule Spectra have sharp features, allowing identification of the molecule by its spectrum Examples of analytes found in blood which are quantifiable with Raman spectroscopy

43
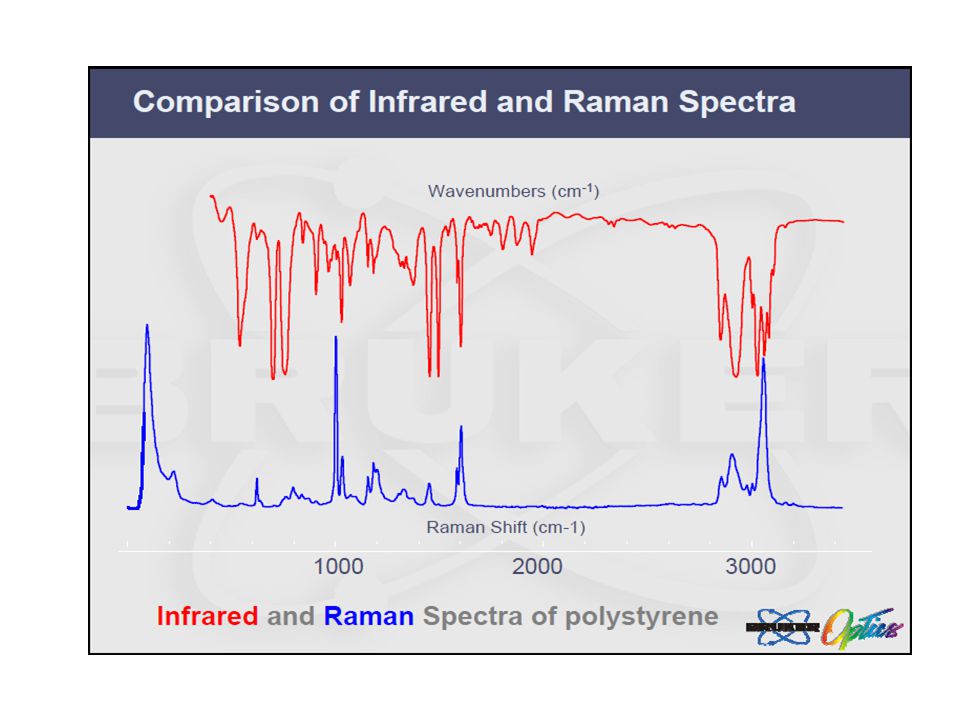
Raman vs. Infrared Spectroscopy
1. Some vibrations are inherently weak in IR and strong in Raman spectra. C≡C , C=C , P=S , S–S and C–S stretching vibrations are normally stronger in Raman (in general those bond with more covalent character). O–H , N–H are stronger in the IR (in general those bond with more ionic character). Multiple bonds are normally more intense in the Raman spectrum than single bonds. Raman intensity increases as C≡C > C=C > C–C.
. O–H , N–H are stronger in the IR (in general those bond with more ionic character). Multiple bonds are normally more intense in the Raman spectrum than single bonds. Raman intensity increases as C≡C > C=C > C–C.")
44
Raman vs Infrared Spectra

45
Raman vs. Infrared Spectroscopy

46
Raman vs. Infrared Spectroscopy
2. Water is a very weak Raman scatterer. Thus, Raman spectra of samples in aqueous solution and hygroscopic air-sensitive compounds can be obtained without major interference from water vibrations and its rotation fine structures that are extremely strong in IR absorption spectra. 3. Sample container in Raman technique is made of glass. In IR technique it is impossible to use glass as it absorbs IR radiation.

47
4. Raman experiment uses a laser beam of a very small diameter (1-2 mm). Thus a very small quantity of the sample is needed to be characterized. 5. The laser source used by Raman needs to be carefully dealt with. It could cause local heating for the sample, burn the sample, or cause it to decompose. 6. Raman instruments need careful calibration as they record the shift in frequencies, unlike the IR technique.

48
7. The Raman technique is often superior to infrared for spectroscopy investigating inorganic systems because aqueous solutions can be employed. In addition, the vibrational energies of metal-ligand bonds are generally in the range of 100 to 700 cm-1, a region of the infrared that is experimentally difficult to study. These vibrations are frequently Raman active, however, and peaks with values in this range are readily observed. Raman studies are potentially useful sources of information concerning the composition, structure, and stability of coordination compounds.

49
8. Raman spectra tend to be less cluttered with peaks than infrared spectra. As a consequence, peak overlap in mixtures is less likely, and quantitative measurements are possibly simpler. 9. Raman spectroscopy has not yet been exploited widely for quantitative analysis. This lack of use has been due largely to the rather high cost of Raman spectrometers relative to that of absorption instrumentation.

50
Raman vs. FTIR Raman FTIR Sensitive to C=C, C≡C
Distinguish diamond-C from amorphous-C Studying backbone vibrations of the organic chain Little sample prep Fluorescence Light Can Swamp Raman Light Fair sensitivity Good microscopic technique FTIR Sensitive to functional group vibrations especially OH stretch in water, good for studying the substituents on organic molecules Usually needs some sample prep for transmission Good sensitivity Good microscopic technique

Similar presentations

 Introduction IR Raman>")


 is based upon emission of electromagnetic radiation by atoms.>")


, Chap. 8 (Optical Atomic Spectroscopy) General design of optical instruments Sources of radiation Selection of wavelength.>")