Download presentation
Presentation is loading. Please wait.

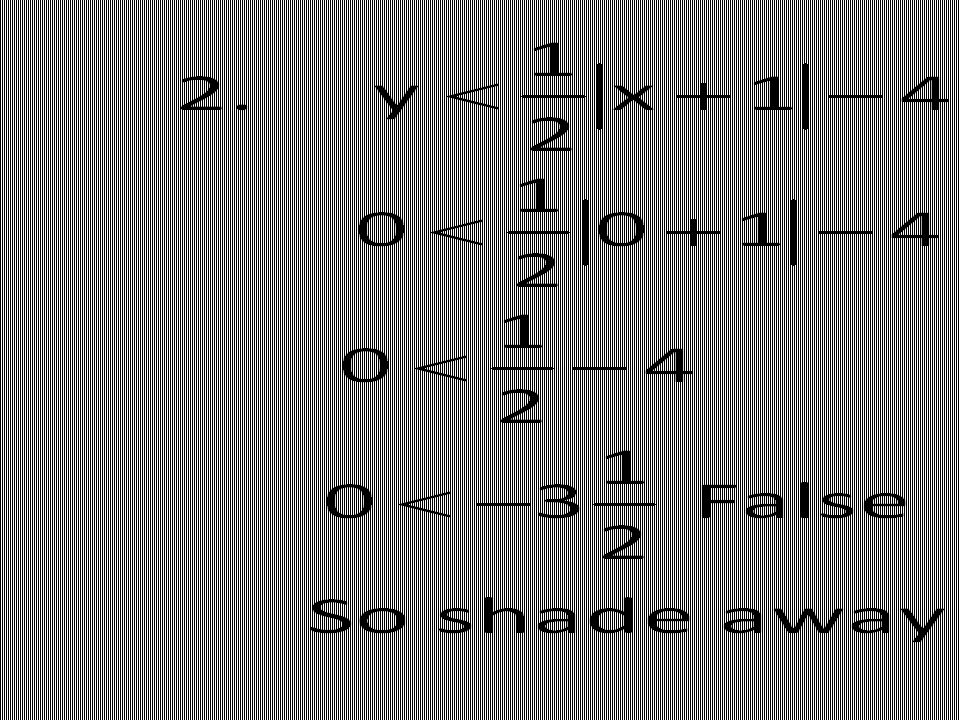
1
SOLVING TWO VARIABLE LINEAR INEQUALITIES
INCLUDING ABSOLUTE VALUE INEQUALITIES

2
Summary of Inequality Signs
> > Shade above the line < < Shade below the line Continuous line Dashed line

3
Graphing Linear Inequalities
The graph of a linear inequality is a region of the coordinate plane that is bounded by a line. This region represents the SOLUTION to the inequality.

4
A linear inequality is an inequality in two variables whose graph is a region of the coordinate plane that is bounded by a line.

5
Graph the following inequality: x > 2
Boundary is: x = 2 We shaded at the right of the line because x is more than 2. The line is dashed because it is not equal or less than x, so the line which is the boundary is not included in the solution.

6
Graph the following inequality: y < 6
Boundary: y = 0x + 6 m= 0 y- intercept = (0,6) We shaded below the line because y is less than 6. The line is dashed because it is not equal or less than y, so the line which is the boundary is not included in the solution.
 We shaded below the line because y is less than 6. The line is dashed because it is not equal or less than y, so the line which is the boundary is not included in the solution.")
7
Example

8
1. The boundary line is dashed.

9
Substitute (0, 0) into the inequality to decide where to shade.
So the graph is shaded away from (0, 0).
.")
11
Graph the following inequality: 4x + 2y < 10
Solve for y y < -2x + 5 Boundary is: y = -2x + 5 m= -2 y- intercept = (0,5) We shaded below the line because y is less than the expression -2x + 5. The line is dashed because it is not equal or less than y, so the line which is the boundary is not included.
 We shaded below the line because y is less than the expression -2x + 5. The line is dashed because it is not equal or less than y, so the line which is the boundary is not included.")
12
Graph the following inequality: -9x + 3y< 3
Solve for y y < 3x + 1 Boundary is: y = 3x + 1 m= 3 y- intercept = (0, 1) We shaded below the line because y is less than the expression 3x +1. The line is dashed because it is not equal or less than y, so the line which is the boundary is not included.
 We shaded below the line because y is less than the expression 3x +1. The line is dashed because it is not equal or less than y, so the line which is the boundary is not included.")
13
Graph the following inequality: y – 2 > (x – 4)
Solve for y y > x – 3 Boundary is: y = x – m = y-intercept = (0, -3) We shaded above because y is greater or equal than the expression and the line is continuous because the word equal in greater or equal indicates that the boundary is included in the solution.
 We shaded above because y is greater or equal than the expression. and the line is continuous because the word equal in greater or equal indicates. that the boundary is included in the solution.")
14
EXAMPLE

15
EXAMPLE

16
EXAMPLE

17
EXAMPLE

18
Problem, con’t

19
Graph the following absolute value equation: y = |x|
For x < 0 For x > 0 y = -x y = x Now let’s shift it two units up: y = |x| + 2 Now let’s shift it three units to the right: y = |x - 3| + 2 Now let’s graph it upside down y = – |x-3| + 2 Now let’s make it skinner y = – 6|x-3| + 2

20
So, that’s how the different parameters in an absolute value equation affect our graph. Now let’s graph absolute value inequalities.

21
Absolute Value Inequalities
Graph the absolute value function then shade above OR below Solid line…y <, y> Dashed line…y<, y> Shade above y>, y> Shade below…y<, y<

22
Absolute Value Inequalities
Graph y < |x – 2| + 3 y < |x – 2| + 3 DASHED line Shade BELOW slope = 1 Vertex = (2, 3)
")
23
Absolute Value Inequalities
Graph y < |x – 2| + 3 Vertex = (2, 3)
")
24
Absolute Value Inequalities
Graph y < |x – 2| + 3 slope = 1

25
Absolute Value Inequalities
Graph y < |x – 2| + 3 DASHED line Shade BELOW

26
Absolute Value Inequalities
Graph y < |x – 2| + 3 Shade BELOW

27
Absolute Value Inequalities
Graph –y + 1 < -2|x + 2| -y < -2|x + 2| - 1 y > 2|x + 2| + 1 -y so CHANGE the direction of the inequality

28
Absolute Value Inequalities
y > 2|x | Solid line Shade above Vertex = (-2, 1) Slope = 2
 Slope = 2.")
29
Absolute Value Inequalities
y > 2|x |

30
Absolute Value Inequalities
y > 2|x |

31
Absolute Value Inequalities
y > 2|x |

32
Absolute Value Inequalities
y > 2|x |

33
Absolute Value Inequalities
Write an equation for the graph below.

34
Graph the following inequality: y > |x|
Finding the boundary: For x < 0 For x > 0 y = -x y = x . There are two regions: Testing point (0,2) 2 > | 0| 2 > true Therefore, the region where (0,2) lies is the solution region and we shade it.
 2 > | 0| 2 > 0 true. Therefore, the region where (0,2) lies is the solution region and we shade it.")
35
Graph the following inequality: y < |x+1|– 3
Finding the boundary: For x + 1 < 0 For x + 1 > 0 y = -(x+1) – 3 y = x+1 – 3 y = - x – 1 -3 y = - x – 4 y = x – 2 There are two regions: Testing point (0,0) 0 < | 0+1| – 3 0 < -2 false So the region where (0,0) lies is not in the solution region, therefore we shade the region below. .
 – 3 y = x+1 – 3 y = - x – 1 -3 y = - x – 4 y = x – 2 There are two regions: Testing point (0,0) 0 < | 0+1| – 3 0 < -2 false So the region where (0,0) lies is not in the solution region, therefore we shade the region below. .")
36
Steps: Decide if the boundary graph is solid or dashed. Graph the absolute value function as the boundary. Use the point (0, 0), if it is not on the boundary graph, to decide how to shade.
, if it is not on the boundary graph, to decide how to shade.")
37
Graph y ≥ 2|x – 3| + 2

38
Graph y ≥ 2|x – 3| + 2 1. The boundary graph is solid.

39
y ≥ 2|x – 3| + 2 0 ≥ 2|0 – 3| + 2 0 ≥ 2|-3| + 2 0 ≥ 6 + 2 0 ≥ 8 False So shade away from (0, 0).
.")
42
The boundary graph is dashed.

45
Your Turn! 8. Graph 9. Graph

46
8. 9.

47
Example 10

48
Example 10 y ≤ |x+4| y ≥ 2x+5

Similar presentations


 and.>")


![Graphing Inequalities of Two Variables Recall… Solving inequalities of 1 variable: x + 4 ≥ 6 x ≥ 2 [all points greater than or equal to 2] Different from.](/18/6205026/big_thumb.jpg "Graphing Inequalities of Two Variables Recall… Solving inequalities of 1 variable: x + 4 ≥ 6 x ≥ 2 [all points greater than or equal to 2] Different from.>")


 Graphing Linear Inequalities What linear inequality graphs look like… 1) boundary line (solid or dashed) 2) shaded area (above or below the boundary.>")

