Download presentation
Presentation is loading. Please wait.

1
Graphing Inequalities and Functions Major Project 2 Educ220 Rachel Harrington

2
VocabInequalities Plotting Coordinates Graphing Linear Equations Slope You can go right to a lesson by clicking on one of these links, or you can just proceed by clicking next (the last button)
")
3
Audience Algebra I class 20-35 students High School

4
Environment Traditional classroom 50 minutes Diverse class

5
Learning Objectives 1) Given a worksheet on vocabulary, student should be able to, with 90% accuracy, correctly identify the definitions of: function, inequality, constants, coordinates, coordinate plane, graph, & negative numbers. 2) Given a calculator, computer, or graph paper, along with a worksheet of simple functions and inequalities, the student needs to graph 18 out of 20 functions/inequalities correctly. 3) Given a worksheet on solving one-step inequalities, student needs to obtain a 90% or higher through using their knowledge of the properties for inequalities.
 Given a calculator, computer, or graph paper, along with a worksheet of simple functions and inequalities, the student needs to graph 18 out of 20 functions/inequalities correctly. 3) Given a worksheet on solving one-step inequalities, student needs to obtain a 90% or higher through using their knowledge of the properties for inequalities..")
6
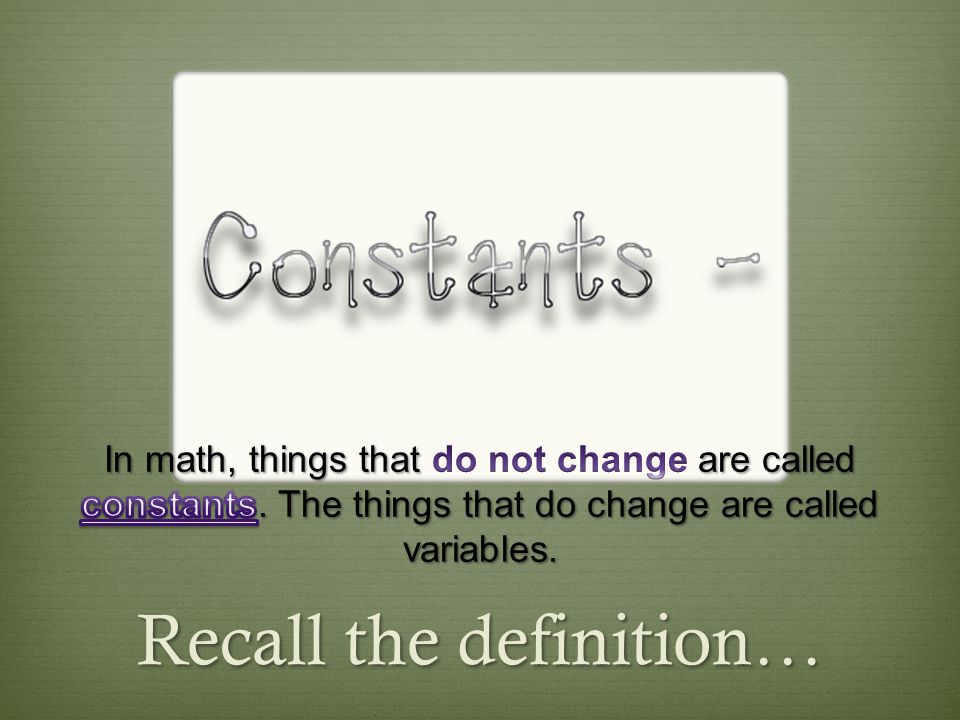
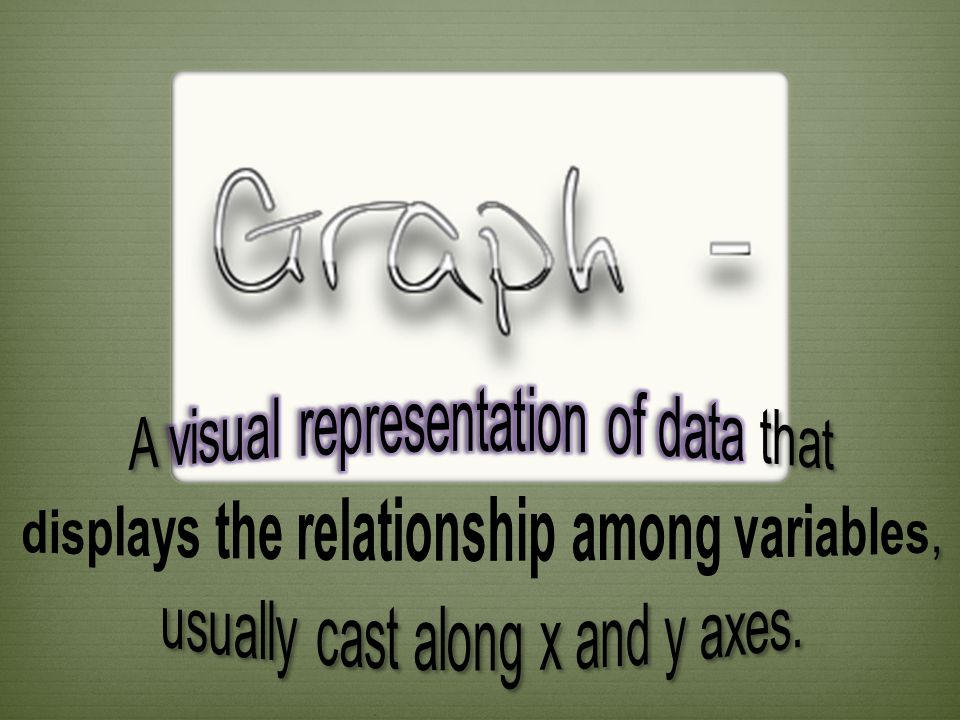
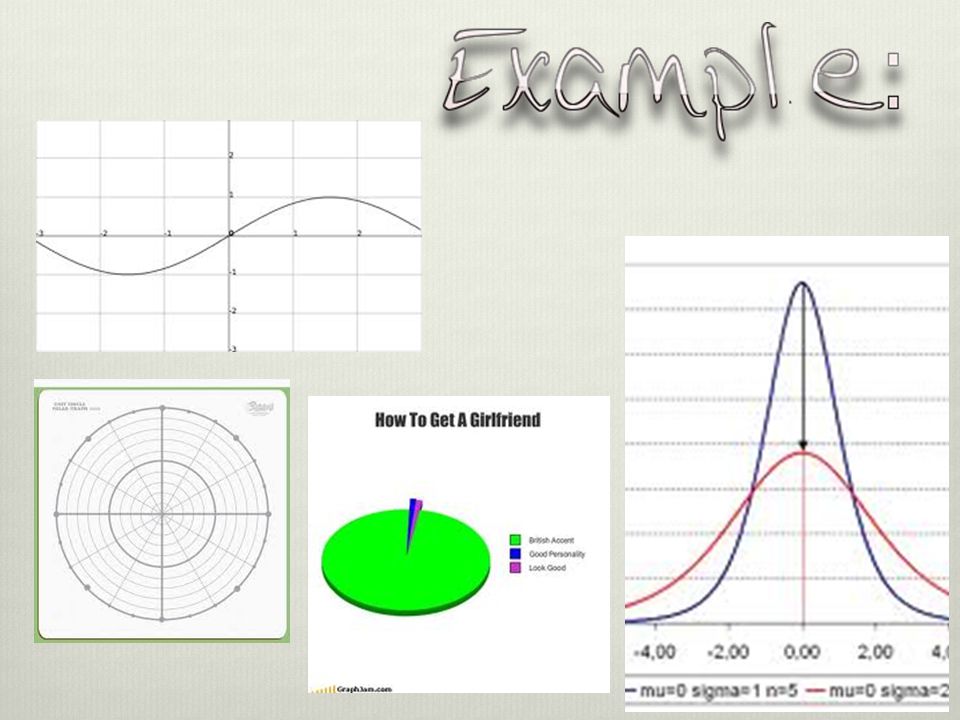
Recall the definition…

9
New Vocabulary: Copy these definitions down into your notebooks

15
Oh yes!!

18
Vertical Line Test Function ✔ NOT a function ✗

19
Which graphs are functions?

20
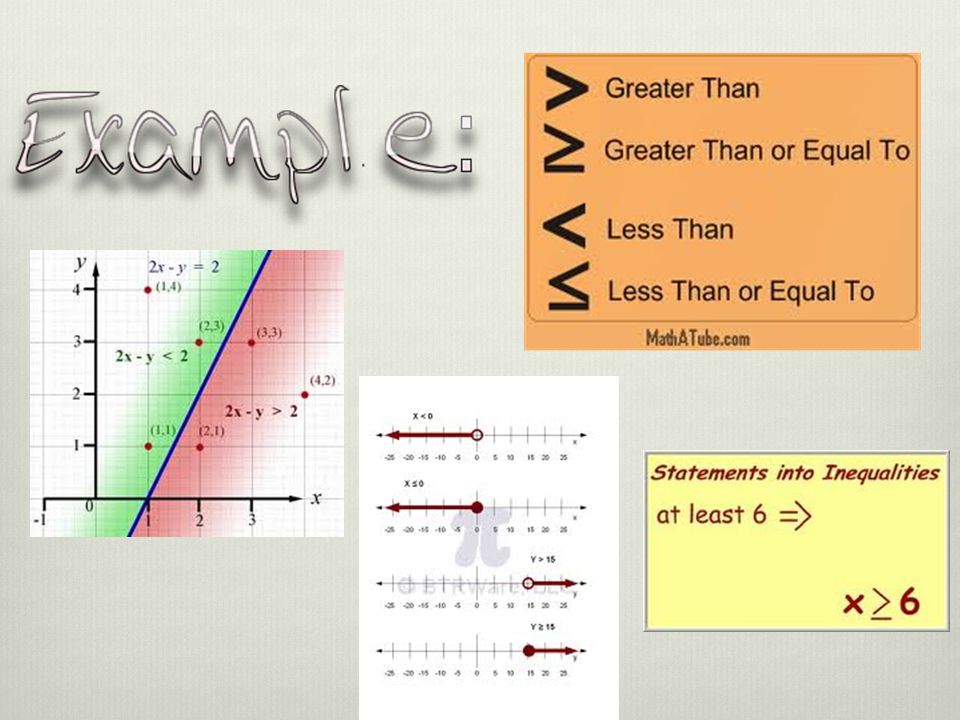
Simple Graphs of Inequalities Closed circle – Also equal to. ≥ or ≤ Open circle – NOT equal to. > or <

21
What do we notice about this inequality graph?

22
Your turn!

23
Answers

24
Your turn! Graph the inequalities: x 0

25
Answers

26
Notice how these two are the same!!

27
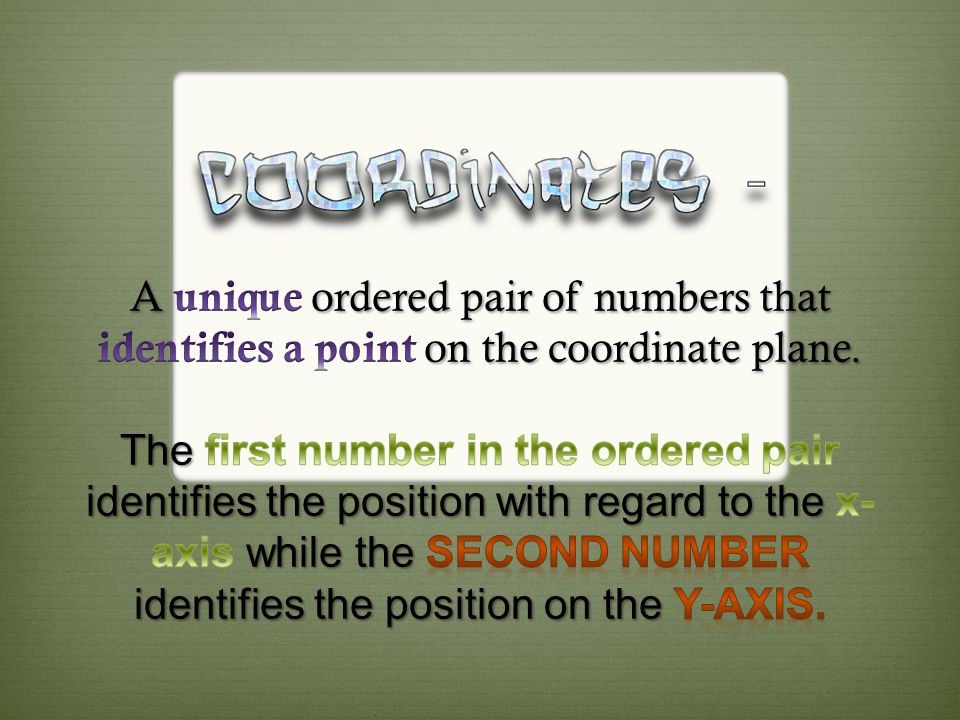
Plotting Coordinates (x, y)
")
28
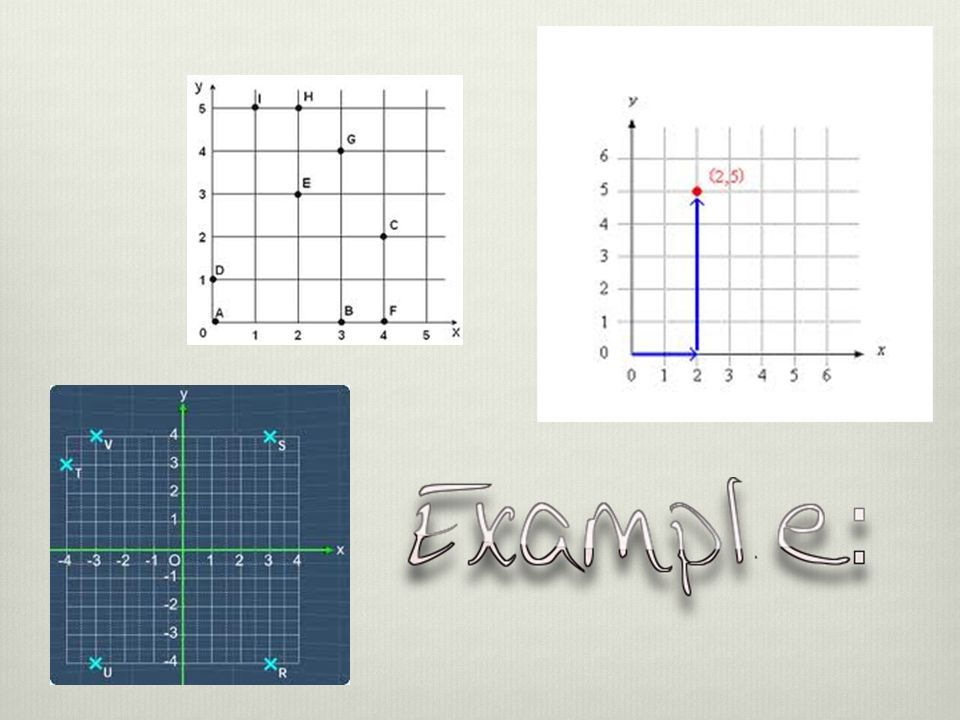
Identify these points on the graph – (-6,-8), (-8,-4), (4,6), (7,-8), (5,-3), (5,-6)
, (-8,-4), (4,6), (7,-8), (5,-3), (5,-6)")
29
Now using the internet! Simple Plot Simple Plot Plot the coordinates of at least 10 points. Use the (x,y) format that was discussed.
 format that was discussed..")
30
Simple Coordinates Game Simple Coordinates Game Find the x and y value for which the house is located on the coordinate plane!! Correctly identify the location of the house at least ten times.

31
Maze Game Maze Game

32
Graphing Linear Equations y = mx + b

33
Start with the constant also known as “b” y = (3/2)x – 1
x – 1")
34
Then, use the “m” to plot the slope. RISERISE over RUN y = (3/2)x – 1
x – 1")
35
Finally, connect the dots! y = (3/2)x – 1
x – 1")
36
Now you have your linear graph! y = (3/2)x – 1
x – 1")
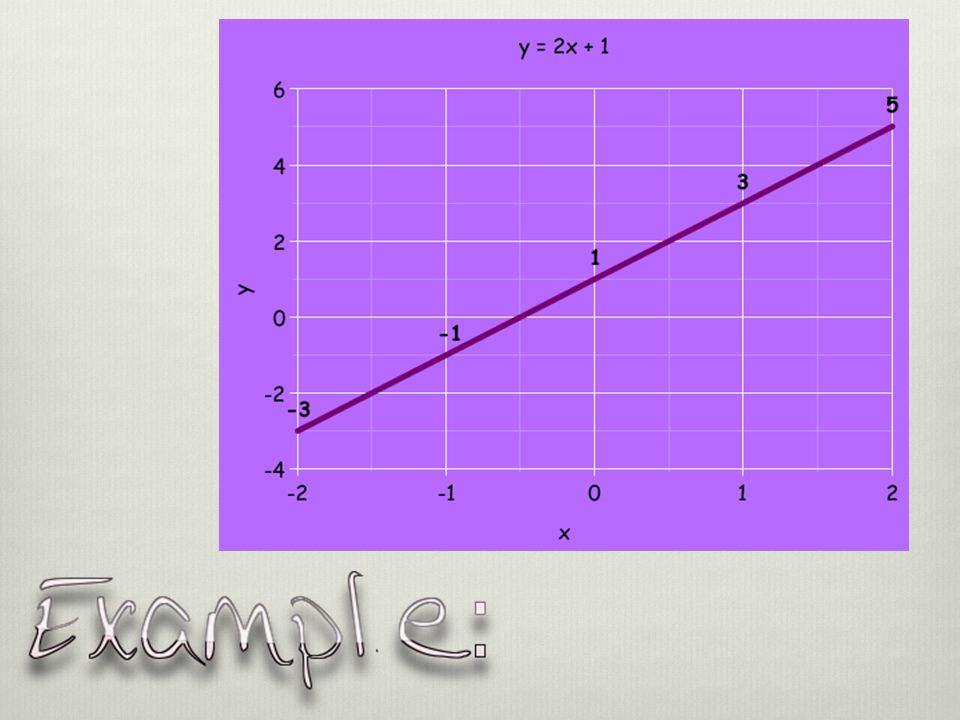
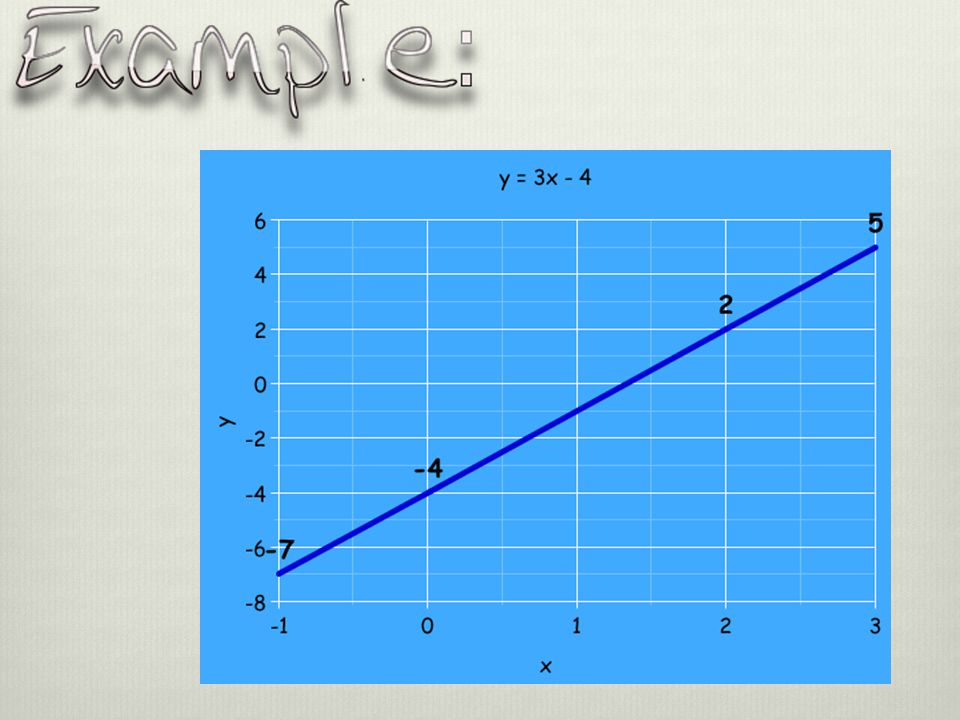
41
Your turn! Graph: 1. y = 2x + 6 2. y = x 3. y = 4x - 5 4. y = 3x

42
y = 2x + 6

43
y = x

44
y = 4x - 5

45
y = 3x

46
Now using the computer!

47
Graph Sketcher Graph Sketcher & Graphit Graphit Both of these interactive links are just like a graphing calculator. You put in a function (input) and the computer will generate a graph of the input (giving an output).
 and the computer will generate a graph of the input (giving an output)..")
48
Slope What does this do to our graph?

49
Slope Slider Slope Slider Play with the different elements of the slope in this activity. See how changing different elements of an equation will affect the slope of the linear (line) function.
 function..")
50
Slope m = 1/3 vs. m = 3 m = 1/3m = 3

51
Which equations have the steepest slope? Graph them if you need. y = (3/5)x – 3 y = 5x – 5 y = (1/2)x + 4 y = (4/3)x + 2 y = x – 1
x – 3 y = 5x – 5 y = (1/2)x + 4 y = (4/3)x + 2 y = x – 1.")
52
In order of most steep… 1. y = 5x - 5 2. y = (4/3)x + 2 4. y = (3/5)x – 3 3. y = x - 1 5. y = (1/2)x + 4
x – 3 3. y = x y = (1/2)x + 4.")
53
VocabInequalities Plotting Coordinates Graphing Linear Equations Slope

55
References http://www.shodor.org/interactivate/activities http://www.shodor.org/interactivate/activities http://www.diagram.ly/ http://www.diagram.ly/ http://www.kutasoftware.com/free.html http://www.kutasoftware.com/free.html http://cooltext.com http://cooltext.com http://nces.ed.gov/nceskids/createagraph/ http://nces.ed.gov/nceskids/createagraph/

Similar presentations


 Find the slope of the line given (2, 3) and (-3, -2). 2) Write the equation y – 5.>")


