Download presentation
Presentation is loading. Please wait.

1
OPUS Projects Manager Training Step 4 : Network Adjustment ngs.opus.projects@noaa.gov 2013-08-071Step 4 : Network Adjustment

2
I’ve advanced to the second slide and I’m reading it. Can you read this slide and hear me as I read it? Can you access the web? Is everyone comfortable? Does anyone have any questions before we begin? 2013-05-162Introduction

3
Outline Introduction Step 1 : Creating a Project Step 2 : Uploading Data Step 3 : Session Processing Step 4 : Network Adjustment 2013-08-073Step 4 : Network Adjustment

4
A few words before beginning. OPUS Projects is a web-based utility implying that access to the internet and use of a web browser are required. JavaScript must be enabled in your browser and pop-up blocking may have to be turned off. If you have difficulty configuring your browser, contact your instructor or the OPUS Projects team. 2013-08-074Step 4 : Network Adjustment

5
The OPUS Projects look and feel. The overall layout and appearance of OPUS Projects will be very similar to that shown here regardless of the browser you use. For this reason, the browser window’s frame is not shown in the figures. 2013-08-075Step 4 : Network Adjustment

6
What’s in this training? This presentation begins after all session processing has been completed and describes how to perform a network adjustment. The format is as a series of steps like a cookbook. Like most cookbooks, the justification for and discussion of variations in those steps will be minimal. The intent is to get you started quickly, then leave you free to explore OPUS Projects on your own. 2013-08-076Step 4 : Network Adjustment

7
The project ID and manager keyword are required to access the manager’s page from the OPUS Projects gateway page: http://geodesy.noaa.gov/OPUS-Projects/. 2013-08-077Step 4 : Network Adjustment

8
2013-08-078Step 4 : Network Adjustment The project is always scanned for changes when accessed so the information will be up-to-date.

9
2013-08-07Step 4 : Network Adjustment9

10
2013-08-07Step 4 : Network Adjustment10 In a few moments, the manager’s page appears. It looks different now that the data have been uploaded and session processing completed, so lets explore this page.

11
2013-08-07Step 4 : Network Adjustment11 The page is built around a Google Map Services™ interactive map showing the locations of your project’s marks and CORS.

12
2013-08-07Step 4 : Network Adjustment12 Here again, you can use the controls on the map to zoom in (+) or out (-) …
 or out (-) …")
13
2013-08-07Step 4 : Network Adjustment13 … center and zoom to show the project’s marks in this session …

14
2013-08-07Step 4 : Network Adjustment14 … or center and zoom to show the marks and included CORS.

15
2013-08-07Step 4 : Network Adjustment15 You can set the map’s background to look like a digital elevation terrain rendering with towns and roads indicated …

16
2013-08-07Step 4 : Network Adjustment16 … satellite imagery (if available) …
 …")
17
2013-08-07Step 4 : Network Adjustment17 … or a simple map.

18
2013-08-07Step 4 : Network Adjustment18 You can “drag” the map if you’d like examine a nearby area.

19
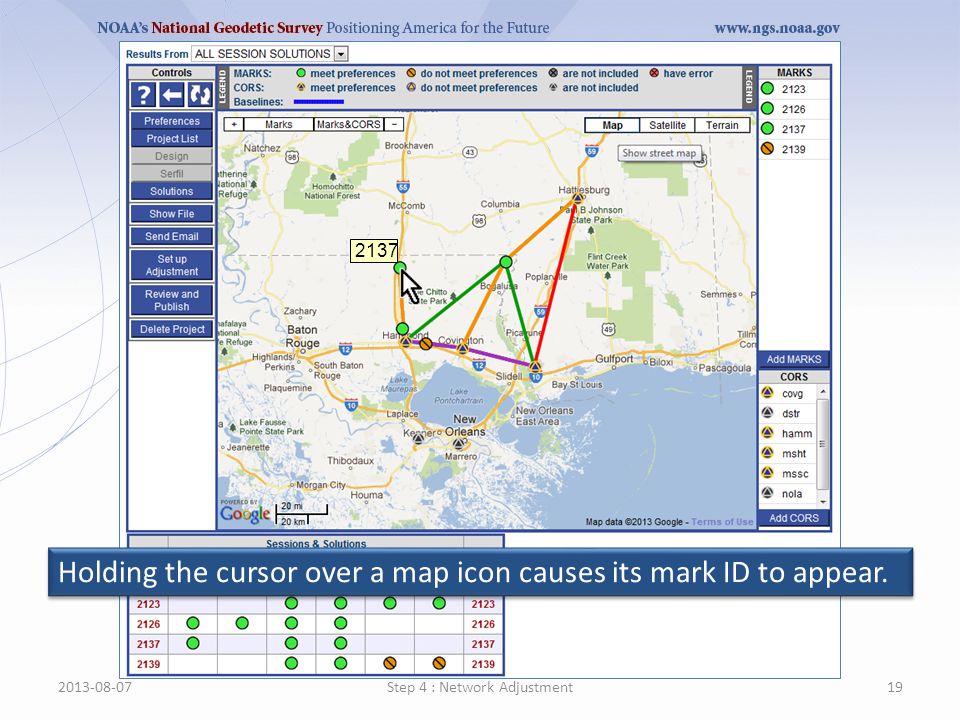
2013-08-07Step 4 : Network Adjustment19 Holding the cursor over a map icon causes its mark ID to appear. 2137
20
2013-08-07Step 4 : Network Adjustment20 Clicking on a map icon will cause information about the data files for that mark to be shown in a “bubble.”

21
2013-08-07Step 4 : Network Adjustment21 In this bubble, the mark’s ID is a convenience link to navigate to the summary page for that mark …

22
2013-08-07Step 4 : Network Adjustment22 … and the observers names are convenience links to send an email.

23
The brightly colored lines on the map represent baselines used in the processing. Note that the processing solutions are associated with line colors in the table below the map. 2013-08-07Step 4 : Network Adjustment23

24
In the case of session solutions, moving the cursor over the label in the table causes only those baselines to be shown. 2013-08-07Step 4 : Network Adjustment24

25
2013-08-07Step 4 : Network Adjustment25

26
2013-08-07Step 4 : Network Adjustment26 To the right of the map is a list of the marks in the project.

27
2013-08-07Step 4 : Network Adjustment27 Note that mark 2139 has not met all the solution quality threshold preferences in session 2006-277-A.

28
2013-08-07Step 4 : Network Adjustment28 Although difficult to show here, moving the cursor over a mark or CORS ID causes the corresponding map icon to “lighten.”

29
2013-08-07Step 4 : Network Adjustment29 Clicking on a list entry also causes that mark’s information bubble to appear on the map.

30
2013-08-07Step 4 : Network Adjustment30 The “Add MARKS” button acts as a link to the OPUS upload page.

31
2013-08-07Step 4 : Network Adjustment31 Below that is a list of the CORS included in this project. Note that DSTR and NOLA were not included in any session processing.

32
2013-08-07Step 4 : Network Adjustment32 At the bottom-right is the “Add CORS” button. Clicking that opens a window with controls to add other CORS to the project.

33
2013-08-07Step 4 : Network Adjustment33 Let’s take a moment to explore this new window.

34
2013-08-07Step 4 : Network Adjustment34 The map in this window is similar to the map on the primary page: you can zoom in and out, drag the map to other areas …

35
2013-08-07Step 4 : Network Adjustment35 … you can move the cursor over a map icon to see the mark’s ID or click on it for more information.

36
2013-08-07Step 4 : Network Adjustment36 To add a CORS to all sessions in the project, click the “Add to List” button in its information bubble or type its four character ID into the “To Be Added” box on the left.

37
2013-08-07Step 4 : Network Adjustment37 When the list of CORS to be added is complete, click the “Add CORS” button on the control bar near the top of the window to begin the process. In this example, we’ll just close the window.

38
2013-08-07Step 4 : Network Adjustment38 The pull-down menu at the top of the page identifies the type of results shown on this page: ALL SESSION SOLUTIONS in this case.

39
2013-08-07Step 4 : Network Adjustment39 You can use this menu to display individual session results, the OPUS results and, eventually, individual network adjustments.

40
2013-08-07Step 4 : Network Adjustment40 The controls for this page are to the left of the map.

41
2013-08-07Step 4 : Network Adjustment41 At the top are help, back and refresh controls.

42
2013-08-07Step 4 : Network Adjustment42 The preference controls were explored in Step 1 : Creating a Project.

43
2013-08-07Step 4 : Network Adjustment43 But notice that the “Session Definition” and Mark Co-location Definition” cannot be altered now because some project processing has been completed. The text in those sections explains this circumstance.

44
2013-08-07Step 4 : Network Adjustment44 The button will email a list of all your projects to you. Inactive on BETA version

45
2013-08-07Step 4 : Network Adjustment45 The next two buttons are disabled placeholders for pending enhancements.

46
2013-08-07Step 4 : Network Adjustment46 The Solutions button displays the solution controls. Here, you can rename or solutions in this project. Inactive on BETA version

47
2013-08-07Step 4 : Network Adjustment47 “Show File” displays one of the processing reports in a separate window. The controls were explained in Step 3 : Session Processing.

48
2013-08-07Step 4 : Network Adjustment48 “Send Email” opens a limited capability email tool in a separate window. Its controls were also explained in Step 3 : Session Processing.

49
2013-08-07Step 4 : Network Adjustment49 We’ll come back to “Set up Adjustment” after we finish exploring this page.

50
2013-08-07Step 4 : Network Adjustment50 “Review and Publish” is deprecated and will be removed in the near future.

51
2013-08-07Step 4 : Network Adjustment51 Jumping to the last button, “Delete Project” sends a request to delete this project to the OPUS Project Team.

52
2013-08-07Step 4 : Network Adjustment52 Confirmation before deleting a project is required so don’t worry about accidents. The steps are explained during this process.

53
2013-08-07Step 4 : Network Adjustment53 The table at the bottom of the page is a terse summary of the project sessions, solutions and marks.

54
2013-08-07Step 4 : Network Adjustment54 The column headers across the top of the table name all the sessions, session solutions and network adjustments (no network adjustments exist yet). Session solutions and network adjustments show a baseline indicator below; sessions that haven’t been processed do not. Session and session solution headers are convenience links to take you to that session’s page.

55
2013-08-07Step 4 : Network Adjustment55 The row headers list all the project’s marks and are convenience links to take you to that mark’s page.

56
2013-08-07Step 4 : Network Adjustment56 A mark’s inclusion in a session or solution is indicated by the icons in the table. The specific icon used depends upon its solution results.

57
2013-08-07Step 4 : Network Adjustment57 Let’s use this table to investigate the possible problem with 2139 in session 2006-277-A. First, let’s go to the 2006-277-A page.

58
2013-08-07Step 4 : Network Adjustment58 In a few moments, longer for larger projects, the 2006-277-A session page replaces the manager’s page.

59
2013-08-07Step 4 : Network Adjustment59 We can quickly see that the percentage of observations included in this session solution from the 2139 data file is slightly below our preferred threshold. The other solution quality control values are acceptable (although the post-fit residual RMS is near its maximum based upon our preferences).
..")
60
2013-08-07Step 4 : Network Adjustment60 Let’s continue this investigation by going to 2139’s page. Remember that we can do that by clicking on the row header.

61
2013-08-07Step 4 : Network Adjustment61 In a few more moments, the 2139 summary page replaces the session page. We’ve visited a mark’s page before, but let’s explore in more detail while we continue our investigation.

62
2013-08-07Step 4 : Network Adjustment62 Recall that the description and occupation forms appear as simple tables and cannot be modified if you are not the project manager.

63
2013-08-07Step 4 : Network Adjustment63 At the top of the page is a Google Map Services™ interactive map showing this mark and its immediate vicinity. Similar to but more capable than the other maps; classes of icons can be turned on/off and clicking on a published mark’s icon displays its datasheet. The mark’s name in the legend at the top of the map is a pull-down menu to navigate to other mark web pages.

64
2013-08-07Step 4 : Network Adjustment64 To the left of the map are general controls for this page. The six to the top should be familiar by this time, but the rest are specific to this web page.

65
2013-08-07Step 4 : Network Adjustment65 “Change MARK ID” enables you to change the mark’s ID, 2139 in this case, to another four character string.

66
2013-08-0766 “Remove Mark” irrevocably removes this mark and its data from this project after confirming the instruction to do so.

67
2013-08-07Step 4 : Network Adjustment67 The “Verify For Publication” control is deprecated and will be removed in the near future.

68
2013-08-07Step 4 : Network Adjustment68 The Datasheet Mock-up should look familiar. Remember, only the project manager can make changes. Empty optional fields are shaded yellow; empty required fields would be shaded red.

69
2013-08-07Step 4 : Network Adjustment69 In addition to controls specific to this section on the right, the label for this section includes another pull-down menu to navigate to other mark web pages.

70
2013-08-07Step 4 : Network Adjustment70 The Occupations table lists information about the data files for this mark. Note that the antenna serial number and receiver information are not required and often left blank. However, this information is captured in bluebooking and, so, may be necessary for your project.

71
2013-08-07Step 4 : Network Adjustment71 Scrolling down, we see the solution results for this mark.

72
2013-08-07Step 4 : Network Adjustment72 The label for this section includes another pull-down menu to navigate to other mark web pages, a solution selection control, and, on the right, a button to display a form controlling the a priori coordinates and preferences specifically for this mark.

73
2013-08-07Step 4 : Network Adjustment73 Let’s change to the session 2006-277-A results to confirm our findings from that session’s page.

74
2013-08-07Step 4 : Network Adjustment74 Continuing to scroll down the page, we’ll find the solution results plots.

75
2013-08-07Step 4 : Network Adjustment75 Like all the sections on this web page, the section label contains a pull-down menu to navigate to other mark web pages and controls specific to this section.

76
2013-08-07Step 4 : Network Adjustment76 Examining the plots, the 2006-277-A results for this mark do not look abnormal.

77
2013-08-07Step 4 : Network Adjustment77 Considering that the flagged values just exceed thresholds and the coordinates results agree well, there is no strong reason to omit mark 2139 from this session.

78
2013-08-07Step 4 : Network Adjustment78 Although not demanded by the results and, therefore, a dubious decision, a suggested exercise is to create an alternate solution for session 2006-277-A in which 2139 is excluded. Then you can continue to evaluate the effects of this data file on the session solution and forthcoming network adjustment.

79
2013-08-07Step 4 : Network Adjustment79 We’ll accept 2139 “as is” and return to the manager’s page.

80
2013-08-07Step 4 : Network Adjustment80 You may need to refresh the manager’s page if you used the “Back” rather than the “Manager’s Page” button.

81
2013-08-07Step 4 : Network Adjustment81 Next, let’s set up and perform a network adjustment. Start by clicking the “Set up Adjustment” control button.

82
2013-08-07Step 4 : Network Adjustment82 Before beginning a network adjustment, the session processing results for all marks should be examined. We’ll leave that as another exercise.

83
2013-08-07Step 4 : Network Adjustment83 There are many similarities between the network adjustment and session processing controls. As we did then, let’s focus on these controls but keep a small copy of the map.

84
2013-08-07Step 4 : Network Adjustment84 First, note that no marks are listed and all the baselines have been removed from the map. They will be replaced as session solutions are included in the adjustment.

85
2013-08-07Step 4 : Network Adjustment85 An adjustment can have a name. Usually, it will be something like “final”, but other names can help organize testing.

86
2013-08-07Step 4 : Network Adjustment86 All completed session solutions are listed. At least one must be included. Only one solution from a session should be included if alternates exist.

87
2013-08-07Step 4 : Network Adjustment87 As you start to include session solutions for your adjustment, the marks included in those sessions solutions will be listed and the baselines shown.

88
2013-08-07Step 4 : Network Adjustment88 The table of marks in the adjustment look very similar to that used in a session solution; however, there are differences.

89
2013-08-07Step 4 : Network Adjustment89 The included marks and network design are set in the sessions. They cannot be changed in the adjustment.

90
2013-08-07Step 4 : Network Adjustment90 A network adjustment uses the solution matrices before any constraints are applied as its data sources.

91
2013-08-07Step 4 : Network Adjustment91 Constraints are still NONE, HOR-ONLY, VER-ONLY or 3-D.

92
2013-08-07Step 4 : Network Adjustment92 The constrained coordinates can still be changed, and can be different from those used in the session solutions. The constrained coordinates can still be changed, and can be different from those used in the session solutions.

93
2013-08-07Step 4 : Network Adjustment93 The height components can still be constrained to either the ellipsoid or orthometric height.

94
2013-08-07Step 4 : Network Adjustment94 All processing remains in the ITRF, but an alternate reference frame can be selected. If possible, the ITRF coordinates will be transformed into the output frame and reported, …

95
2013-08-07Step 4 : Network Adjustment95 … the geoid or hybrid-geoid model used to compute the orthometric heights given in the reports can be specified …

96
2013-08-07Step 4 : Network Adjustment96 … and the constraint weight selected: LOOSE ≈ 1 m, NORMAL ≈ 1 cm, TIGHT≈ 0.1 mm.

97
2013-08-07Step 4 : Network Adjustment97 When the selections are complete, click the “Perform Adjustment” button in the control bar at the top of the window.

98
2013-08-07Step 4 : Network Adjustment98 At that time, the selections are checked, inserted in the processing queue and a printable summary is created. The adjustment rarely takes more than a few minutes once it reaches the top of the queue.

99
NGS OPUS-PROJECTS NETWORK ADJUSTMENT REPORT =========================================== All coordinate accuracies reported here are 1 times the formal uncertainties from the solution. For additional information: dev.ngs.noaa.gov/OPUS/Using_OPUS-Projects.html#accuracy These positions were computed without any knowledge by the National Geodetic Survey regarding the equipment or field operating procedures used. SUBMITTED BY: mark.schenewerk SOLUTION FILE NAME: network-final.sum SOLUTION SOFTWARE: GPSCOM(1210.24) SOLUTION DATE: 2013-05-21T09:13:11 UTC STANDARD ERROR OF UNIT WEIGHT: 0.773 TOTAL NUMBER OF OBSERVATIONS: 224036 TOTAL NUMBER OF MARKS: 8 NUMBER OF CONSTRAINED MARKS: 4 START TIME: 2006-10-01T00:00:00 GPS STOP TIME: 2006-10-04T23:59:30 GPS FREQUENCY: L1-ONLY TO ION-FREE [BY BASELINE LENGTH] OBSERVATION INTERVAL: 30 s ELEVATION CUTOFF: 15 deg TROPO INTERVAL: 7200 s [PIECE-WISE LINEAR PARAMETERIZATION] DD CORRELATIONS: ON INCLUDED SOLUTION RMS SOFTWARE RUN DATE ------------------------------------------------------------------------------ 1) 2006-274 A 1.2 cm page5(1301.08) 2013-08-07T12:40 UTC 2) 2006-275 A 1.1 cm page5(1301.08) 2013-08-07T14:51 UTC 3) 2006-275 B 1.5 cm page5(1301.08) 2013-08-07T14:52 UTC 4) 2006-276 A 1.6 cm page5(1301.08) 2013-08-07T14:54 UTC 5) 2006-276 B 1.9 cm page5(1301.08) 2013-08-07T14:56 UTC 6) 2006-277 A 1.7 cm page5(1301.08) 2013-08-07T14:57 UTC your.name@your.address 2013-08-07Step 4 : Network Adjustment99 When the adjustment is completed, an email is sent. The email contains a summary of the results and has full reports attached.
 SOLUTION DATE: T09:13:11 UTC STANDARD ERROR OF UNIT WEIGHT: TOTAL NUMBER OF OBSERVATIONS: TOTAL NUMBER OF MARKS: 8 NUMBER OF CONSTRAINED MARKS: 4 START TIME: T00:00:00 GPS STOP TIME: T23:59:30 GPS FREQUENCY: L1-ONLY TO ION-FREE [BY BASELINE LENGTH] OBSERVATION INTERVAL: 30 s ELEVATION CUTOFF: 15 deg TROPO INTERVAL: 7200 s [PIECE-WISE LINEAR PARAMETERIZATION] DD CORRELATIONS: ON INCLUDED SOLUTION RMS SOFTWARE RUN DATE ) A 1.2 cm page5( ) T12:40 UTC 2) A 1.1 cm page5( ) T14:51 UTC 3) B 1.5 cm page5( ) T14:52 UTC 4) A 1.6 cm page5( ) T14:54 UTC 5) B 1.9 cm page5( ) T14:56 UTC 6) A 1.7 cm page5( ) T14:57 UTC Step 4 : Network Adjustment99 When the adjustment is completed, an is sent. The contains a summary of the results and has full reports attached..")
100
NGS OPUS-PROJECTS NETWORK ADJUSTMENT REPORT =========================================== All coordinate accuracies reported here are 1 times the formal uncertainties from the solution. For additional information: dev.ngs.noaa.gov/OPUS/Using_OPUS-Projects.html#accuracy These positions were computed without any knowledge by the National Geodetic Survey regarding the equipment or field operating procedures used. SUBMITTED BY: mark.schenewerk SOLUTION FILE NAME: network-final.sum SOLUTION SOFTWARE: GPSCOM(1210.24) SOLUTION DATE: 2013-05-21T09:13:11 UTC STANDARD ERROR OF UNIT WEIGHT: 0.773 TOTAL NUMBER OF OBSERVATIONS: 224036 TOTAL NUMBER OF MARKS: 8 NUMBER OF CONSTRAINED MARKS: 4 START TIME: 2006-10-01T00:00:00 GPS STOP TIME: 2006-10-04T23:59:30 GPS FREQUENCY: L1-ONLY TO ION-FREE [BY BASELINE LENGTH] OBSERVATION INTERVAL: 30 s ELEVATION CUTOFF: 15 deg TROPO INTERVAL: 7200 s [PIECE-WISE LINEAR PARAMETERIZATION] DD CORRELATIONS: ON INCLUDED SOLUTION RMS SOFTWARE RUN DATE ------------------------------------------------------------------------------ 1) 2006-274 A 1.2 cm page5(1301.08) 2013-08-07T12:40 UTC 2) 2006-275 A 1.1 cm page5(1301.08) 2013-08-07T14:51 UTC 3) 2006-275 B 1.5 cm page5(1301.08) 2013-08-07T14:52 UTC 4) 2006-276 A 1.6 cm page5(1301.08) 2013-08-07T14:54 UTC 5) 2006-276 B 1.9 cm page5(1301.08) 2013-08-07T14:56 UTC 6) 2006-277 A 1.7 cm page5(1301.08) 2013-08-07T14:57 UTC your.name@your.address 2013-08-07Step 4 : Network Adjustment100 Evaluating network adjustments is very similar to evaluation session solutions.
 SOLUTION DATE: T09:13:11 UTC STANDARD ERROR OF UNIT WEIGHT: TOTAL NUMBER OF OBSERVATIONS: TOTAL NUMBER OF MARKS: 8 NUMBER OF CONSTRAINED MARKS: 4 START TIME: T00:00:00 GPS STOP TIME: T23:59:30 GPS FREQUENCY: L1-ONLY TO ION-FREE [BY BASELINE LENGTH] OBSERVATION INTERVAL: 30 s ELEVATION CUTOFF: 15 deg TROPO INTERVAL: 7200 s [PIECE-WISE LINEAR PARAMETERIZATION] DD CORRELATIONS: ON INCLUDED SOLUTION RMS SOFTWARE RUN DATE ) A 1.2 cm page5( ) T12:40 UTC 2) A 1.1 cm page5( ) T14:51 UTC 3) B 1.5 cm page5( ) T14:52 UTC 4) A 1.6 cm page5( ) T14:54 UTC 5) B 1.9 cm page5( ) T14:56 UTC 6) A 1.7 cm page5( ) T14:57 UTC Step 4 : Network Adjustment100 Evaluating network adjustments is very similar to evaluation session solutions..")
101
NGS OPUS-PROJECTS NETWORK ADJUSTMENT REPORT =========================================== All coordinate accuracies reported here are 1 times the formal uncertainties from the solution. For additional information: dev.ngs.noaa.gov/OPUS/Using_OPUS-Projects.html#accuracy These positions were computed without any knowledge by the National Geodetic Survey regarding the equipment or field operating procedures used. SUBMITTED BY: mark.schenewerk SOLUTION FILE NAME: network-final.sum SOLUTION SOFTWARE: GPSCOM(1210.24) SOLUTION DATE: 2013-05-21T09:13:11 UTC STANDARD ERROR OF UNIT WEIGHT: 0.773 TOTAL NUMBER OF OBSERVATIONS: 224036 TOTAL NUMBER OF MARKS: 8 NUMBER OF CONSTRAINED MARKS: 4 START TIME: 2006-10-01T00:00:00 GPS STOP TIME: 2006-10-04T23:59:30 GPS FREQUENCY: L1-ONLY TO ION-FREE [BY BASELINE LENGTH] OBSERVATION INTERVAL: 30 s ELEVATION CUTOFF: 15 deg TROPO INTERVAL: 7200 s [PIECE-WISE LINEAR PARAMETERIZATION] DD CORRELATIONS: ON INCLUDED SOLUTION RMS SOFTWARE RUN DATE ------------------------------------------------------------------------------ 1) 2006-274 A 1.2 cm page5(1301.08) 2013-08-07T12:40 UTC 2) 2006-275 A 1.1 cm page5(1301.08) 2013-08-07T14:51 UTC 3) 2006-275 B 1.5 cm page5(1301.08) 2013-08-07T14:52 UTC 4) 2006-276 A 1.6 cm page5(1301.08) 2013-08-07T14:54 UTC 5) 2006-276 B 1.9 cm page5(1301.08) 2013-08-07T14:56 UTC 6) 2006-277 A 1.7 cm page5(1301.08) 2013-08-07T14:57 UTC your.name@your.address 2013-08-07Step 4 : Network Adjustment101 First, verify the information you entered. 1) 2006-274 A 1.2 cm page5(1301.08) 2013-08-07T12:40 UTC 2) 2006-275 A 1.1 cm page5(1301.08) 2013-08-07T14:51 UTC 3) 2006-275 B 1.5 cm page5(1301.08) 2013-08-07T14:52 UTC 4) 2006-276 A 1.6 cm page5(1301.08) 2013-08-07T14:54 UTC 5) 2006-276 B 1.9 cm page5(1301.08) 2013-08-07T14:56 UTC 6) 2006-277 A 1.7 cm page5(1301.08) 2013-08-07T14:57 UTC your.name@your.address
 SOLUTION DATE: T09:13:11 UTC STANDARD ERROR OF UNIT WEIGHT: TOTAL NUMBER OF OBSERVATIONS: TOTAL NUMBER OF MARKS: 8 NUMBER OF CONSTRAINED MARKS: 4 START TIME: T00:00:00 GPS STOP TIME: T23:59:30 GPS FREQUENCY: L1-ONLY TO ION-FREE [BY BASELINE LENGTH] OBSERVATION INTERVAL: 30 s ELEVATION CUTOFF: 15 deg TROPO INTERVAL: 7200 s [PIECE-WISE LINEAR PARAMETERIZATION] DD CORRELATIONS: ON INCLUDED SOLUTION RMS SOFTWARE RUN DATE ) A 1.2 cm page5( ) T12:40 UTC 2) A 1.1 cm page5( ) T14:51 UTC 3) B 1.5 cm page5( ) T14:52 UTC 4) A 1.6 cm page5( ) T14:54 UTC 5) B 1.9 cm page5( ) T14:56 UTC 6) A 1.7 cm page5( ) T14:57 UTC Step 4 : Network Adjustment101 First, verify the information you entered. 1) A 1.2 cm page5( ) T12:40 UTC 2) A 1.1 cm page5( ) T14:51 UTC 3) B 1.5 cm page5( ) T14:52 UTC 4) A 1.6 cm page5( ) T14:54 UTC 5) B 1.9 cm page5( ) T14:56 UTC 6) A 1.7 cm page5( ) T14:57 UTC")
102
NGS OPUS-PROJECTS NETWORK ADJUSTMENT REPORT =========================================== All coordinate accuracies reported here are 1 times the formal uncertainties from the solution. For additional information: dev.ngs.noaa.gov/OPUS/Using_OPUS-Projects.html#accuracy These positions were computed without any knowledge by the National Geodetic Survey regarding the equipment or field operating procedures used. SUBMITTED BY: mark.schenewerk SOLUTION FILE NAME: network-final.sum SOLUTION SOFTWARE: GPSCOM(1210.24) SOLUTION DATE: 2013-05-21T09:13:11 UTC STANDARD ERROR OF UNIT WEIGHT: 0.773 TOTAL NUMBER OF OBSERVATIONS: 224036 TOTAL NUMBER OF MARKS: 8 NUMBER OF CONSTRAINED MARKS: 4 START TIME: 2006-10-01T00:00:00 GPS STOP TIME: 2006-10-04T23:59:30 GPS FREQUENCY: L1-ONLY TO ION-FREE [BY BASELINE LENGTH] OBSERVATION INTERVAL: 30 s ELEVATION CUTOFF: 15 deg TROPO INTERVAL: 7200 s [PIECE-WISE LINEAR PARAMETERIZATION] DD CORRELATIONS: ON INCLUDED SOLUTION RMS SOFTWARE RUN DATE ------------------------------------------------------------------------------ 1) 2006-274 A 1.2 cm page5(1301.08) 2013-08-07T12:40 UTC 2) 2006-275 A 1.1 cm page5(1301.08) 2013-08-07T14:51 UTC 3) 2006-275 B 1.5 cm page5(1301.08) 2013-08-07T14:52 UTC 4) 2006-276 A 1.6 cm page5(1301.08) 2013-08-07T14:54 UTC 5) 2006-276 B 1.9 cm page5(1301.08) 2013-08-07T14:56 UTC 6) 2006-277 A 1.7 cm page5(1301.08) 2013-08-07T14:57 UTC your.name@your.address 2013-08-07Step 4 : Network Adjustment102 Next, the general solution information. STANDARD ERROR OF UNIT WEIGHT: 0.773 TOTAL NUMBER OF OBSERVATIONS: 224036 TOTAL NUMBER OF MARKS: 8 NUMBER OF CONSTRAINED MARKS: 4 START TIME: 2006-10-01T00:00:00 GPS STOP TIME: 2006-10-04T23:59:30 GPS FREQUENCY: L1-ONLY TO ION-FREE [BY BASELINE LENGTH] OBSERVATION INTERVAL: 30 s ELEVATION CUTOFF: 15 deg TROPO INTERVAL: 7200 s [PIECE-WISE LINEAR PARAMETERIZATION] DD CORRELATIONS: ON your.name@your.address
 SOLUTION DATE: T09:13:11 UTC STANDARD ERROR OF UNIT WEIGHT: TOTAL NUMBER OF OBSERVATIONS: TOTAL NUMBER OF MARKS: 8 NUMBER OF CONSTRAINED MARKS: 4 START TIME: T00:00:00 GPS STOP TIME: T23:59:30 GPS FREQUENCY: L1-ONLY TO ION-FREE [BY BASELINE LENGTH] OBSERVATION INTERVAL: 30 s ELEVATION CUTOFF: 15 deg TROPO INTERVAL: 7200 s [PIECE-WISE LINEAR PARAMETERIZATION] DD CORRELATIONS: ON INCLUDED SOLUTION RMS SOFTWARE RUN DATE ) A 1.2 cm page5( ) T12:40 UTC 2) A 1.1 cm page5( ) T14:51 UTC 3) B 1.5 cm page5( ) T14:52 UTC 4) A 1.6 cm page5( ) T14:54 UTC 5) B 1.9 cm page5( ) T14:56 UTC 6) A 1.7 cm page5( ) T14:57 UTC Step 4 : Network Adjustment102 Next, the general solution information. STANDARD ERROR OF UNIT WEIGHT: TOTAL NUMBER OF OBSERVATIONS: TOTAL NUMBER OF MARKS: 8 NUMBER OF CONSTRAINED MARKS: 4 START TIME: T00:00:00 GPS STOP TIME: T23:59:30 GPS FREQUENCY: L1-ONLY TO ION-FREE [BY BASELINE LENGTH] OBSERVATION INTERVAL: 30 s ELEVATION CUTOFF: 15 deg TROPO INTERVAL: 7200 s [PIECE-WISE LINEAR PARAMETERIZATION] DD CORRELATIONS: ON")
103
hamm-2126 80.640 km 1.0 cm 2471 2.3% 100.0% 2 msht-mssc 108.867 km 1.9 cm 15604 5.2% 93.4% 5 +++++++++++++++++++++++++++++++++++++++++++++++++++++++++++++++++++++++++++++ UNCONSTRAINED MARKS +++++++++++++++++++++++++++++++++++++++++++++++++++++++++++++++++++++++++++++ MARK: 2123 (2123 1) REF FRAME: NAD_83(2011) (2010.0000) IGS08 (2006.7552) X: -46694.793 m 0.002 m -46695.473 m 0.002 m Y: -5495064.269 m 0.002 m -5495062.776 m 0.002 m Z: 3226832.869 m 0.003 m 3226832.701 m 0.003 m LAT: 30 35 23.59014 0.003 m 30 35 23.61003 0.003 m E LON: 269 30 47.28881 0.002 m 269 30 47.26283 0.002 m W LON: 90 29 12.71119 0.002 m 90 29 12.73717 0.002 m EL HGT: -7.427 m 0.002 m -8.793 m 0.002 m ORTHO HGT: 19.630 m 0.012 m (H = h - N WHERE N = GEOID12A HGT) UTM COORDINATES STATE PLANE COORDINATES UTM (Zone 15) SPC (1702 LA S) NORTHING (Y) 3386842.988 m 231955.819 m EASTING (X) 740977.315 m 1081182.819 m CONVERGENCE 1.27952553 deg 0.42324530 deg POINT SCALE 1.00031642 0.99997843 COMBINED FACTOR 1.00031759 0.99997960 US NATIONAL GRID DESIGNATOR: 15RYP4097786842 (NAD 83) +++++++++++++++++++++++++++++++++++++++++++++++++++++++++++++++++++++++++++++ MARK: 2126 (2126 1) REF FRAME: NAD_83(2011) (2010.0000) IGS08 (2006.7523) 2013-08-07Step 4 : Network Adjustment103 Finally, the individual mark results.
 REF FRAME: NAD_83(2011) ( ) IGS08 ( ) X: m m m m Y: m m m m Z: m m m m LAT: m m E LON: m m W LON: m m EL HGT: m m m m ORTHO HGT: m m (H = h - N WHERE N = GEOID12A HGT) UTM COORDINATES STATE PLANE COORDINATES UTM (Zone 15) SPC (1702 LA S) NORTHING (Y) m m EASTING (X) m m CONVERGENCE deg deg POINT SCALE COMBINED FACTOR US NATIONAL GRID DESIGNATOR: 15RYP (NAD 83) MARK: 2126 (2126 1) REF FRAME: NAD_83(2011) ( ) IGS08 ( ) Step 4 : Network Adjustment103 Finally, the individual mark results.")
104
2013-08-07Step 4 : Network Adjustment104 Returning to the manager’s page, the network adjustment is now available for review.

105
2013-08-07Step 4 : Network Adjustment105 And the network adjustment results now appear with the other solutions in the individual mark’s plots and tables.

106
2013-08-07Step 4 : Network Adjustment106 The last step is always to delete your project. You can keep your project on-line for as long as needed, but be courteous and “delete when complete.”

107
OPUS Projects Manager Training Step 4 : Network Adjustment Dr. Mark Schenewerk mark.schenewerk@noaa.gov 816-994-3067 2013-08-07107Step 4 : Network Adjustment

Similar presentations


. The Major Steps of a MicroSoft Access Database Tables Queries Forms Macros Reports Modules On our road.>")
 Community Based Abstinence Education September, 2009.>")


 follow the hyperlinks to navigate to the specified Topic or Figure.>")


