Download presentation
Presentation is loading. Please wait.

1
ANEMIA AND HEALTH-RELATED QUALITY OF LIFE MEASURES: PSYCHOMETRIC CHARACTERISTICS OF INSTRUMENTS Dennis A. Revicki, PhD Miriam Kimel, PhD Center for Health Outcomes Research, United BioSource Corporation, Bethesda, Maryland, USA Prepared for the KDIGO Controversies Conference: Coordination of Clinical Practice Guidelines for Anemia in CKD, New York, NY, October 15, 2007

2
OVERVIEW Why ask patients about their health status? Why ask patients about their health status? Development and psychometric evaluation of health status measures Development and psychometric evaluation of health status measures Summary of psychometric qualities of frequently used HRQL measures Summary of psychometric qualities of frequently used HRQL measures –Content coverage –Measurement qualities Future of HRQL measurement Future of HRQL measurement –NIH PROMIS initiative

3
WHY ASK PATIENTS ABOUT THEIR HEALTH STATUS? HRQL data describe the impact of treatment and disease on symptoms, functioning and well-being. HRQL data describe the impact of treatment and disease on symptoms, functioning and well-being. Patients provide a unique perspective on the impact of disease and treatment on their functioning and well-being Patients provide a unique perspective on the impact of disease and treatment on their functioning and well-being Physiologic, laboratory and clinician evaluations are associated with but not identical to HRQL measures Physiologic, laboratory and clinician evaluations are associated with but not identical to HRQL measures HRQL measures extend and translate clinical endpoints HRQL measures extend and translate clinical endpoints

4
KEY CONCEPTS AND ASSUMPTIONS Patient’s experience provides a unique and valuable contribution to understanding treatment effectiveness Patient’s experience provides a unique and valuable contribution to understanding treatment effectiveness Information provided by patient is inherently subjective Information provided by patient is inherently subjective Scientific methods for measuring subjective outcomes are well-developed and are foundation of HRQL assessment Scientific methods for measuring subjective outcomes are well-developed and are foundation of HRQL assessment Need scientifically adequate clinical trial designs and statistical analyses Need scientifically adequate clinical trial designs and statistical analyses

5
“Objective”“Subjective” Exercise test versus physical functioning, r = 0.40

6
HRQL VERSUS EFFICACY AND SAFETY HRQL is the ultimate outcome of health care interventions (implies survival) HRQL is the ultimate outcome of health care interventions (implies survival) No single outcome adequately represents results of treatment No single outcome adequately represents results of treatment HRQL assesses integrated effects of treatment HRQL assesses integrated effects of treatment
 HRQL is the ultimate outcome of health care interventions (implies survival) No single outcome adequately represents results of treatment No single outcome adequately represents results of treatment HRQL assesses integrated effects of treatment HRQL assesses integrated effects of treatment")
7
HRQL AND CHRONIC KIDNEY DISEASE CKD is associated with broad and meaningful impairment to HRQL outcomes CKD is associated with broad and meaningful impairment to HRQL outcomes HRQL measures predict mortality in CKD patients, even after adjustment for demographic and clinical variables HRQL measures predict mortality in CKD patients, even after adjustment for demographic and clinical variables Treatments for anemia have demonstrated impact on symptoms and functioning Treatments for anemia have demonstrated impact on symptoms and functioning

8
HEALTH STATUS IMPAIRED IN CKD PATIENTS

9
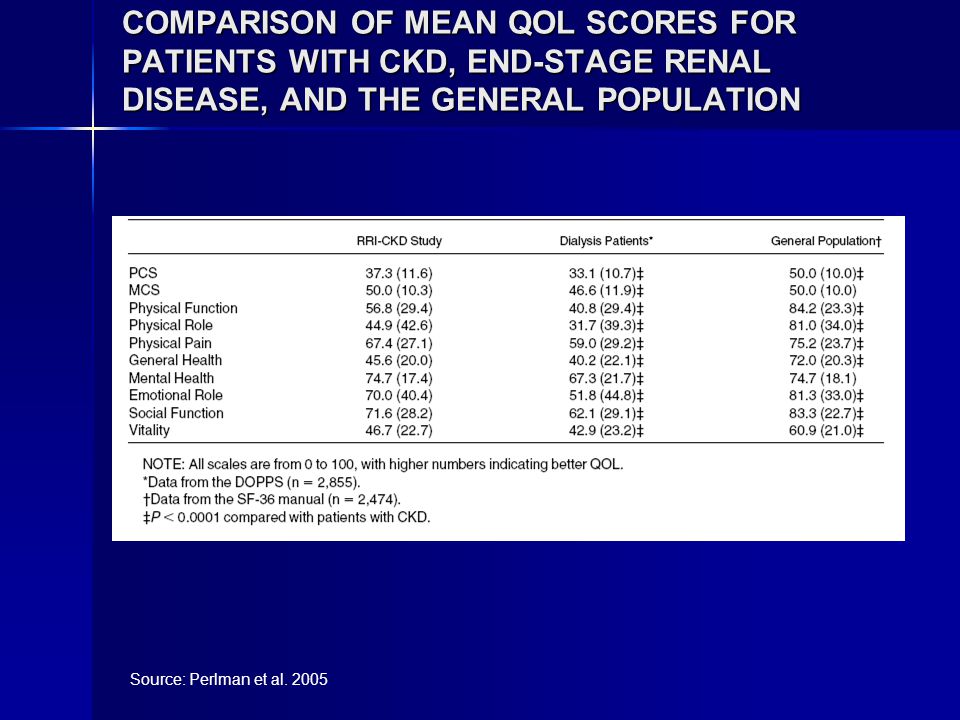
COMPARISON OF MEAN QOL SCORES FOR PATIENTS WITH CKD, END-STAGE RENAL DISEASE, AND THE GENERAL POPULATION Source: Perlman et al. 2005
10
SURVIVAL PROPORTIONAL HAZARDS MODEL* Covariate Sign of Coefficient Unit of Analysis Percent Survival Change Per Unit Change† 95% Confidence Interval for Percent Survival Change Per Unit P Value‡ Albumin- 0.1 g/dL +10.0 6.2 to 14 <0.0001 Age+ 1 yr -2.8 1.4 to 4.1 0.0002 nPCR- 0.1 g/kg/d +17.2 5.4 to 27 0.0053 PCS- 5 points +10.4 1.1 to 18 0.0226 Kt/V- 0.1 Kt/V +10.8 0.6 to 19 0.0373 Is diabetic +0.1739 Is not white -0.1773 Is male +0.4492 MCS- 5 points +1.4 -6.5 to 8.9 0.7280 * For the model, P < 0.0001 (Wald) † The percent change in the probability of survival per unit change of the covariate. ‡ Chi-squared. Source: DeOreo et al. 1997

11
CORRELATIONS BETWEEN CHANGES IN HCT AND HRQL SCORES Source: Revicki et al. 1995 CHANGES IN HCT ScoreWeek 16Week 48 Energy0.35*0.37* Physical function0.37*0.35* * P < 0.05

12
A. Identify Concepts & Develop Conceptual Framework Identify concepts and domains. Identify intended application and population Hypothesize expected relationships among concepts D. Modify Instrument Revise measurement concept Change application Change mode of administration Adapt for culture or language Other modifications B. Create Instrument Generate items Choose data collection method Choose recall period Choose response options Evaluate patient understanding Develop instructions Identify scoring Format instrument Assess burden Confirm conceptual framework Finalize items & instrument C. Assess Measurement Properties Evaluate reliability, validity, and ability to detect change Propose methods for interpretation PRO

13
MEASUREMENT ATTRIBUTES AND REVIEW CRITERIA FOR HRQL INSTRUMENTS Attribute Criteria 1. Conceptual and measurement modelContent validity and framework for concept to be measured Conceptual and empirical basis for item content and subscales 2. Reliability Internal consistency (homogeneity) Reproducibility (test-retest reliability) Inter-rater reliability 3. ValidityDegree to which the instrument measures what it intends to measure. Construct-related Criterion-relayed
 Reproducibility (test-retest reliability) Inter-rater reliability 3. ValidityDegree to which the instrument measures what it intends to measure. Construct-related Criterion-relayed.")
14
MEASUREMENT ATTRIBUTES AND REVIEW CRITERIA FOR HRQL INSTRUMENTS (CONTINUED) 4. ResponsivenessAn instrument’s ability to detect change over time 5. InterpretabilityDegree to which one can assign easily understood meaning to an instrument’s quantitative scores.

15
RESPONSIVENESS AND MID Recommended approach, and evolving consensus: Estimate the MID based on several anchor-based methods, with relevant clinical or patient-based indicators. Examine various distribution-based estimates (i.e., effect size, standardized response mean, etc.) as supportive information. Triangulate on a single value or small range of values for the MID. Confidence in a specific MID value evolves over time and is confirmed by additional research evidence, including clinical trial experience. Source: Revicki et al. (in press)
 as supportive information. Triangulate on a single value or small range of values for the MID. Confidence in a specific MID value evolves over time and is confirmed by additional research evidence, including clinical trial experience. Source: Revicki et al. (in press).")
16
HRQL MEASURES USED IN CKD Kidney Disease Questionnaire Kidney Disease Questionnaire –Physical symptoms, fatigue, relationships, depression, frustration SF-36 Health Survey SF-36 Health Survey –Physical function, pain, vitality, role-physical, role-emotional, social function, general health, mental health Kidney Disease Quality of Life Questionnaire Kidney Disease Quality of Life Questionnaire –Includes SF-36 –Kidney disease-specific domains

17
Properties of HRQL Measures in Anemia in CKD Conceptual and Measurement ModelKDQSF-36KDQOL-SF Concept to be measured described ++ ++ Content validity based on literature review 0 ++ Content validity based on focus groups or cognitive debriefing interviews with patients with chronic renal disease and anemia ++ Content validity based on clinician or expert review ++ Specific conceptual framework which identifies concept and unique items (e.g., exploratory factor analysis or via literature) ++ Evidence of scale variability (i.e., item and scale distributions, frequencies) 0++ Intended level of measurement (e.g., ordinal, interval, ratio) + + + Record of item development (i.e., rational for item retention and deletion) ++ Rationale for recall period 0 00 Reliability Internal consistency reliability +++ Reproducibility ++++
 ++ Evidence of scale variability (i.e., item and scale distributions, frequencies) 0++ Intended level of measurement (e.g., ordinal, interval, ratio) Record of item development (i.e., rational for item retention and deletion) ++ Rationale for recall period 0 00 Reliability Internal consistency reliability +++ Reproducibility ++++")
18
Properties of HRQL Measures in Anemia in CKD (continued) Conceptual and Measurement ModelKDQSF-36KDQOL-SF Validity Content-related (see above) ++ Construct-related ++ ++ Criterion-related 0+0 Responsiveness Anchor-based +++ Distribution-based methods (i.e., effect size, SEM) +++ Interpretability MID estimates 000 Responder analysis 000 Respondent Burden Time needed to complete 0++ Reading and comprehension levels 000 Special requirements 000 Degree of missing data 000
 Conceptual and Measurement ModelKDQSF-36KDQOL-SF Validity Content-related (see above) ++ Construct-related Criterion-related 0+0 Responsiveness Anchor-based +++ Distribution-based methods (i.e., effect size, SEM) +++ Interpretability MID estimates 000 Responder analysis 000 Respondent Burden Time needed to complete 0++ Reading and comprehension levels 000 Special requirements 000 Degree of missing data 000")
19
Properties of HRQL Measures in Anemia in CKD (continued) Conceptual and Measurement ModelKDQSF-36KDQOL-SF Alternate modes of administration Self-report ++ Interviewer-administered 0++0 Cultural and language adaptations or translations # of available countries with cultural and linguistic translations ?22 # of available translations with evaluations of measurement properties ?66
 Conceptual and Measurement ModelKDQSF-36KDQOL-SF Alternate modes of administration Self-report ++ Interviewer-administered 0++0 Cultural and language adaptations or translations # of available countries with cultural and linguistic translations 22 # of available translations with evaluations of measurement properties 66")
20
RESULTS OF CESG ITT ANALYSES: TREATMENT VERSUS PLACEBO OVER TIME * Statistically significant after application of Bonferroni adjustment MEASURE Mixed Model p-value LOCF p-value Exercise Capacity Treadmill Stress Test Treadmill Stress Test0.0001*0.0001* 6-Minute Walk 6-Minute Walk0.04980.0508 Physical Function SIP Physical Summary SIP Physical Summary0.0015*0.0004* Ambulation0.00770.0127 Body Care & Movement 0.00680.0016* SIP Home Management SIP Home Management0.02910.0387 Symptoms KDQ Fatigue KDQ Fatigue0.0001*0.0001* KDQ Energy Symptom KDQ Energy Symptom0.01180.0314 KDQ Weakness Symptom KDQ Weakness Symptom0.01100.0187 KDQ Physical Symptoms KDQ Physical Symptoms0.0001*0.0001* KDQ Shortness of Breath Symptom KDQ Shortness of Breath Symptom0.79690.7961

21
6 Month Change SIP Physical Summary KDQ Fatigue SIP Home Management 0 1 2 3 4 5 6 Placebo Group A Group B 0 1 2 3 4 5 6 0 1 2 3 4 5 6 12 10 8 6 4 2 0 6 5 4 3 2 1 0 60 50 40 30 20 10 0 KDQ Physical Symptoms Minutes walked Distance Walked

22
CHANGES IN HRQL SCORES IN HIGH AND LOW HGB GROUP Source: Drueke et al 2006

23
*Threshold indicates established clinically meaningful difference as defined in literature, or minimally important effect size of ½ SD baseline value PHYSICAL FUNCTION SUPPORTING EVIDENCE MEASURESTUDYDESIGNTHRESHOLD*CHANGEP-value Physician-assessed Karnofsky Evans (19900 Single-arm10 5.0 5.0<0.001 Delano (1989) Single-arm1010.6 Not evaluated Harris (1991) Single-arm1012.0<0.0001 Patient-reported Karnofsky Moreno (1996) Controlled1012.6<0.0001 Moreno (2000) Single-arm10 2.8 2.8<0.01 SIP Physical Function McMahon (1992) Cross-over5.1 7.4 7.4<0.01 Moreno (1996) Controlled6.8 5.8 5.8<0.0001 McMahon (2000) Cross-over3.0 2.7 2.7<0.01 KDQ Physical Symptoms Muirhead (1992) RCT0.5 0.9 0.9<0.005 Foley (2000) RCT0.5 1.1 1.1 Not evaluated Furuland (2003) RCT0.5 0.7 0.7<0.05 SF-36 Physical Functioning Beusterien (1996) Controlled8 3.7 3.7<0.05 Besarab (1998) RCT8 Not evaluable <0.05 Other: “Physical Activity” Barany (1990) Single-arm1 1<0.05 Other: “Physical Activity” Barany (1993) Controlled0.04 0.06 0.06<0.01 Clinically Meaningful or Statistically significantNot Clinically Meaningful or Statistically significant
 Single-arm Not evaluated Harris (1991) Single-arm1012.0< Patient-reported Karnofsky Moreno (1996) Controlled1012.6< Moreno (2000) Single-arm <0.01 SIP Physical Function McMahon (1992) Cross-over <0.01 Moreno (1996) Controlled < McMahon (2000) Cross-over <0.01 KDQ Physical Symptoms Muirhead (1992) RCT <0.005 Foley (2000) RCT Not evaluated Furuland (2003) RCT <0.05 SF-36 Physical Functioning Beusterien (1996) Controlled <0.05 Besarab (1998) RCT8 Not evaluable <0.05 Other: Physical Activity Barany (1990) Single-arm1 1<0.05 Other: Physical Activity Barany (1993) Controlled <0.01 Clinically Meaningful or Statistically significantNot Clinically Meaningful or Statistically significant")
24
*Threshold indicates established clinically meaningful difference as defined in literature, or minimally important effect size of ½ SD baseline value ENERGY SUPPORTING EVIDENCE MEASURESTUDYDESIGNTHRESHOLD*CHANGEP-value KDQ Fatigue Muirhead (1992) RCT0.70.8<0.05 Foley (2000) RCT0.710.04<0.01 Fatigue Symptoms Evans (1990) Single-arm0.190.26<0.001 Harris (1991) Single-arm0.871.66<0.0001 NHP: Energy Evans (1990) Single-arm Not evaluable 27<0.001 NHP: Energy (%) Auer (1990) Single-arm0.240.5<0.0005 Auer (1992) Single-arm0.220.52<0.0001 Clinically Meaningful or statistically significant Not clinically meaningful or statistically significant
 RCT0.70.8<0.05 Foley (2000) RCT <0.01 Fatigue Symptoms Evans (1990) Single-arm <0.001 Harris (1991) Single-arm < NHP: Energy Evans (1990) Single-arm Not evaluable 27<0.001 NHP: Energy (%) Auer (1990) Single-arm < Auer (1992) Single-arm < Clinically Meaningful or statistically significant Not clinically meaningful or statistically significant")
25
† = Cycle ergometer tests vary in cycle speed, inclination, and termination ; ‡ = meters walked, * = L/min EXERCISE CAPACITY SUPPORTING EVIDENCE STUDYPROTOCOLBASELINEPOSTCHANGEP-value VO 2 (ml/kg/min) Mayer (1988) Cycle Ergometer Test † 16.023.27.2<0.02 Baraldi (1990) Cycle Ergometer Test † 24.132.68.5<0.05 Grunze (1990)* Cycle Ergometer Test † 1.191.370.18<0.05 Robertson (1990) Cycle Ergometer Test † 15.317.82.5<0.0005 Lundin (1991) Cycle Ergometer Test † 15.122.77.6<0.003 Metra (1991) Cycle Ergometer Test † 21.426.65.2<0.001 Lewis (1993) Weber Treadmill Protocol 18.725.16.4<0.05 Marrades (1996) Cycle Ergometer Test † 25.433.17.70.003 Treadmill Test (minutes walked) Robertson (1990) Cycle Ergometer Test † 6.457.601.15<0.0005 Lundin (1991) Maximal Treadmill Test 6.09.13.1<0.001 Hase (1993) Bruce Treadmill Protocol 4.636.401.77<0.01 Lewis (1993) Weber Treadmill Protocol 15.221.46.2<0.05 Metra (1991) Cycle Ergometer Test † 9.6211.92.32<0.05 6-minute walk Harris (1991) 6 Minute Walk Test ‡ 400600200<0.001 Statistically significant
 Mayer (1988) Cycle Ergometer Test † <0.02 Baraldi (1990) Cycle Ergometer Test † <0.05 Grunze (1990)* Cycle Ergometer Test † <0.05 Robertson (1990) Cycle Ergometer Test † < Lundin (1991) Cycle Ergometer Test † <0.003 Metra (1991) Cycle Ergometer Test † <0.001 Lewis (1993) Weber Treadmill Protocol <0.05 Marrades (1996) Cycle Ergometer Test † Treadmill Test (minutes walked) Robertson (1990) Cycle Ergometer Test † < Lundin (1991) Maximal Treadmill Test <0.001 Hase (1993) Bruce Treadmill Protocol <0.01 Lewis (1993) Weber Treadmill Protocol <0.05 Metra (1991) Cycle Ergometer Test † < minute walk Harris (1991) 6 Minute Walk Test ‡ <0.001 Statistically significant")
26
FUTURE OF PRO MEASUREMENT: NIH PROMIS Improve assessment of self- reported symptoms and domains of HRQL for application across a wide range of chronic diseases Improve assessment of self- reported symptoms and domains of HRQL for application across a wide range of chronic diseases Develop and test a large bank of items for measuring PROs Develop and test a large bank of items for measuring PROs Develop computer-adaptive testing (CAT) for efficient assessment of PROs Develop computer-adaptive testing (CAT) for efficient assessment of PROs Create a publicly available, flexible, and sustainable system allowing researchers to access to item banks and CAT tools Create a publicly available, flexible, and sustainable system allowing researchers to access to item banks and CAT tools
 for efficient assessment of PROs Develop computer-adaptive testing (CAT) for efficient assessment of PROs Create a publicly available, flexible, and sustainable system allowing researchers to access to item banks and CAT tools Create a publicly available, flexible, and sustainable system allowing researchers to access to item banks and CAT tools")
27
PROMIS DOMAIN HIERARCHY Negative Impacts of illness Anxiety Anger/Aggression Depression Substance Abuse Performance Satisfaction Physical Health Satisfaction Mental Health Satisfaction Social Health Satisfaction Self- reported Health Satisfaction Other Cognitive Function Emotional Distress Role Participation Social Support Self Concept Stress Response Spirituality/Meaning Social Impact Positive Impacts of Illness Subjective Well-Being (positive affect) Meaning and Coherence (spirituality) Mastery and Control (self-efficacy) Positive Psychological Functioning Pain Fatigue Sleep/Wake Function** Sexual Function Symptoms Upper Extremities: grip, buttons, etc (dexterity) Central: neck and back (twisting, bending, etc) Activities: IADL (e.g. errands) Lower Extremities: walking, arising, etc (mobility) Function/Disability
 Lower Extremities: walking, arising, etc (mobility) Function/Disability.")
28
Item Respons e Theory (IRT) Item Bank (IRT-calibrated items reviewed for reliability, validity, and sensitivity) Short Form Instruments CAT Items from Instrument A Item Pool Items from Instrument B Items from Instrument C New Items Questionnaire administered to large representative sample Secondary Data Analysis Cognitive Testing Focus Groups Content Expert Review
 Item Bank (IRT-calibrated items reviewed for reliability, validity, and sensitivity) Short Form Instruments CAT Items from Instrument A Item Pool Items from Instrument B Items from Instrument C New Items Questionnaire administered to large representative sample Secondary Data Analysis Cognitive Testing Focus Groups Content Expert Review")
29
ITEM BANKS no pain mild pain moderate pain severe pain extreme pain Pain Item Bank Item 1 Item 2 Item 3 Item 4 Item 5 Item 6 Item 7 Item 8 Item 9 Item n These items are reviewed by experts, patients, and methodologists to make sure: Item phrasing is clear and understandable for those with low literacy Item content is related to pain assessment and appropriate for target population Item adds precision for measuring different levels of pain An item bank is a large collection of items measuring a single domain, e.g., pain…

30
ITEM RESPONSE THEORY MODELS IRT models enable reliable and precise measurement of PROs IRT models enable reliable and precise measurement of PROs –Fewer items needed for equal precision –Makes assessment briefer More precision gained by adding items More precision gained by adding items –Reducing error and sample size requirements Error is understood at the individual level Error is understood at the individual level –Allowing practical individual assessment

31
RANGE OF MEASUREMENT sit on the edge of the bed climb up several stairs heavy work around the house strenuous activities usual physical activities 5 = Not at all 4 = Very little 3 = Somewhat 2 = Quite a lot 1 = Cannot do 5 = Without any difficulty 4 = With a little difficulty 3 = With some difficulty 2 = With much difficulty 1 = Unable to do Are you able to … Does your health now limit you in... DisabilityPhysical Function

32
People with more fatigue Items less likely to be endorsed Items more likely to be endorsed People with less fatigue PEOPLE AND ITEMS DISTRIBUTED ON THE SAME METRIC: FATIGUE

33
THE ADVANTAGES OF CAT-BASED ASSESSMENT Provide an accurate estimate of a person’s score with the minimal number of questions Provide an accurate estimate of a person’s score with the minimal number of questions –Questions are selected to match the health status of the respondent CAT minimizes floor and ceiling effects CAT minimizes floor and ceiling effects –People near the lower or upper extremes of a scale will receive items that are designed to assess their health status

34
SUMMARY Good availability of HRQL instruments for assessing outcomes in CKD patients with anemia Good availability of HRQL instruments for assessing outcomes in CKD patients with anemia –Evaluating treatment effects –Monitoring health status Good content coverage and psychometrically sound Good content coverage and psychometrically sound –Reliability –Validity –Responsiveness Future research needs to focus more on interpretation and clinical significance Future research needs to focus more on interpretation and clinical significance PROMIS may provide relevant and psychometrically sound measures of pain, fatigue, physical functioning and other domains PROMIS may provide relevant and psychometrically sound measures of pain, fatigue, physical functioning and other domains

35
CONCLUSION Relevancy of HRQL data for regulatory and clinical decision making depends on the strength of the research evidence on added value Relevancy of HRQL data for regulatory and clinical decision making depends on the strength of the research evidence on added value Safety and clinical efficacy data are insufficient for the comprehensive understanding of medical treatments Safety and clinical efficacy data are insufficient for the comprehensive understanding of medical treatments HRQL is the ultimate outcome of health care interventions and is the key to assessing effectiveness beyond safety and efficacy HRQL is the ultimate outcome of health care interventions and is the key to assessing effectiveness beyond safety and efficacy Patients, clinicians and regulatory agencies need HRQL data to make decisions about the benefit and risk of new therapies Patients, clinicians and regulatory agencies need HRQL data to make decisions about the benefit and risk of new therapies

36
THE GOAL OF MEDICINE (C 1400) “To cure sometimes, to relieve often, to comfort always”
 To cure sometimes, to relieve often, to comfort always")
Similar presentations


: A Resource for.>")


 Claims Ann Marie Trentacosti, M.D. Study Endpoints and Labeling Office of New Drugs Food.>")


: Opportunities in Health Services Research Steven Clauser, Ph.D. National Cancer Institute.>")