Download presentation
Presentation is loading. Please wait.

1
The Changing Arctic Climate as Observed from Space Josefino C. Comiso NASA Goddard Space Flight Center Josefino.c.comiso@nasa.gov IPY Presentation for Informal Educators GSFC Web, 16 October 2008

2
Scientific Motivations The Earth is warming and impacts of anthropogenic activities is becoming more apparent The Earth is warming and impacts of anthropogenic activities is becoming more apparent Satellite data is needed to get a global perspective of the problem Satellite data is needed to get a global perspective of the problem Early signals of a Climate change may come from the polar regions because of feedback effects. The Arctic is already showing such signals. Early signals of a Climate change may come from the polar regions because of feedback effects. The Arctic is already showing such signals. Impacts on the quality of human lives, on the economy and the infracstructure are huge. Impacts on the quality of human lives, on the economy and the infracstructure are huge. It may not be too late. Mitigation strategies must be considered seriously. It may not be too late. Mitigation strategies must be considered seriously.

3
Anthropogenic CO2 AES Drax in Yorkshire pumps smoke out of the tallest chimneys in the country. The coal-fired power plant emits more CO2 – 22.8 million tonnes annually – than the 100 least- industrialised nations combined. Drax provides 7% of Britain’s electrical power. Burning fossil fuels to turn steam turbines and create electricity accounts for a quarter of the world’s greenhouse gas emissions, and coal has the highest carbon content of all fuels

4
Culprit? Anthropogenic influence as depicted by the CO 2 Time Series

5
Antarctic Core Record for the Last 400,000 Years of Green- house Gases and Temperature + In Situ Data Since 1880 Natural climate variability is associated with Earth’s orbital parameters and solar effects. CO2, CH4 and estimated global temperature 0 = 1880-1899 mean

6
Hockey Stick - Earth’s Temperature Variations: Past 1000 Years

7
Surface temperature trends from meteorological stations around the world Rapid rise from 1910 to 1942 Moderate cooling from 1942 to 1975 Rapid rise from 1975 to the present (satellite era) Global cooling during volcanic erruptions Sputnik Launch
 Global cooling during volcanic erruptions Sputnik Launch")
8
Trends in the Arctic Surface Temperature (1981 to 2007) Russia Canada Alaska Greenland Trends in Ts >66.5°N = 0.64°C/dec Trends over Sea ice = 0.35°C/dec Trends over Greenland = 0.76°C/dec Trends over Eurasia = 0.23°C/dec Trends over North Am = 0.69°C/dec >60°N for both Eurasia and North Am
 Russia Canada Alaska Greenland Trends in Ts >66.5°N = 0.64°C/dec Trends over Sea ice = 0.35°C/dec Trends over Greenland = 0.76°C/dec Trends over Eurasia = 0.23°C/dec Trends over North Am = 0.69°C/dec >60°N for both Eurasia and North Am")
9
Seasonal Trends in the NH Surface Temperature

10
Polar Amplification- Feedbacks Ice-Albedo Feedback – relevant to retreating perennial ice cover and also over land Ice-Albedo Feedback – relevant to retreating perennial ice cover and also over land Cloud feedback – positive or negative, depending on the height of clouds Cloud feedback – positive or negative, depending on the height of clouds Other feedbacks are mainly positive Other feedbacks are mainly positive

11
Yearly Arctic Ice Cover during Maximum Extents 1979-2007 Extent trend: -2.2%/decade Areas trend: -2.5%/decade

12
Yearly Arctic Ice Cover during Minimum Extents 1979-2003 Extent trend: -10.1%/decade Area trend: -11.4%/decade 2007

13
2007 ice minimum area was 27% less than 2005 and 38% less than climatological average. The Big Sea Ice Anomaly in 2007 Ref: Comiso, J.C., C. Parkinson, R. Gersten and L. Stock, Accelerated decline in the Arctic sea ice cover, Geophysical Research Letter (in press).
..")
14
Temporal Variations in the ice cover, wind and surface temperature (March to May) Data indicates significant temperature and wind effects. In August, there was a cyclone in the region that may have facilitated anomaly. Aug 07 Anom

15
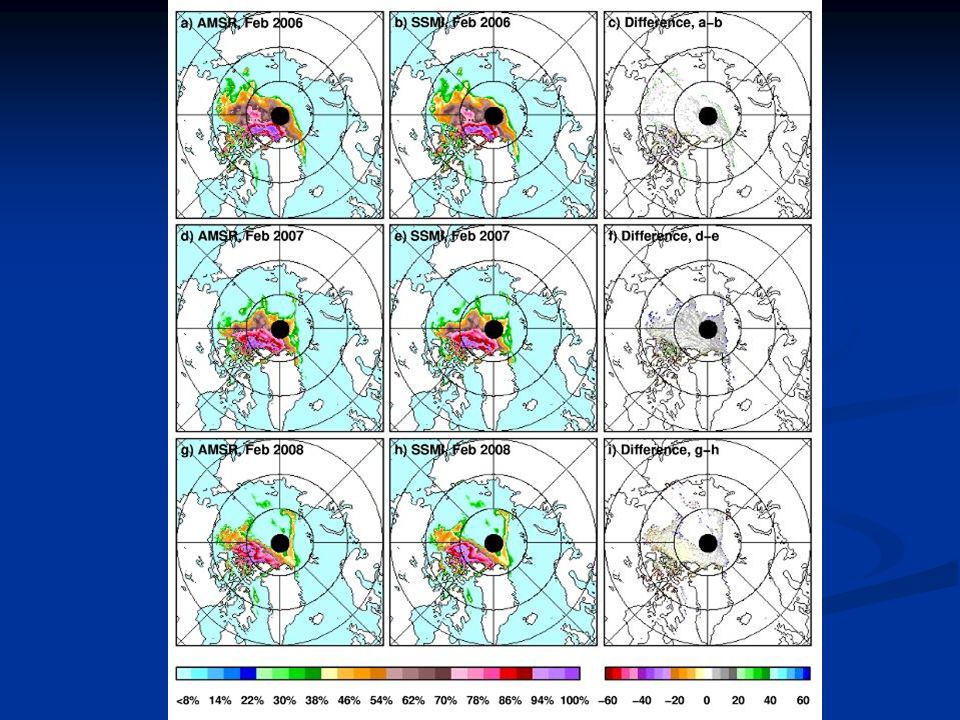
Cold Weather Conditions in the Arctic in Winter Surface temperature anomalies show cooling primarily in North America. Sea ice concentration anomalies indicate positive ice cover anomalies in the Bering Sea and Davis Strait and the effect is illustrated in the ice cover in mid winter (1 March 2008). Ice Concentration 1 March 2008 Russia Greenland Bering Sea Davis Strait Canada
. Ice Concentration 1 March 2008 Russia Greenland Bering Sea Davis Strait Canada.")
16
Total Ice Cover/Monthly Anomalies -10.1%/dec -10.7%/dec From 1978 to 1996, the trend in the ice extent was -2.2% per decade. Since 1996, the trend has changed to -10.1% per decade suggesting a large acceleration in the decline. Acceleration in the decline makes it difficult for ice to recover because of ice albedo feedback.

17
Update to 2008 Arctic Sea Ice 2008

18
Cluster MapMultiyear ice Map sub sonar Wadhams

20
The Wild Card? Multi Year Ice from 1981 to 1998

21
Winter and Summer MY/Perennial Ice Cover

22
Enhanced water temperatures in 2007 Anomaly maps based on AVHRR data from 1981 to 2007 show significant warming of Arctic SSTs in 2007

23
IPY measure ments Perovich and the CRREL Group

24
Summer ice melt 2007 Beaufort – huge increase in bottom melt

25
Monthly Snow Cover Extents and Anomalies from 1979 to 2003

26
Permafrost in Alaska

30
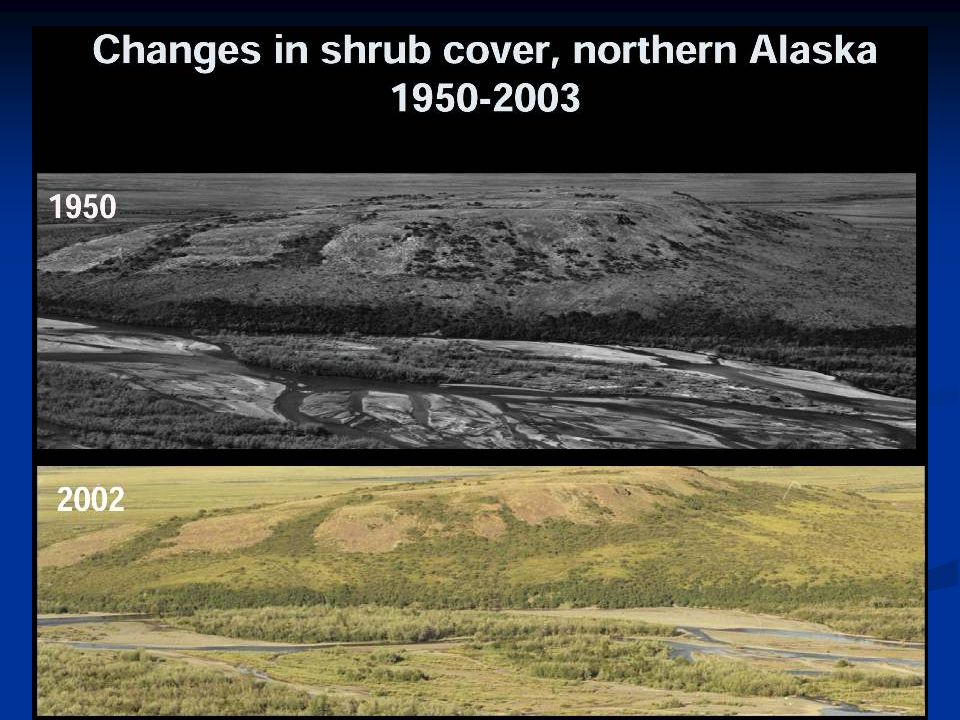
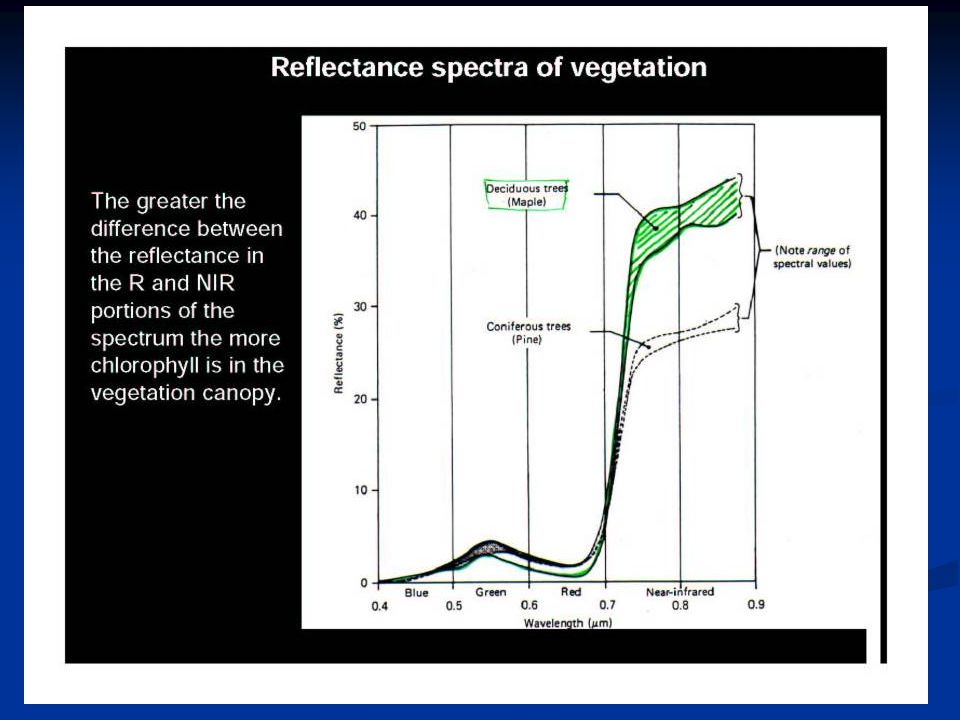
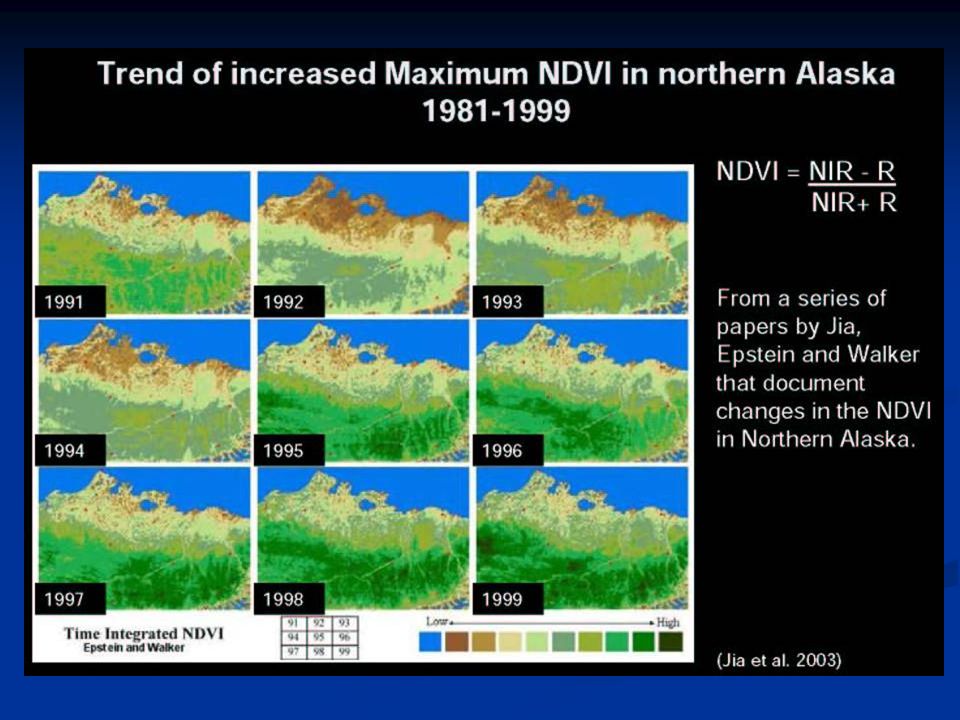
Change in NDVI, Arctic Region 1981 to 2006

31
Himalayan Glaciers

32
Horn and Waxeggkees Glaciers in the Austrian Tyrol 30 % of area and 50 % of volume was lost from1921 to 1994 Mendenhall Glacier in Alaska – observed to be Thinning by 0.5 to 1 m per year

33
Observed Decline in Glacier Volume

35
Area of melt increased dramatically in Greenland during the last four years Spring melt in Greenland in 2002

36
Estimates: Sea level equivalence Greenland ice sheet = 7 m Greenland ice sheet = 7 m East Antarctic ice sheet = 65 m East Antarctic ice sheet = 65 m West Antarctic ice sheet = 8 m West Antarctic ice sheet = 8 m Antarctic Peninsula = 0.46 m Antarctic Peninsula = 0.46 m All other ice forms + glaciers = 0.45 m All other ice forms + glaciers = 0.45 m Thermal expansion: the sea level goes up by 2 to 6 cm of every 1 K increase in Global Surface Temperature Thermal expansion: the sea level goes up by 2 to 6 cm of every 1 K increase in Global Surface Temperature Saline sea Ice = 0 m; Perennial sea ice =.02 m Saline sea Ice = 0 m; Perennial sea ice =.02 m

37
Effect of Sea Level Rise (2000 census)
")
38
Four Regions: Areas under water

39
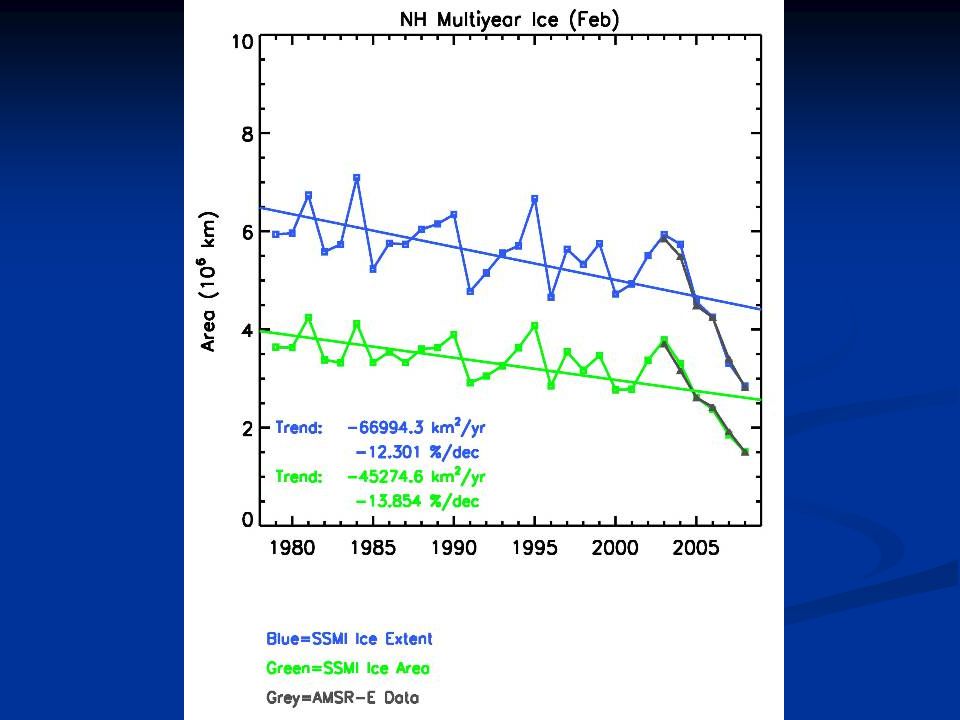
Summary Global warming is real. Met stations and satellite data show enhanced surface temperatures that are amplified in the polar regions. Global warming is real. Met stations and satellite data show enhanced surface temperatures that are amplified in the polar regions. Impacts of warming are now evident, the strongest being in the Arctic. Reductions in snow cover, glaciers, and increased melt in the permafrost and ice sheets are evident. Impacts of warming are now evident, the strongest being in the Arctic. Reductions in snow cover, glaciers, and increased melt in the permafrost and ice sheets are evident. The perennial ice now declining at 11.4 % per decade shows the most remarkable change. The 2007 ice minimum area was 38% less than climatological average and 27% less than previous lowest area in 2005. The 2008 perennial ice area was almost as low as that of 2007. The perennial ice now declining at 11.4 % per decade shows the most remarkable change. The 2007 ice minimum area was 38% less than climatological average and 27% less than previous lowest area in 2005. The 2008 perennial ice area was almost as low as that of 2007. The multiyear ice cover in winter is showing even more drastic declines at 14% per decade. Ice is thinning in part because of warmer ocean caused by ice albedo feedback. The multiyear ice cover in winter is showing even more drastic declines at 14% per decade. Ice is thinning in part because of warmer ocean caused by ice albedo feedback. Mitigation strategies are needed and needs to be implemented before it gets too late. Mitigation strategies are needed and needs to be implemented before it gets too late.

40
End of Presentation

41
Some Mitigation Strategies Use of alternative energy sources: wind turbines, solar/photovoltaic cells, nuclear, geothermal, ocean, hybrid/hydrogen cars, gasohol/fuel crops, etc. Use of alternative energy sources: wind turbines, solar/photovoltaic cells, nuclear, geothermal, ocean, hybrid/hydrogen cars, gasohol/fuel crops, etc. Truly international efforts to reduce the use of fossil fuels Truly international efforts to reduce the use of fossil fuels Construction of energy efficient buildings and public transportation systems Construction of energy efficient buildings and public transportation systems Conservation and greater public awareness of the consequences of global warming Conservation and greater public awareness of the consequences of global warming

42
The Ozone Hole Success Story: A good model for solving global Problems Scientists provided clear warning Scientists provided clear warning Special interest groups denied story for years but developed ozone-friendly technology Special interest groups denied story for years but developed ozone-friendly technology Media transmitted the message very well Media transmitted the message very well Public was responsive and willing to help Public was responsive and willing to help US/European leadership was very effective US/European leadership was very effective CFC-producing infrastructure quickly phased out CFC-producing infrastructure quickly phased out

43
Stronger Hurricanes Katrina More than $100B damage. 320 Million trees, corresponding to a biomass of 0.09 to 0.11 petagrams of carbon were transferred form live to dead pools.(7% of US fossil fuel emission each year)
.")
44
Super typhoon Chataan while approaching Japan on July 4, 2002 AMSR-E data at 85 GHz

45
Coral Reef off Fiji (Photo: Kevin Roland) Stresses on Coral Reefs
 Stresses on Coral Reefs")
46
AMSR-E and SSM/I Multiyear Ice Concentration

48
2007 is the second warmest year observed from meteorological stations Ttrends in the Northern Hemisphere was considerably higher than that of the Southern Hemisphere.

49
Icebergs from the Jakobshavn Ice Stream

50
January 31, 2002 March 17, 2002 Larson Ice Shelf Rapid Decline

Similar presentations


 climate change is on a timescale of decades, an example would.>")

![Climate Change Impacts in the United States Third National Climate Assessment [Name] [Date] Climate Trends.](/15/4626683/big_thumb.jpg "Climate Change Impacts in the United States Third National Climate Assessment [Name] [Date] Climate Trends.>")


 –The hotter they.>")
 1. Is it warming? --climate proxy info (recap) -- info from historical & instrumental records 2. What.>")
 Your Organization (Line #2) Global warming.: Matthieu BERCHER, Master M.I.G.S., University of Burgundy,>")
 1. Enhanced Greenhouse Effect 2. CO 2 sensitivity 3. Projected CO 2 emissions 4. Projected CO 2 atmosphere concentrations 5. What.>")


