Download presentation
Presentation is loading. Please wait.

1
EMR 6500: Survey Research Dr. Chris L. S. Coryn Kristin A. Hobson Spring 2013

2
Agenda Stratified random sampling for means and totals Review

3
Stratified Random Sampling

4
A stratified random sample is one in which some form of random sampling is applied in each of a set of separate groups formed from all entries on a sampling frame from which a sample is to be drawn

5
Strata In stratified random sampling, strata are nonoverlapping groups separating population elements By strategically forming these groups, stratification becomes a feature of the sample design that can improve the statistical quality of survey estimates

6
Notation for Stratified Random Sampling

7
Allocation to Strata Deciding how a stratified sample will be distributed among all strata is called stratum allocation The most appropriate allocation method depends on how the stratification will be used

8
Equal Allocation If the main purpose of stratification is to control subgroup sample sizes for important population subgroups, stratum sample sizes should be sufficient to meet precision requirements for subgroup analysis An important part of the analysis is to produce comparisons among all subgroup strata In this instance, equal allocation (i.e., equal sample sizes) would be appropriate
 would be appropriate")
9
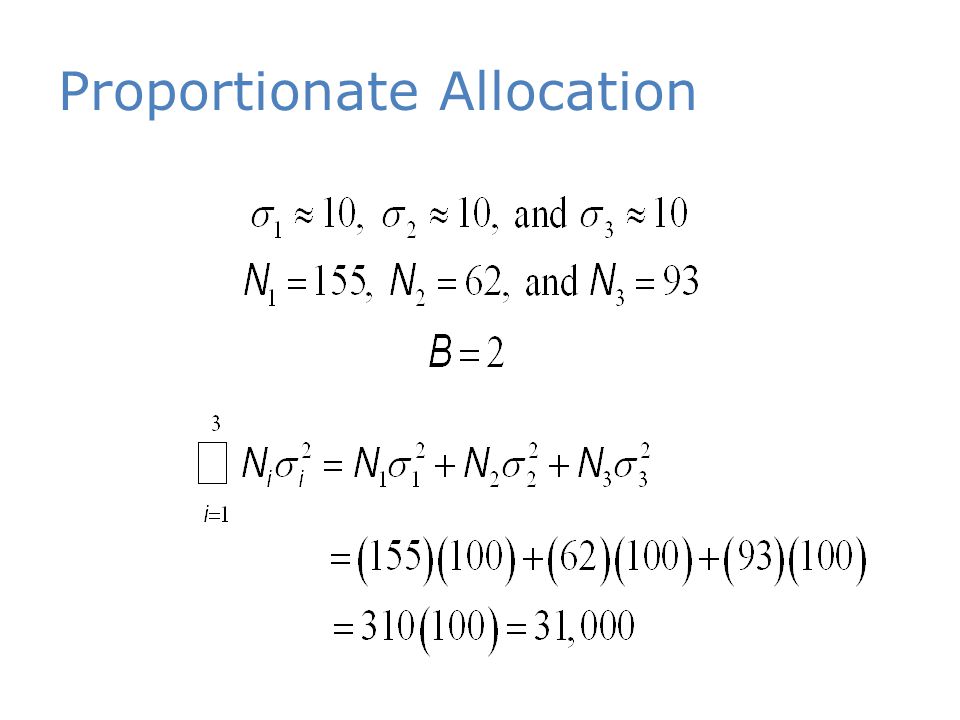
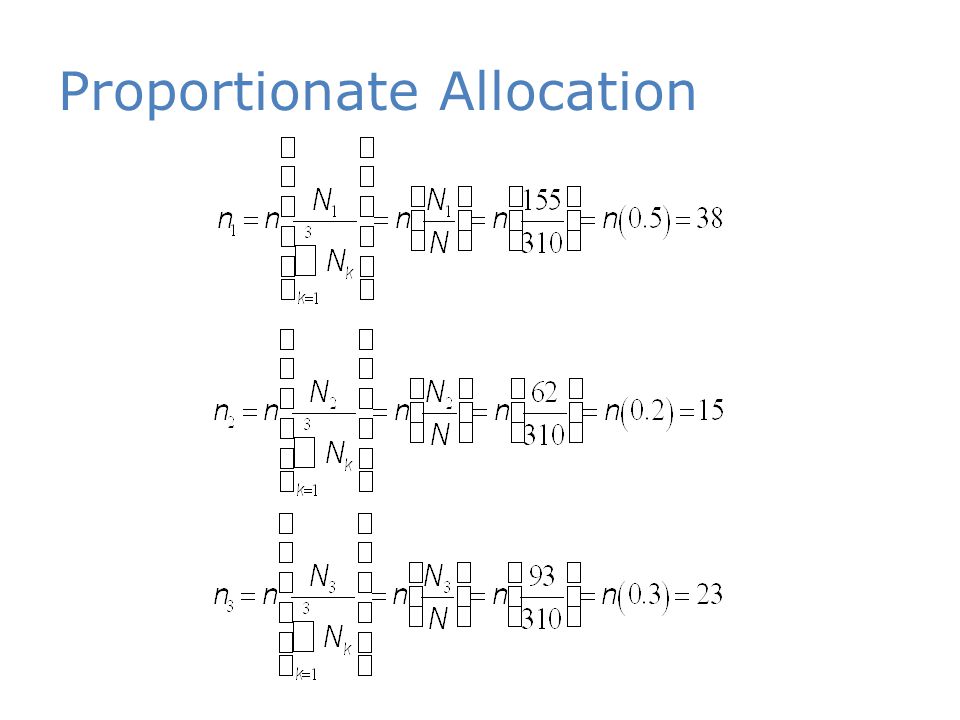
Proportionate Allocation Proportionate allocation is a prudent choice when the main focus of the analysis is characteristics of several subgroups or the population as a whole and where the appropriate allocations for these analyses are discrepant Proportionate allocation involves applying the same sampling rate to all strata, thus implying that the percent distribution of the selected sample among strata is identical to the corresponding distribution for the population

10
Optimum Allocation Optimum allocation, in which the most cost-efficient stratum sample sizes are sought, can lead to estimates of overall population characteristics that are statistically superior to those from proportionate allocations When all stratum unit costs are the same, the stratum sampling rates that yield the most precise sample estimates are proportional to the stratum-specific standard deviations (Neyman allocation)
")
11
Estimation of a Population Mean and Total

12
Estimate of Population Mean

13
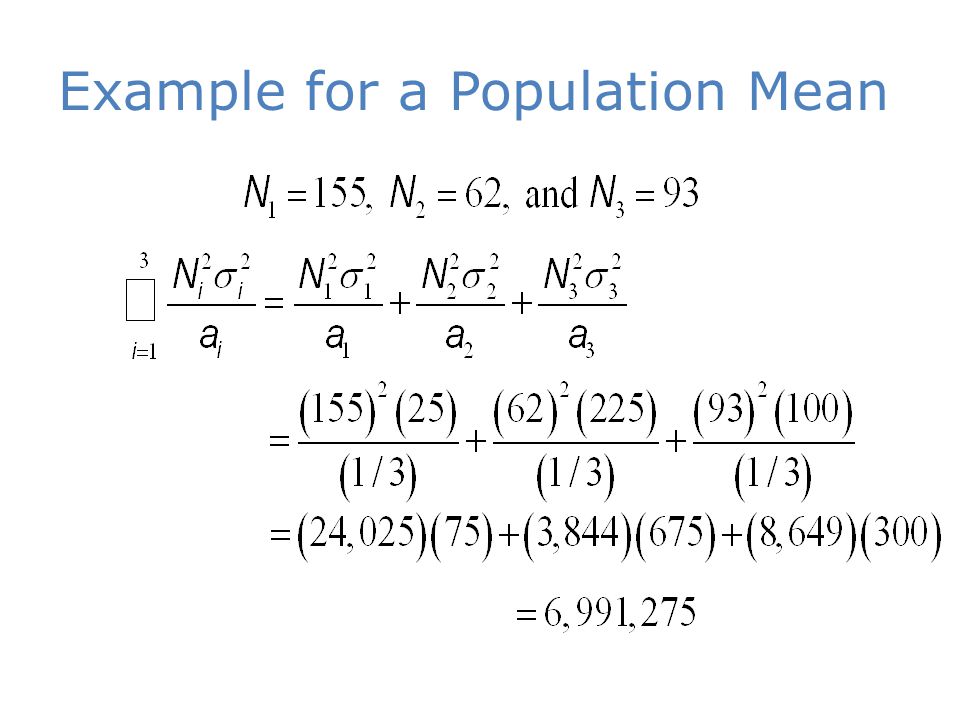
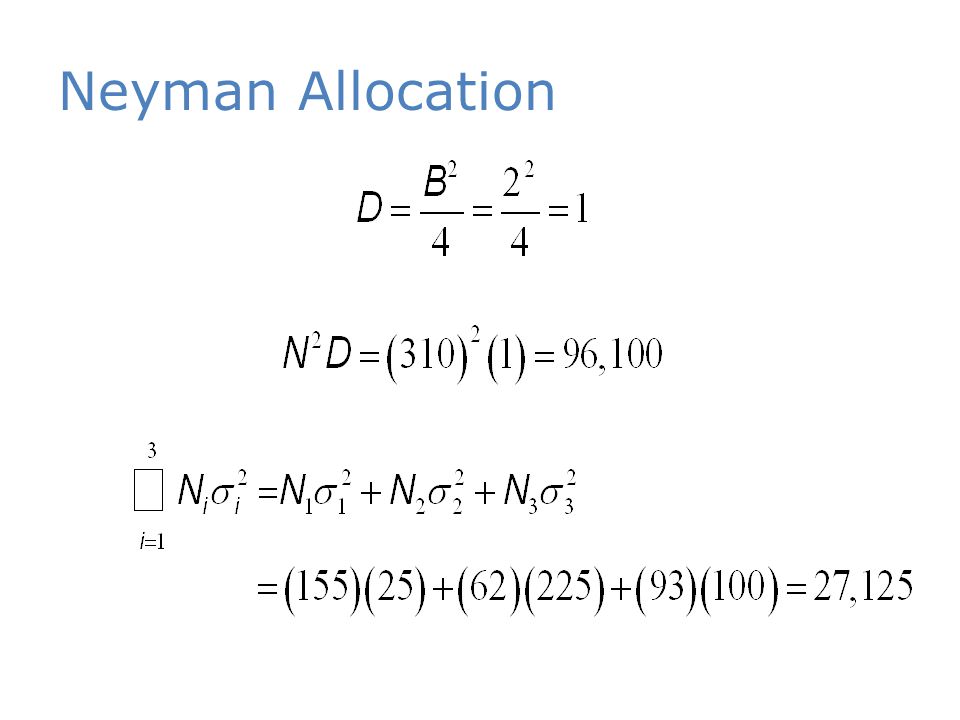
Example for a Population Mean NnMSD Town A1552033.905.95 Town B62825.1215.25 Rural931219.009.36

14
Example for a Population Mean

15
Estimate of Population Total

16
Example for Population Total

17
Selecting the Sample Size for Estimating Population Means and Totals

18
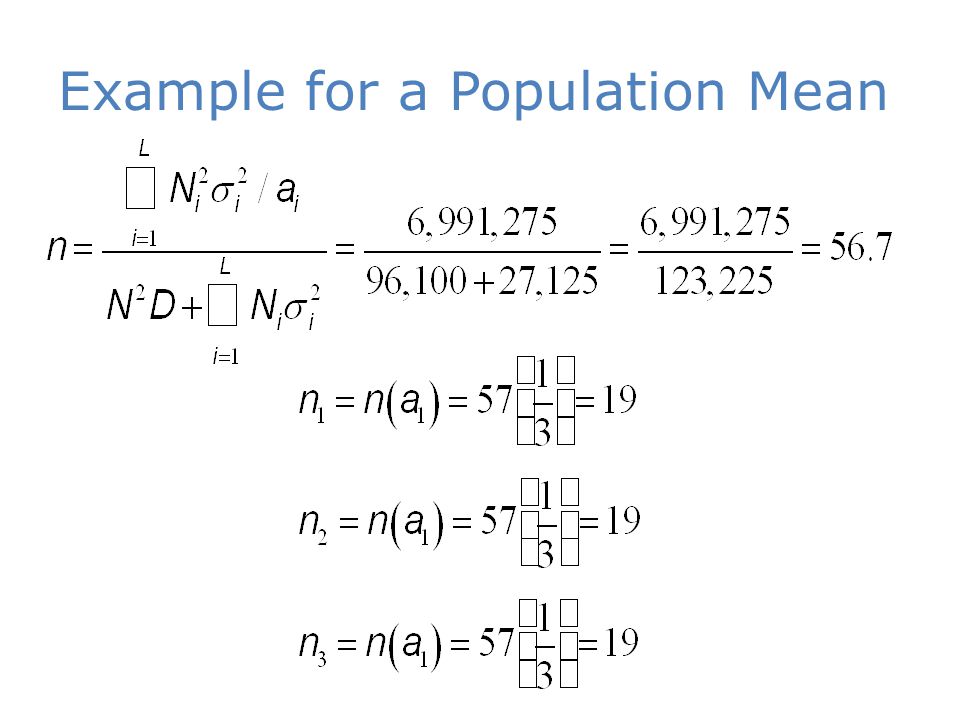
Sample Size for Estimating Population Means and Totals

19
Example for a Population Mean

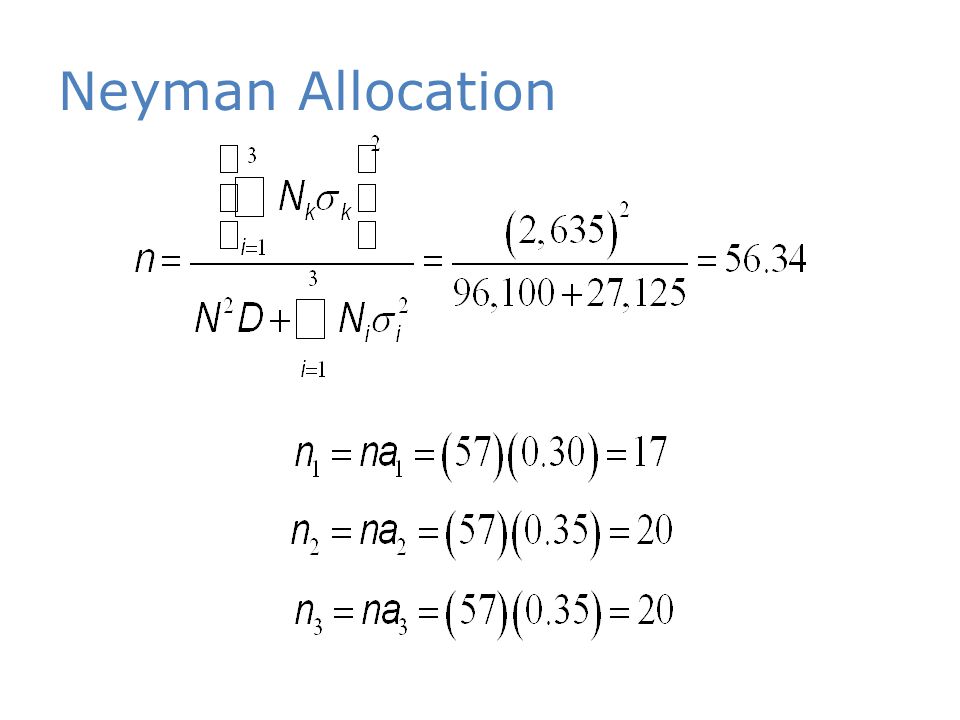
23
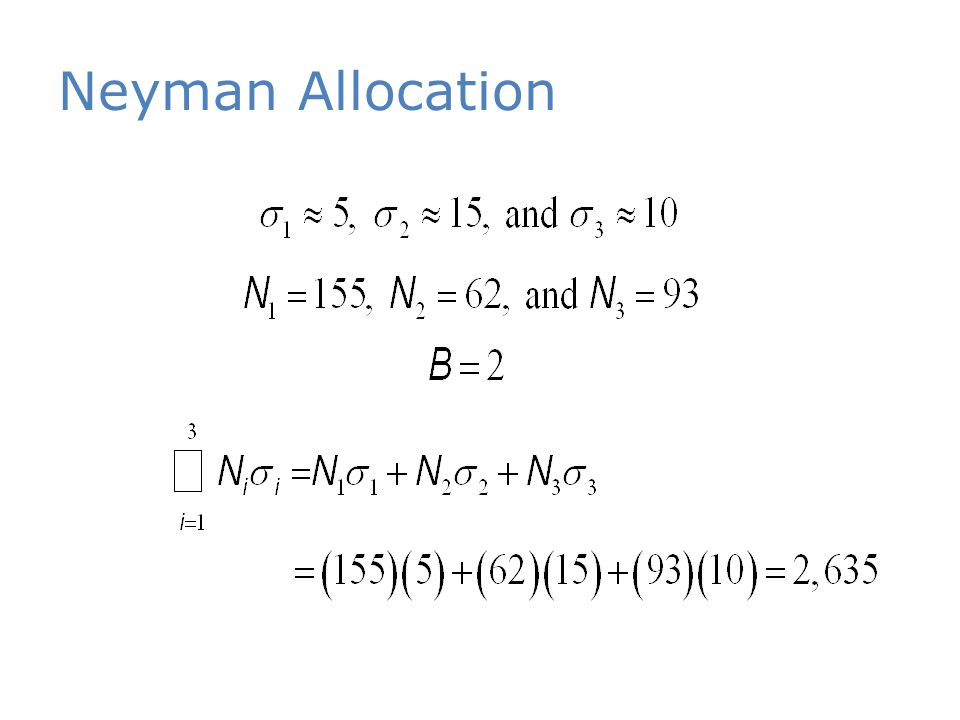
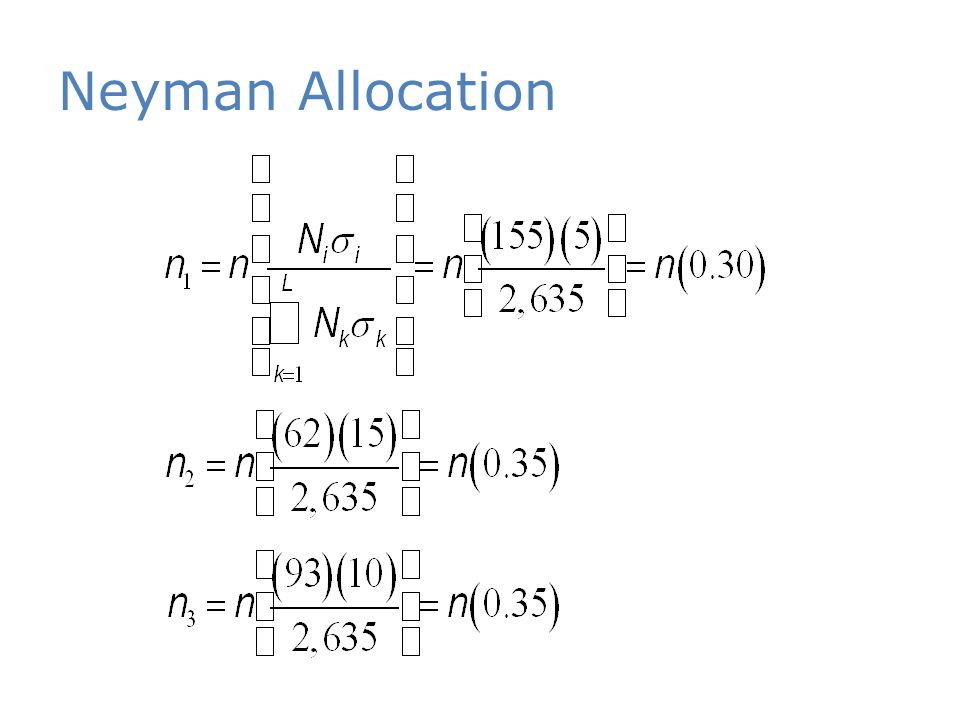
Neyman Allocation

28
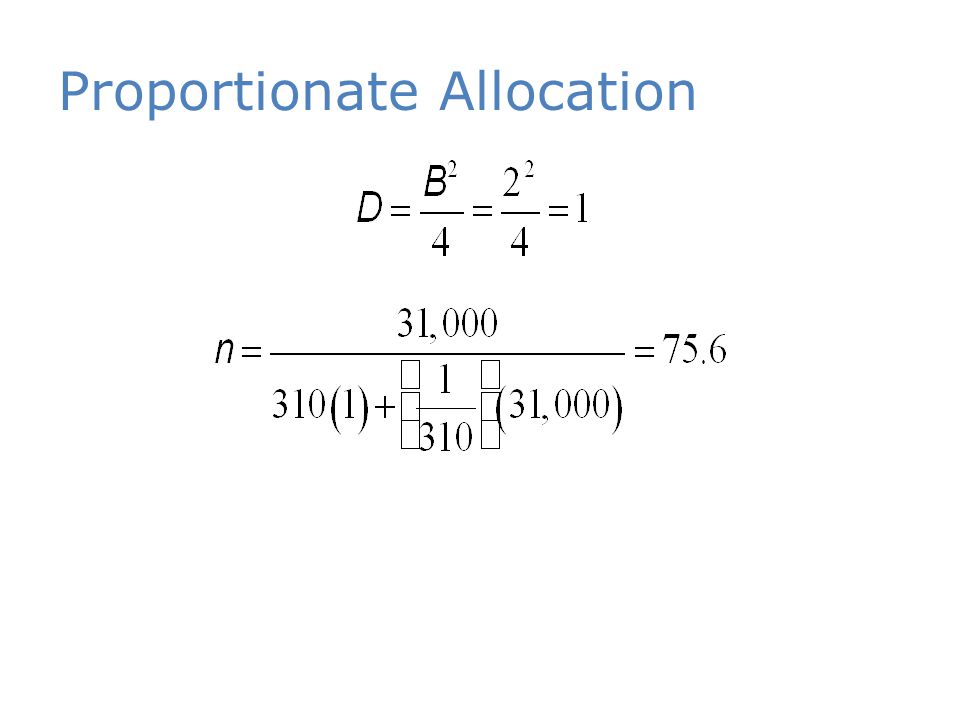
Proportionate Allocation

32
Comparison of Allocation Methods Proportionate Neyman General framework

33
Review

34
The Tailored Design Method

35
Uses multiple motivational features in compatible and mutually supportive ways to encourage high quantity and quality of responses

36
The Tailored Design Method Premised on social exchange perspective on human behavior Assumes that the likelihood of responding is greater when the expected rewards outweigh the anticipated costs

37
The Tailored Design Method Gives attention to all aspects of contacting and communicating with respondents Encourages response by considering survey sponsorship, the nature of the population and variations within it, and content of questions

38
The Tailored Design Method Emphasizes reducing errors of coverage, sampling, nonresponse, and measurement

39
Coverage Error Occurs when all members of a population do not have a known, non-zero probability of selection Occurs when those who are excluded are different from those who are included

40
Sampling Error Results from surveying only some rather than all members of a population Represented by B, the bound on the error of estimation

41
Nonresponse Error Occurs when people selected do not respond and are different than those who do Nonresponse can occur at the level of items within a survey or at the level of the survey – MAR – MCAR

42
Measurement Error Occurs when responses are inaccurate or imprecise Primarily related to poor layout and poor design and wording of questions

43
Social Exchange and Surveys Addresses three central questions about design and implementation 1.How can the perceived rewards for responding be increased? 2.How can the perceived costs of responding be reduced? 3.How can trust be established so that people believe the rewards will outweigh the costs of responding?

44
Increasing Benefits Provide information about the survey Ask for help or advise Show positive regard Say thank you Support group values Give tangible rewards Make the questionnaire interesting Provide social validation Inform people that opportunities to respond are limited

45
Decreasing Costs Make it convenient to respond Avoid subordinating language Make the questionnaire short and easy to complete Minimize requests for personal or sensitive information Emphasize similarity to other requests or tasks to which a person has already responded

46
Establishing Trust Obtain sponsorship by legitimate authority Provide a token of appreciation in advance Make the task appear important Ensure confidentiality and security of information

47
Features that can be Tailored Survey mode – Singular or multiple Sample design – Type of sample – Number of units sampled Incentives – Type of incentive – Amount or cost of incentive – Before or after

48
Features that can be Tailored Contacts – Number of contacts – Timing of initial and subsequent contacts – Mode of each contact – Whether contacts will be personalized – Sponsorship information – Visual design of each contact – Text or words in each contact

49
Features that can be Tailored Additional materials – Whether to provide them at all – Type of materials (e.g., research report) – Visual design of materials – Text or wording of materials
 – Visual design of materials – Text or wording of materials")
50
Features that can be Tailored Questionnaire – Topics included – Length (duration, number of pages/screens, number of questions) – First page or screen – Visual design – Organization and order of questions – Navigation through questionnaire
 – First page or screen – Visual design – Organization and order of questions – Navigation through questionnaire")
51
Features that can be Tailored Individual questions – Topic (sensitive, of interest to the respondent) – Type (open-ended versus closed-ended) – Organization of information – Text or wording – Visual design
 – Type (open-ended versus closed-ended) – Organization of information – Text or wording – Visual design")
52
Coverage and Sampling

53
Central Terminology An element is an object on which a measurement is taken A population is a collection of elements to which an inference is made from a sample A sample is a collection of sampling units drawn from a frame or frames Sampling units are nonoverlapping collections of elements from the population that cover the entire population A frame is a list of sampling units

54
Central Terminology A completed sample is the units that respond Sampling error is the result of collecting data from only a subset, rather than all, units from a frame – Again, represented by B, the bound on the error of estimation

55
Coverage The degree to which the units in a sampling frame correspond to the population of interest Coverage is likely one of the most serious problems in most surveys

56
Coverage and Frame Problems

57
Reducing Coverage Error Central questions: – Does the list contain everyone in the survey population? – Does the list include people who are not in the study population? – How is the list maintained and updated? – Are the same sample units included on the list more than once? – Does the list contain other information that can be used to improve the survey?

58
Estimate of Population Mean

59
Estimate of Population Total

60
Selecting the Sample Size for Estimating Population Means and Totals

61
Sample Size for Estimating Population Means where

62
Often, the population variance,, is unknown An approximate value of can be obtained by Sample Size for Estimating Population Means

63
Sample Size for Estimating Population Totals where

64
Estimation of a Population Proportion

65
Estimate of Population Proportion where

66
Selecting the Sample Size for Estimating a Population Proportion

67
Sample Size for Estimating Population Proportions where and

68
An Overview of Crafting Good Questions

69
Issues to Consider 1.What survey mode(s) will be used to ask the questions? 2.Is the question being repeated from another survey, and/or will answers be compared to previously collected data? 3.Will respondents be willing and motivated to answer accurately? 4.What type of information is the question asking for?

70
Choosing Words and Forming Question 1.Make sure the question applies to the respondent 2.Make sure the question is technically accurate 3.Ask one question at a time 4.Use simple and familiar words 5.Use specific and concrete words to specify the concepts clearly 6.Use as few words as possible to pose the question 7.Use complete sentences with simple sentence structures 8.Make sure “yes” means yes and “no” means no 9.Be sure the question specifies the response task

71
Visual Presentation of Survey Questions 1.Use darker and/or larger print for the question and lighter and/or smaller print for answer choices and answer spaces 2.Use spacing to create subgrouping within a question 3.Visually standardize all answer spaces or response options 4.Use visual design properties to emphasize elements that are important to the respondent and to deemphasize those that are not 5.Make sure words and visual elements that make up the question send consistent messages 6.Integrate special instructions into the question where they will be used rather than including them as freestanding entities 7.Separate optional or occasionally needed instructions from the question stem by font or symbol variation 8.Organize each question in a way that minimizes the need to reread portions in order to comprehend the response task 9.Choose line spacing, font, and text size to ensure the legibility of the text

Similar presentations


 Chapter 1 Introduction and Data Collection.>")


 Chapter 1 Introduction and Data Collection.>")
 Dr. Michael R. Hyman, NMSU.>")


