Download presentation
Presentation is loading. Please wait.

1
NATIONAL PRODUCTIVITY COUNCIL WELCOMES YOU TO A PRESENTATION ON
CONTROL CHARTS By B.Girish Dy. Director

2
Three SQC Categories Traditional descriptive statistics
e.g. the mean, standard deviation, and range Acceptance sampling used to randomly inspect a batch of goods to determine acceptance/rejection Does not help to catch in-process problems Statistical process control (SPC) Involves inspecting the output from a process Quality characteristics are measured and charted Helpful in identifying in-process variations
 Involves inspecting the output from a process. Quality characteristics are measured and charted. Helpful in identifying in-process variations.")
3
Statistical Process Control (SPC)
A methodology for monitoring a process to identify special causes of variation and signal the need to take corrective action when appropriate SPC relies on control charts

4
SPC Implementation Requirements
Top management commitment Project champion Initial workable project Employee education and training Accurate measurement system

5
Traditional Statistical Tools
The Mean- measure of central tendency The Range- difference between largest/smallest observations in a set of data Standard Deviation measures the amount of data dispersion around mean

6
Distribution of Data Normal distributions Skewed distribution

7
Sources of Variation Common causes of variation
Random causes that we cannot identify Unavoidable e.g. slight differences in process variables like diameter, weight, service time, temperature Assignable causes of variation Causes can be identified and eliminated e.g. poor employee training, worn tool, machine needing repair

8
Common Causes Special Causes

9
Histograms do not take into account changes over time.
Control charts can tell us when a process changes

10
Introduction to Control Charts
Important uses of the control chart Most processes do not operate in a state of statistical control Consequently, the routine and attentive use of control charts will identify assignable causes. If these causes can be eliminated from the process, variability will be reduced and the process will be improved The control chart only detects assignable causes. Management, operator, and engineering action will be necessary to eliminate the assignable causes.

11
Introduction to Control Charts
Monitor Variation in Data Exhibit trend - make correction before process is out of control A Process - A Repeatable Series of Steps Leading to a Specific Goal

12
Introduction to Control Charts
(continued) Show When Changes in Data are Due to: Special or assignable causes Fluctuations not inherent to a process Represent problems to be corrected Data outside control limits or trend Chance or common causes Inherent random variations Consist of numerous small causes of random variability
 Show When Changes in Data are Due to: Special or assignable causes. Fluctuations not inherent to a process. Represent problems to be corrected. Data outside control limits or trend. Chance or common causes. Inherent random variations. Consist of numerous small causes of random variability.")
13
Introduction to Control Charts
Graph of sample data plotted over time Special Cause Variation Process Average UCL Mean LCL Common Cause Variation

14
Commonly Used Control Charts
Variables data x-bar and R-charts x-bar and s-charts Charts for individuals (x-charts) Attribute data For “defectives” (p-chart, np-chart) For “defects” (c-chart, u-chart)
 Attribute data. For defectives (p-chart, np-chart) For defects (c-chart, u-chart)")
15
Introduction to Control Charts
Popularity of control charts 1) Control charts are a proven technique for improving productivity. 2) Control charts are effective in defect prevention. 3) Control charts prevent unnecessary process adjustment. 4) Control charts provide diagnostic information. 5) Control charts provide information about process capability.
 Control charts are a proven technique for improving productivity. 2) Control charts are effective in defect prevention. 3) Control charts prevent unnecessary process adjustment. 4) Control charts provide diagnostic information. 5) Control charts provide information about process capability.")
16
Control Chart Selection
Quality Characteristic variable attribute defective defect no n>1? x and MR constant sampling unit? yes constant sample size? yes p or np no n>=10 or computer? x and R yes no no yes p-chart with variable sample size c u x and s

17
SPC Methods-Control Charts
Control Charts show sample data plotted on a graph with CL, UCL, and LCL Control chart for variables are used to monitor characteristics that can be measured, e.g. length, weight, diameter, time Control charts for attributes are used to monitor characteristics that have discrete values and can be counted, e.g. % defective, number of flaws in a shirt, number of broken eggs in a box

18
Control Charts for Attributes –P-Charts & C-Charts
Use P-Charts for quality characteristics that are discrete and involve yes/no or good/bad decisions Number of leaking caulking tubes in a box of 48 Number of broken eggs in a carton Use C-Charts for discrete defects when there can be more than one defect per unit Number of flaws or stains in a carpet sample cut from a production run Number of complaints per customer at a hotel

19
Control Chart Design Issues
Basis for sampling Sample size Frequency of sampling Location of control limits

21
Developing Control Charts
Prepare Choose measurement Determine how to collect data, sample size, and frequency of sampling Set up an initial control chart Collect Data Record data Calculate appropriate statistics Plot statistics on chart

22
Pre-Control nominal value Green Zone Yellow Zones Red Zone LTL UTL
Good for machining, but only when Cp is 1.14 Initiate mfg run: 5 consecutive must fall in green zone, if not reevaluate setup. Sample a part. If green continue. If yellow sample another. If second is green continue, and if not look for special cause. If any part is red look for special cause. Sample rate is time between out of control divided by 6.

23
Control Limits UCL = Process Average + 3 Standard Deviations
LCL = Process Average - 3 Standard Deviations X UCL + 3 Process Average - 3 LCL TIME

24
Next Steps Determine trial control limits
Center line (process average) Compute UCL, LCL Analyze and interpret results Determine if in control Eliminate out-of-control points Recompute control limits as necessary
 Compute UCL, LCL. Analyze and interpret results. Determine if in control. Eliminate out-of-control points. Recompute control limits as necessary.")
25
Setting Control Limits
Control limits balance risks like Type I error Percentage of values under normal curve

28
Comparing Control Chart Patterns
X X X Common Cause Variation: No Points Outside Control Limits Special Cause Variation: 2 Points Outside Control Limits Downward Pattern: No Points Outside Control Limits but Trend Exists

29
Typical Out-of-Control Patterns
Point outside control limits Sudden shift in process average Cycles Trends Hugging the center line Hugging the control limits Instability

30
Control Charts for Variables
Use x-bar and R-bar charts together Used to monitor different variables X-bar & R-bar Charts reveal different problems In statistical control on one chart, out of control on the other chart? OK?

31
Processes In Control

32
Process Out of Control

33
Shift in Process Average

34
Identifying Potential Shifts

35
Cycles

36
Trend

37
PROCESS STREAMS UCL Mixtures Sudden stability Center line LCL

38
Interpreting Control Charts
Process In Control Out of Run Chart points do not form a parti- cular pattern and lie within the upper and lower chart limits Chart points form a particular pattern OR one or more points lie beyond the uppor or lower Chart points are on one side of the center line. The number of points in a run is called the “length of the run” UCL 10 x 19 lcl 30 The process is stable, not changing. Doesn’t necesarily mean to leave the process alone. May be opportunities to improve the process and enjoy substantial benefits Alerts us that the process is changing. Doesn’t mean you need to take a corrective action. May be relate to a change you have made. Be sureto identify the reason\(s) before taking any constructive actions(w) Suggest the process has undergone a permanent change (positive or negative) and is now becoming stable. Often requires tha t you recompute the control lines for future interpre- tation efforts. Description Example # 1 Example # 2 Interpretation
 before taking. any constructive actions(w) Suggest the process has. undergone a permanent. change (positive or. negative) and is now. becoming stable. Often. requires tha t you. recompute the control. lines for future interpre- tation efforts. Description. Example # 1. Example # 2. Interpretation.")
39
Interpreting Control Charts
Trend Cycle Hugging A continued rise or fall in a series of points (7 or more consecutive points direction) Chart ponts show the same pattern changes (e.g.rise or fall) over equal periods of time Chart points are close to the center line or to a control limit line (2 out of 3, 3 out of 4, or 4 out of 10.) UCL 10 x 19 lcl 30 CL 10 Description Example # 1 Example # 2 Interpretation 1 2 3 4 5 6 7 1/2 Often seen after some change has been made. Helps tell you if the change(s) had a positive or negative effect. may also be part of a learning curve associated with some form of training often relates to factors that influence the process in a predictable manner. Factors occur over a set time period and a positive/negative effect Helps determine future work load and staffing levels Suggests a different type of data has been mixed into the sub-group being sampled. Often need to change the sub-group, reassemble the data, redraw the control chart
 Chart ponts show. the same pattern. changes (e.g.rise. or fall) over equal. periods of time. Chart points are. close to the center. line or to a. control limit line. (2 out of 3, 3 out of. 4, or 4 out of 10.) UCL 10. x 19. lcl 30. CL 10. Description. Example # 1. Example # 2. Interpretation /2. Often seen after some change. has been made. Helps tell. you if the change(s) had a. positive or negative effect. may also be part of a. learning curve associated. with some form of training. often relates to factors that. influence the process in a. predictable manner. Factors. occur over a set time period. and a positive/negative effect. Helps determine future work. load and staffing levels. Suggests a different type of. data has been mixed into the. sub-group being sampled. Often need to change the. sub-group, reassemble the. data, redraw the control. chart.")
40
When to Take Corrective Action
Corrective Action Should Be Taken When Observing Points Outside the Control Limits or when a Trend Has Been Detected Eight consecutive points above the center line (or eight below) Eight consecutive points that are increasing (decreasing)
 Eight consecutive points that are increasing (decreasing)")
41
Out-of-Control Processes
If the Control Chart Indicates an Out-of-Control Condition (a Point Outside the Control Limits or Exhibiting Trend) Contains both common causes of variation and assignable causes of variation The assignable causes of variation must be identified If detrimental to quality, assignable causes of variation must be removed If increases quality, assignable causes must be incorporated into the process design
 Contains both common causes of variation and assignable causes of variation. The assignable causes of variation must be identified. If detrimental to quality, assignable causes of variation must be removed. If increases quality, assignable causes must be incorporated into the process design.")
42
In-Control Process If the Control Chart is Not Indicating Any Out-of-Control Condition, then Only common causes of variation exist It is sometimes said to be in a state of statistical control If the common-cause variation is small, then control chart can be used to monitor the process If the common-cause variation is too large, the process needs to be altered

43
Types of Error First Type: Second Type:
Belief that observed value represents special cause when, in fact, it is due to common cause Second Type: Treating special cause variation as if it is common cause variation

44
Remember Control does not mean that the product or service will meet the needs. It only means that the process is consistent (may be consistently bad). Capability of meeting the specification.
. Capability of meeting the specification.")
45
How to use the results By eliminating the special causes first and then reducing the common causes, quality can be improved.

46
Final Steps Use as a problem-solving tool Compute process capability
Continue to collect and plot data Take corrective action when necessary Compute process capability

47
Process Capability Product Specifications
Preset product or service dimensions, tolerances e.g. bottle fill might be 16 oz. ±.2 oz. (15.8oz.-16.2oz.) Based on how product is to be used or what the customer expects Process Capability – Cp and Cpk Assessing capability involves evaluating process variability relative to preset product or service specifications Cp assumes that the process is centered in the specification range Cpk helps to address a possible lack of centering of the process
 Based on how product is to be used or what the customer expects. Process Capability – Cp and Cpk. Assessing capability involves evaluating process variability relative to preset product or service specifications. Cp assumes that the process is centered in the specification range. Cpk helps to address a possible lack of centering of the process.")
48
Relationship between Process Variability and Specification Width
Three possible ranges for Cp Cp = 1, as in Fig. (a), process variability just meets specifications Cp ≤ 1, as in Fig. (b), process not capable of producing within specifications Cp ≥ 1, as in Fig. (c), process exceeds minimal specifications One shortcoming, Cp assumes that the process is centered on the specification range Cp=Cpk when process is centered
, process. variability just meets specifications. Cp ≤ 1, as in Fig. (b), process not capable of producing within specifications. Cp ≥ 1, as in Fig. (c), process. exceeds minimal specifications. One shortcoming, Cp assumes that the process is centered on the specification range. Cp=Cpk when process is centered.")
49
Computing the Cp Value at Cocoa Fizz: three bottling machines are being evaluated for possible use at the Fizz plant. The machines must be capable of meeting the design specification of oz. with at least a process capability index of 1.0 (Cp≥1) The table below shows the information gathered from production runs on each machine. Are they all acceptable? Solution: Machine A Machine B Cp= Machine C Machine σ USL-LSL 6σ A .05 .4 .3 B .1 .6 C .2 1.2

50
Computing the Cpk Value at Cocoa Fizz
Design specifications call for a target value of 16.0 ±0.2 OZ. (USL = 16.2 & LSL = 15.8) Observed process output has now shifted and has a µ of 15.9 and a σ of 0.1 oz. Cpk is less than 1, revealing that the process is not capable
 Observed process output has now shifted and has a µ of 15.9 and a. σ of 0.1 oz. Cpk is less than 1, revealing that the process is not capable.")
51
Process Capability (2)
")
52
Capability Versus Control
Capable Not Capable In Control Out of Control IDEAL

53
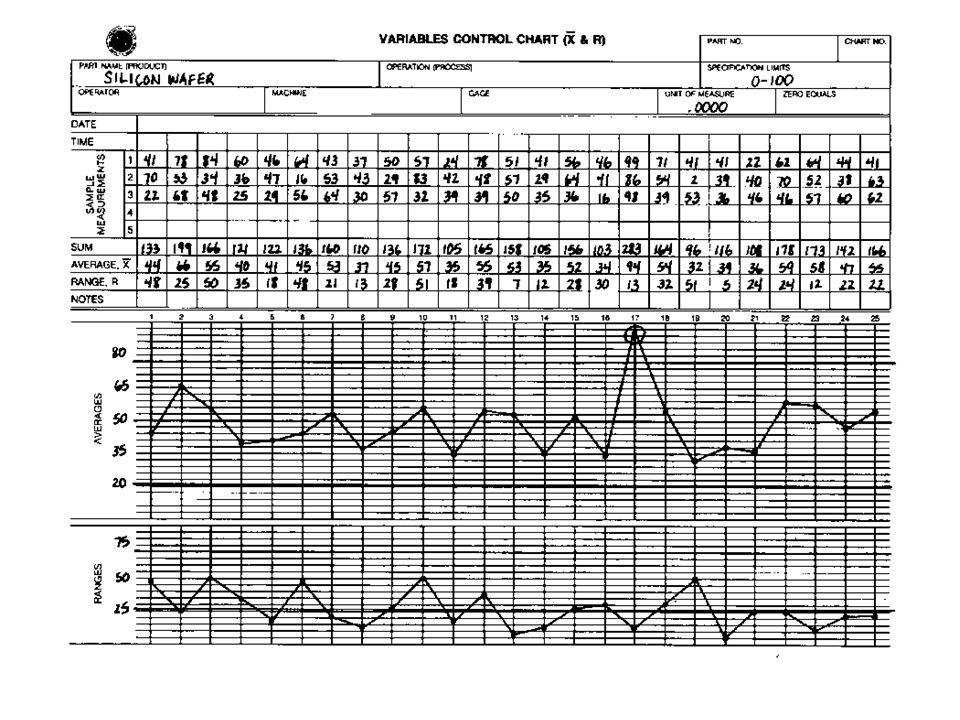
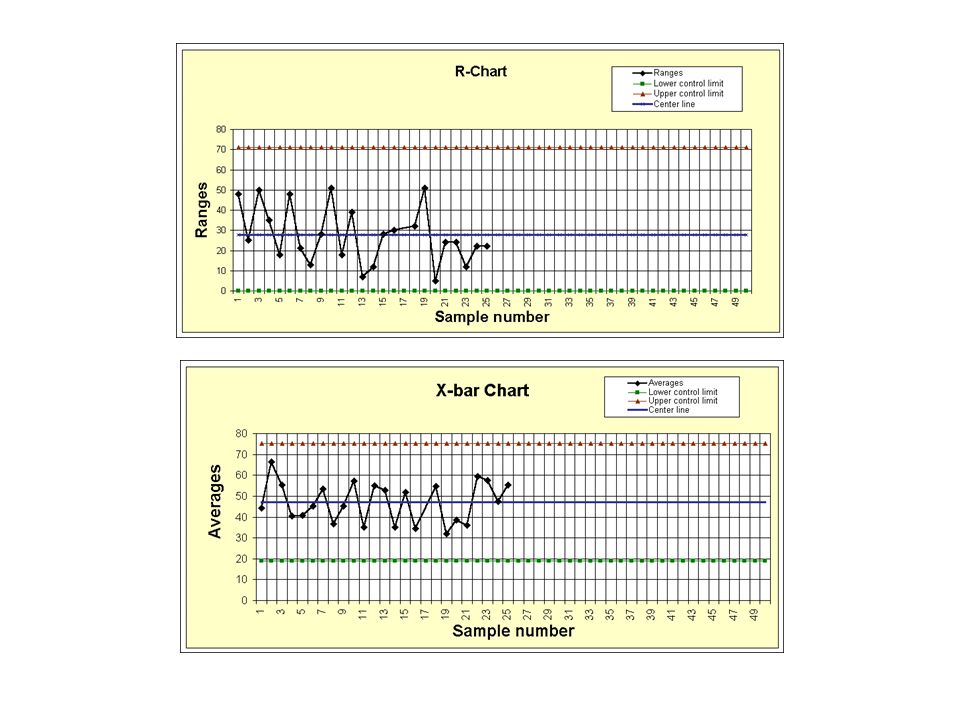
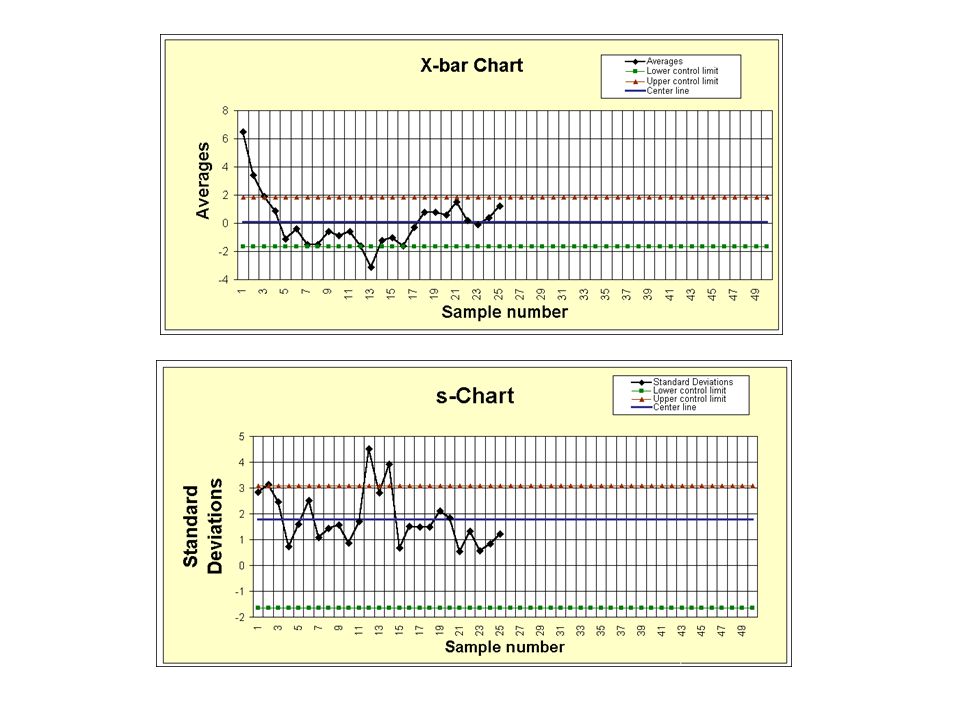
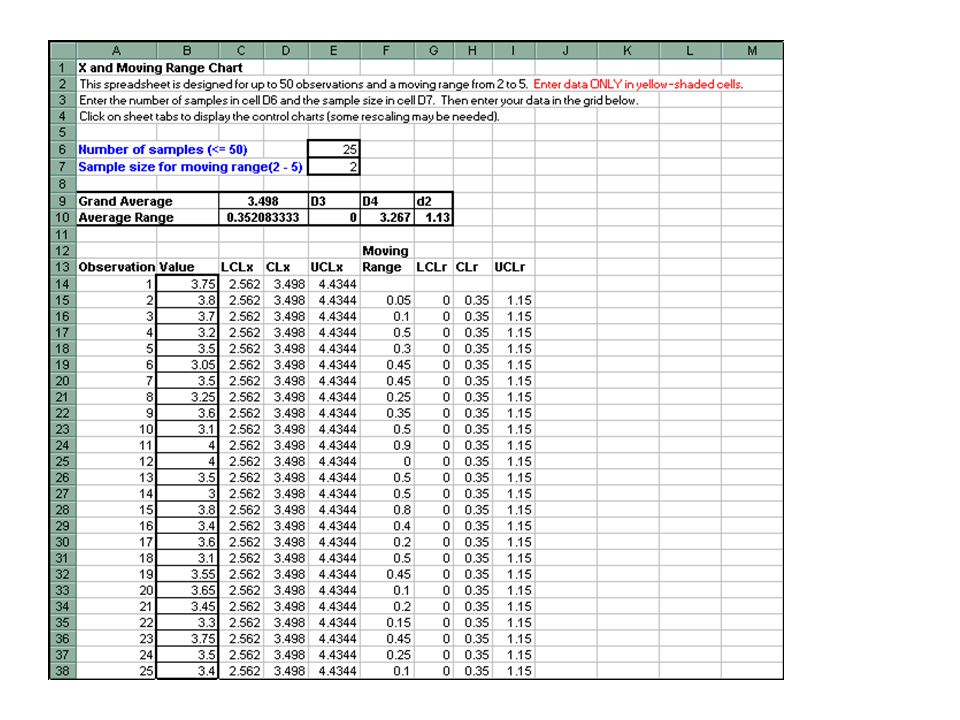
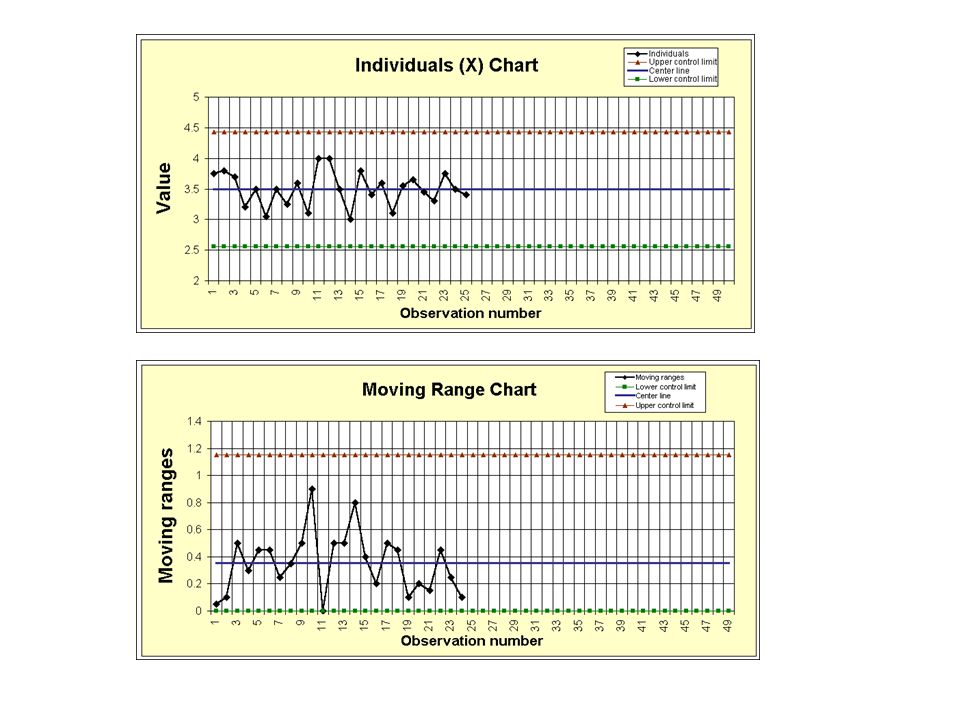
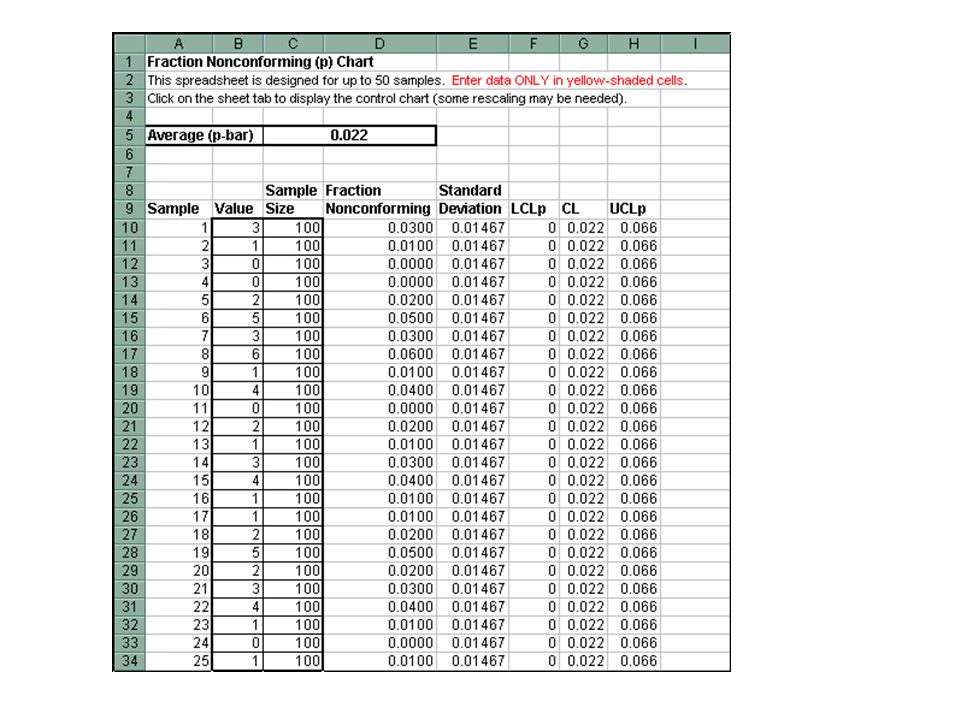
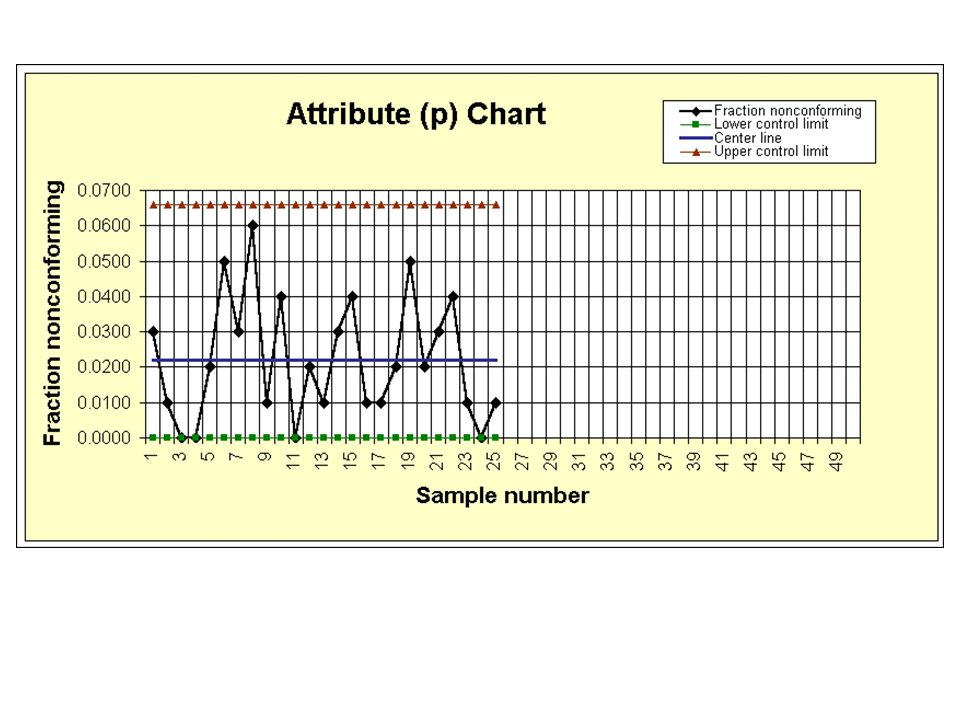
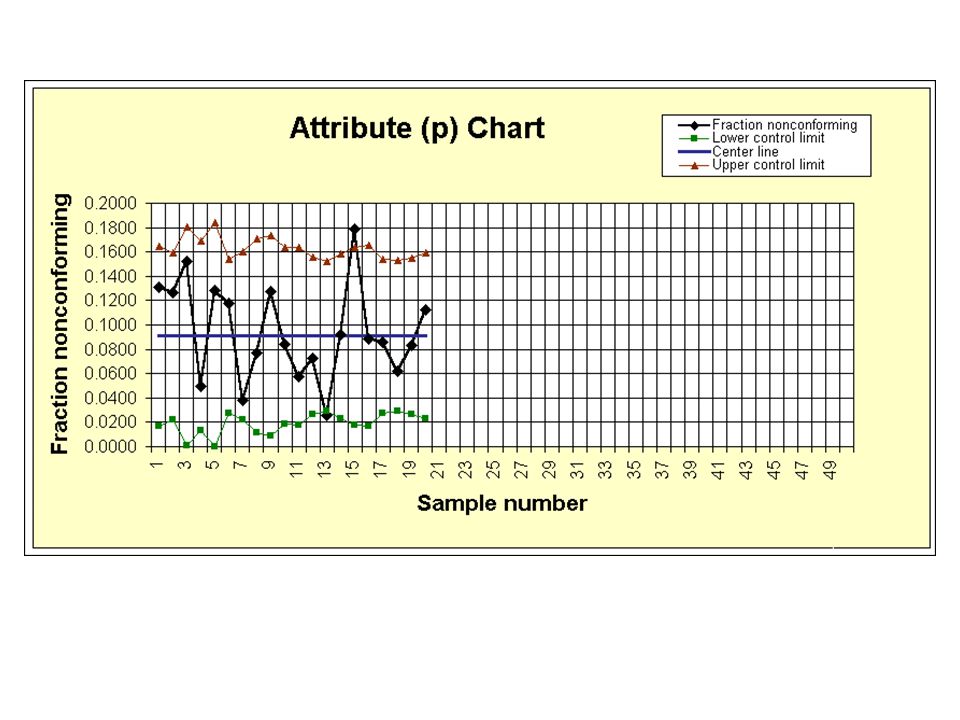
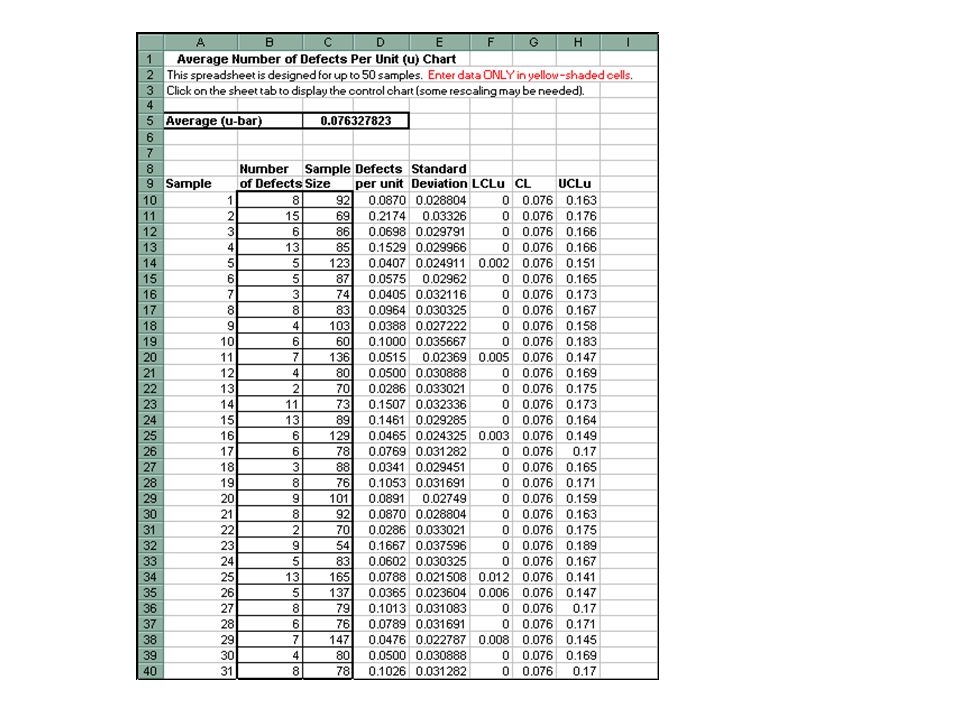
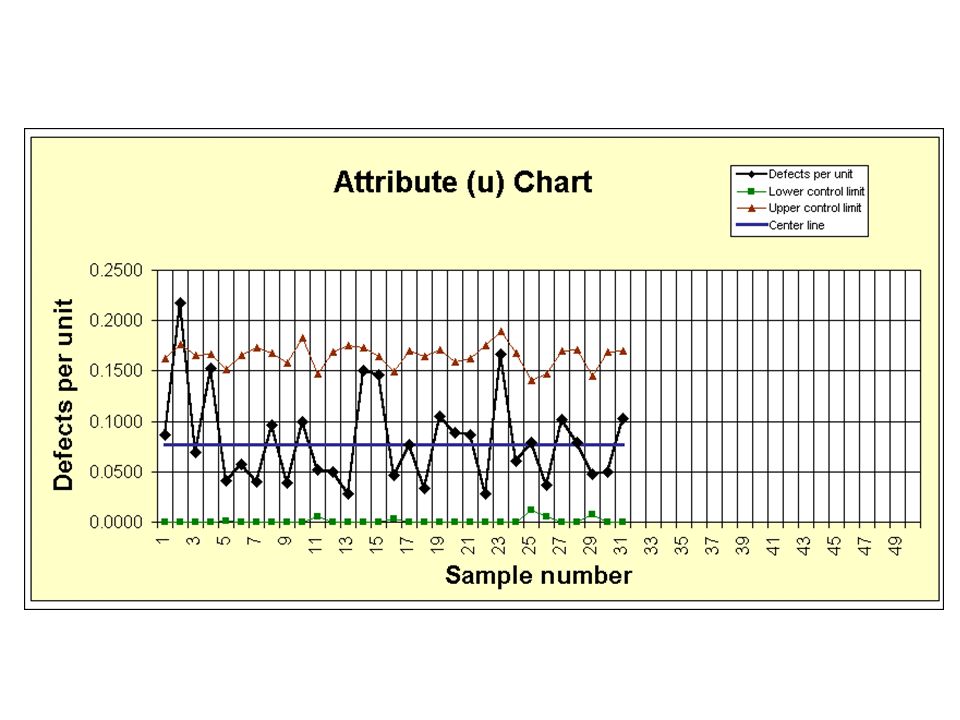
Excel Template

55
Special Variables Control Charts
x-bar and s charts x-chart for individuals

60
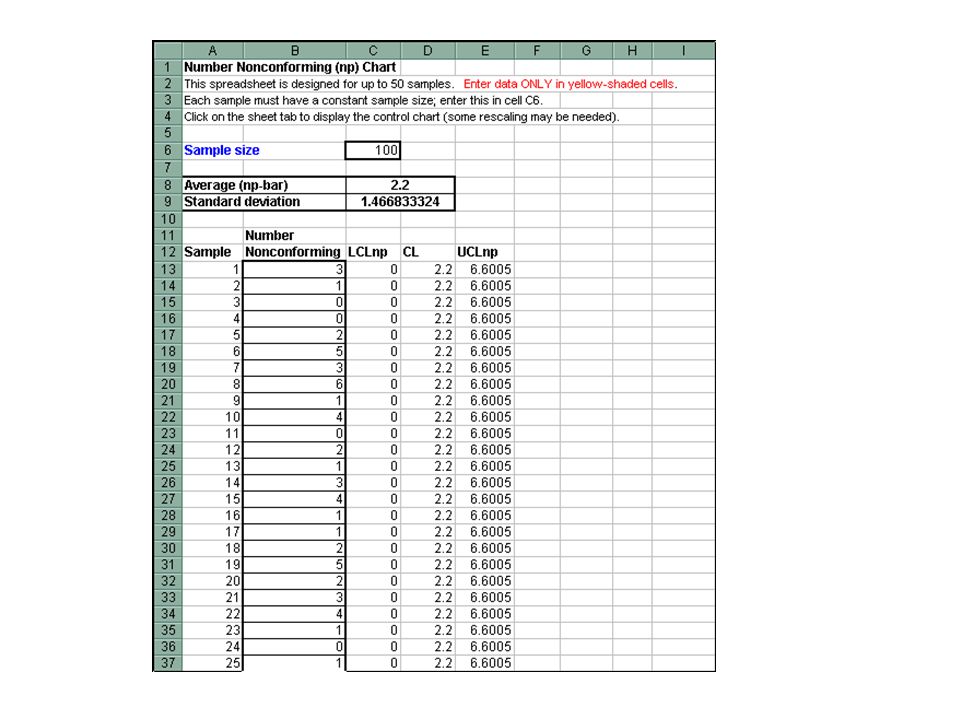
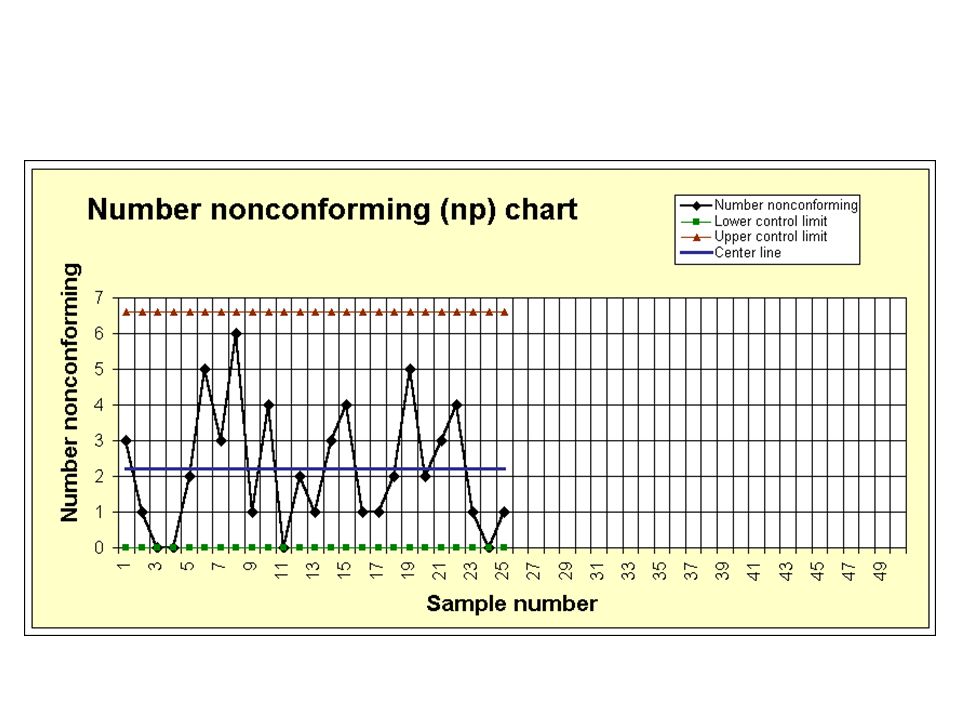
Charts for Attributes Fraction nonconforming (p-chart)
Fixed sample size Variable sample size np-chart for number nonconforming Charts for defects c-chart u-chart

71
p Chart Control Chart for Proportions
Is an attribute chart Shows Proportion of Nonconforming (Success ) Items E.g., Count # of nonconforming chairs & divide by total chairs inspected Chair is either conforming or nonconforming Used with Equal or Unequal Sample Sizes Over Time Unequal sizes should not differ by more than ±25% from average sample size
 Items. E.g., Count # of nonconforming chairs & divide by total chairs inspected. Chair is either conforming or nonconforming. Used with Equal or Unequal Sample Sizes Over Time. Unequal sizes should not differ by more than ±25% from average sample size.")
72
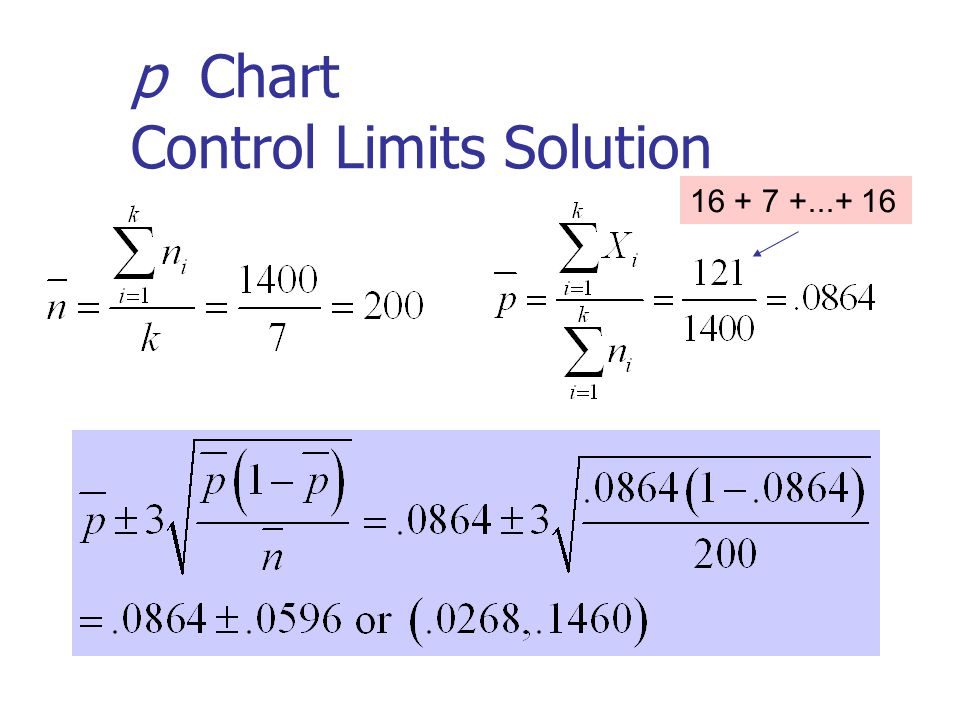
p Chart Control Limits Average Proportion of Nonconforming Items
Average Group Size # Defective Items in Sample i # of Samples Size of Sample i

73
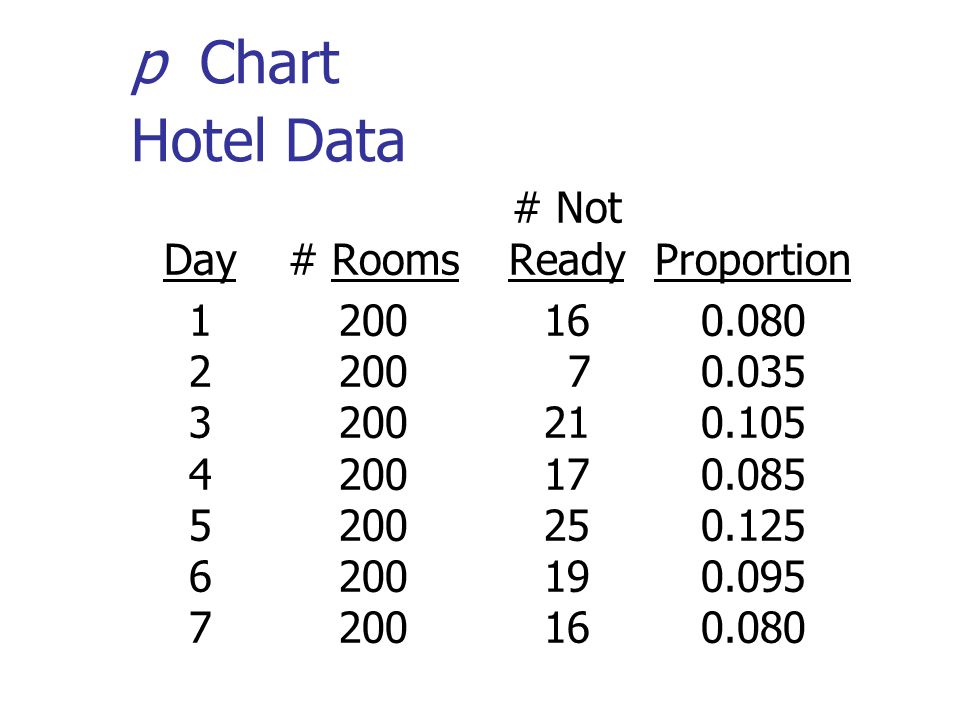
p Chart Example You’re manager of a 500-room hotel. You want to achieve the highest level of service. For 7 days, you collect data on the readiness of 200 rooms. Is the process in control?

74
p Chart Hotel Data # Not Day # Rooms Ready Proportion
75
p Chart Control Limits Solution
76
p Chart Control Chart Solution
0.15 UCL 0.10 Mean 0.05 LCL 0.00 1 2 3 4 5 6 7 Day Individual points are distributed around without any pattern. Any improvement in the process must come from reduction of common-cause variation, which is the responsibility of the management.

77
p Chart in PHStat PHStat | Control Charts | p Chart …
Excel Spreadsheet for the Hotel Room Example

78
Understanding Process Variability: Red Bead Example
Four workers (A, B, C, D) spend 3 days to collect beads, at 50 beads per day. The expected number of red beads to be collected per day per worker is 10 or 20%. Worker Day 1 Day 2 Day 3 All Days A (18%) 11 (12%) (12%) (17.33%) B (24%) 12 (24%) 8 (16%) (21.33%) C (26%) 6 (12%) (24%) (20.67%) D (14%) 9 (18%) 8 (16%) (16.0%) Totals
 spend 3 days to collect beads, at 50 beads per day. The expected number of red beads to be collected per day per worker is 10 or 20%. Worker Day 1 Day 2 Day 3 All Days. A 9 (18%) 11 (12%) 6 (12%) 26 (17.33%) B 12 (24%) 12 (24%) 8 (16%) 32 (21.33%) C 13 (26%) 6 (12%) 12 (24%) 31(20.67%) D 7 (14%) 9 (18%) 8 (16%) 24 (16.0%) Totals")
79
Understanding Process Variability: Example Calculations
Average Day 1 Day 2 Day 3 All Days X p 20.5% 19% 17% % _

80
Understanding Process Variability: Example Control Chart
UCL .30 .20 .10 _ p LCL 0 A1 B1 C1 D A2 B2 C2 D2 A3 B3 C3 D3

81
Morals of the Example Variation is an inherent part of any process.
The system is primarily responsible for worker performance. Only management can change the system. Some workers will always be above average, and some will be below.

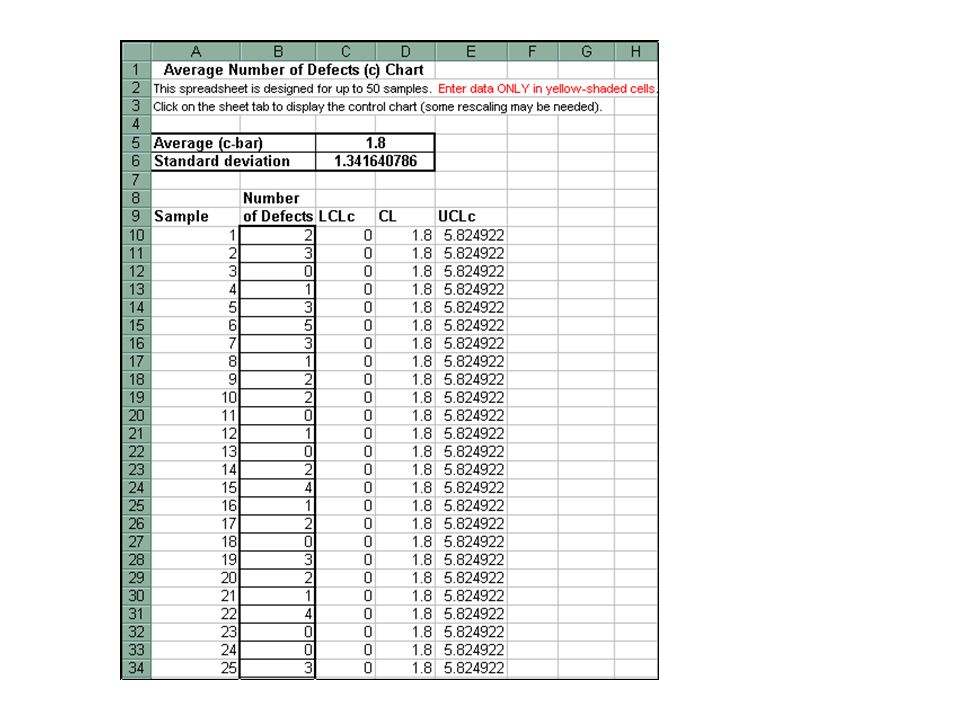
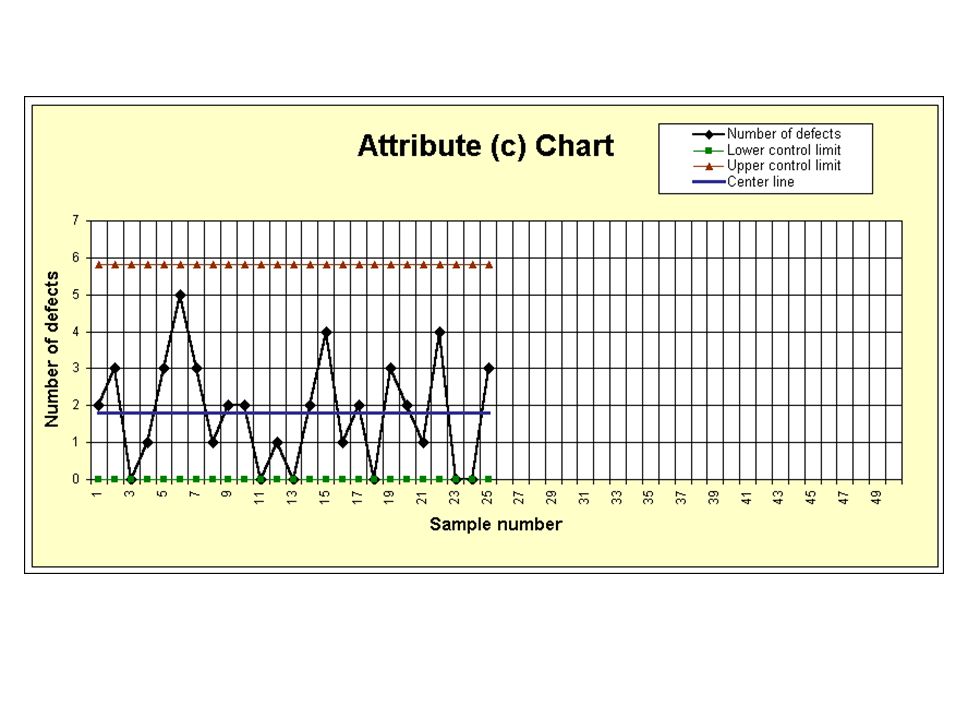
82
The c Chart Control Chart for Number of Nonconformities (Occurrences) in a Unit (an Area of Opportunity) Is an attribute chart Shows Total Number of Nonconforming Items in a Unit E.g., Count # of defective chairs manufactured per day Assume that the Size of Each Subgroup Unit Remains Constant

83
c Chart Control Limits Average Number of Occurrences
# of Occurrences in Sample i # of Samples

84
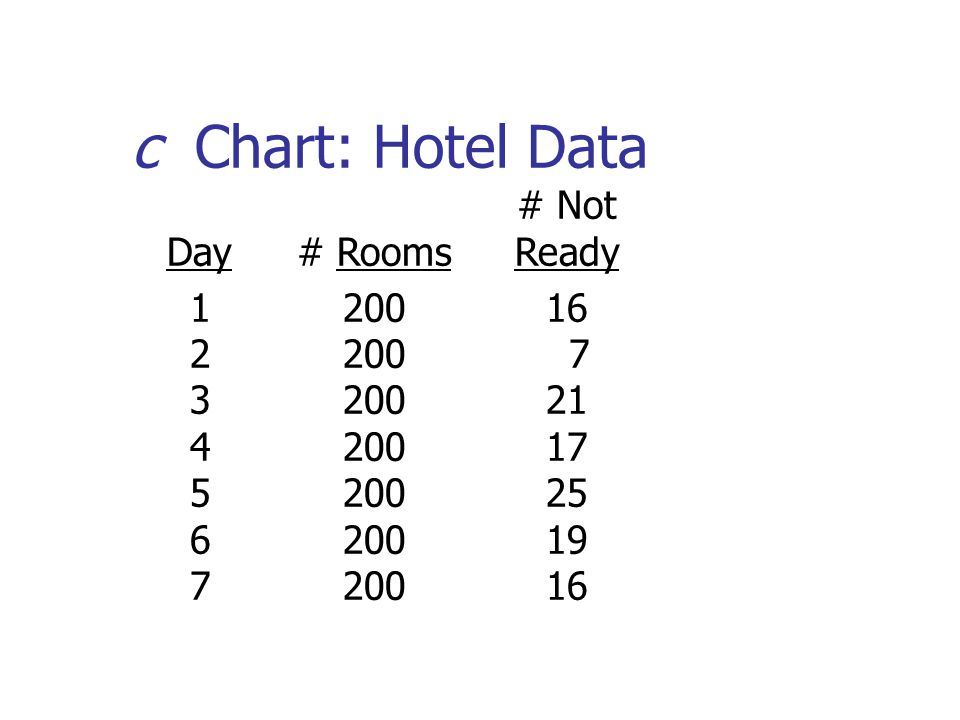
c Chart: Example You’re manager of a 500-room hotel. You want to achieve the highest level of service. For 7 days, you collect data on the readiness of 200 rooms. Is the process in control?

85
c Chart: Hotel Data # Not Day # Rooms Ready
86
c Chart: Control Limits Solution

87
c Chart: Control Chart Solution
30 UCL 20 10 LCL 1 2 3 4 5 6 7 Day Individual points are distributed around without any pattern. Any improvement in the process must come from reduction of common-cause variation, which is the responsibility of the management.

88
Variables Control Charts: R Chart
Monitors Variability in Process Characteristic of interest is measured on numerical scale Is a variables control chart Shows Sample Range Over Time Difference between smallest & largest values in inspection sample E.g., Amount of time required for luggage to be delivered to hotel room

89
R Chart Control Limits From Table Sample Range at Time i or Subgroup i
# Samples

90
R Chart Example You’re manager of a 500-room hotel. You want to analyze the time it takes to deliver luggage to the room. For 7 days, you collect data on 5 deliveries per day. Is the process in control?

91
R Chart and Mean Chart Hotel Data
Sample Sample Day Average Range

92
R Chart Control Limits Solution
From Table (n = 5)
")
93
R Chart Control Chart Solution
Minutes UCL 8 6 _ 4 R 2 LCL 1 2 3 4 5 6 7 Day

94
Variables Control Charts: Mean Chart (The Chart)
Shows Sample Means Over Time Compute mean of inspection sample over time E.g., Average luggage delivery time in hotel Monitors Process Average Must be preceded by examination of the R chart to make sure that the process is in control

95
Mean Chart Computed From Table Sample Mean at Time i
Sample Range at Time i # Samples

96
Mean Chart Example You’re manager of a 500-room hotel. You want to analyze the time it takes to deliver luggage to the room. For 7 days, you collect data on 5 deliveries per day. Is the process in control?

97
R Chart and Mean Chart Hotel Data
Sample Sample Day Average Range

98
Mean Chart Control Limits Solution
From Table E.9 (n = 5)
")
99
Mean Chart Control Chart Solution
Minutes UCL 8 _ _ 6 X 4 2 LCL 1 2 3 4 5 6 7 Day

100
R Chart and Mean Chart in PHStat
PHStat | Control Charts | R & Xbar Charts … Excel Spreadsheet for the Hotel Room Example

101
Process Capability Process Capability is the Ability of a Process to Consistently Meet Specified Customer-Driven Requirements Specification Limits are Set by Management in Response to Customer’s Expectations The Upper Specification Limit (USL) is the Largest Value that Can Be Obtained and Still Conform to Customer’s Expectation The Lower Specification Limit (LSL) is the Smallest Value that is Still Conforming
 is the Largest Value that Can Be Obtained and Still Conform to Customer’s Expectation. The Lower Specification Limit (LSL) is the Smallest Value that is Still Conforming.")
102
Estimating Process Capability
Must Have an In-Control Process First Estimate the Percentage of Product or Service Within Specification Assume the Population of X Values is Approximately Normally Distributed with Mean Estimated by and Standard Deviation Estimated by

103
Estimating Process Capability
(continued) For a Characteristic with an LSL and a USL where Z is a standardized normal random variable
 For a Characteristic with an LSL and a USL. where Z is a standardized normal random variable.")
104
Estimating Process Capability
(continued) For a Characteristic with Only a LSL where Z is a standardized normal random variable
 For a Characteristic with Only a LSL. where Z is a standardized normal random variable.")
105
Estimating Process Capability
(continued) For a Characteristic with Only a USL where Z is a standardized normal random variable
 For a Characteristic with Only a USL. where Z is a standardized normal random variable.")
106
Process Capability Example
You’re manager of a 500-room hotel. You have instituted a policy that 99% of all luggage deliveries must be completed within 10 minutes or less. For 7 days, you collect data on 5 deliveries per day. Is the process capable?

107
Process Capability: Hotel Data
Sample Sample Day Average Range

108
Process Capability: Hotel Example Solution
Therefore, we estimate that 99.38% of the luggage deliveries will be made within the 10 minutes or less specification. The process is capable of meeting the 99% goal.

109
Capability Indices Aggregate Measures of a Process’ Ability to Meet Specification Limits The larger (>1) the values, the more capable a process is of meeting requirements Measure of Process Potential Performance Cp>1 implies that a process has the potential of having more than 99.73% of outcomes within specifications
 the values, the more capable a process is of meeting requirements. Measure of Process Potential Performance. Cp>1 implies that a process has the potential of having more than 99.73% of outcomes within specifications.")
110
Capability Indices Measures of Actual Process Performance
(continued) Measures of Actual Process Performance For one-sided specification limits CPL (CPU) >1 implies that the process mean is more than 3 standard deviations away from the lower (upper) specification limit
 Measures of Actual Process Performance. For one-sided specification limits. CPL (CPU) >1 implies that the process mean is more than 3 standard deviations away from the lower (upper) specification limit.")
111
Capability Indices For two-sided specification limits
(continued) For two-sided specification limits Cpk = 1 indicates that the process average is 3 standard deviations away from the closest specification limit Larger Cpk indicates larger capability of meeting the requirements
 For two-sided specification limits. Cpk = 1 indicates that the process average is 3 standard deviations away from the closest specification limit. Larger Cpk indicates larger capability of meeting the requirements.")
112
Process Capability Example
You’re manager of a 500-room hotel. You have instituted a policy that all luggage deliveries must be completed within 10 minutes or less. For 7 days, you collect data on 5 deliveries per day. Compute an appropriate capability index for the delivery process.

113
Process Capability: Hotel Data
Sample Sample Day Average Range

114
Process Capability: Hotel Example Solution
Since there is only the upper specification limit, we need to only compute CPU. The capability index for the luggage delivery process is .8337, which is less than 1. The upper specification limit is less than 3 standard deviations above the mean.

115
Thank You

Similar presentations


 Theory of Process Management (Deming’s Fourteen points) The Theory of Control Charts Common Cause Variation.>")


. Quality of Manufacturing Process depends on Entry Criteria.>")


