Download presentation
Presentation is loading. Please wait.

2
http://press.princeton.edu/titles/8223.html
3
http://www.up.ethz.ch/people/ngruber/publications

4
Definition Definition: discipline studying the chemical reactions and processes within the ocean and those between the ocean and its borders Chemical oceanography mainly studies the cycles of the elements forming seawater, these are the biogeochemical cycles. => Movement of the elements and compounds within the organisms and the environment Gruber 2004 ESQUEMA CICLO DEL C, N, O 2, P EN EL OCÉANO Physical oceanography Biological oceanography Geological oceanography

5
Global carbon cycle +65 -125 1.7 Land use change +18 21.9 20 1.9 Land sink 1.6 +100 5.4 -220 +161 & the anthropogenic perturbation PgC/yr = 10 15 gC = 1 000 000 000 tons = 1 billón de kilos 1 tonelada = 1 000 000 gC = 1000 kilos

6
Relevance Relevance: inmense carbon reservoir, 50 times the carbon in the atmosphere, specially inorganic carbon air-sea exchange of CO2 is relatively quick the oceans absorb between 26 and 44% of the anthropogenic CO2 driven into the atmosphere the CO2 uptaken by the ocean: => it does not affect the earth radiactive balance => mitigates the greenhouse effect => sequestered on long time scales, much longer than in the terrestial biosphere Carbon accumulation on real scales Antia, NATO Summer School, Ankara, 2006 On a time scale of millenia: the oceans determine the CO2 concentration in the atmosphere

7
Fluxes in PgC/yr & stocks in PgC DIC: dissolved inorganic carbon; DOC: dissolved organic carbon POC: particulate organic carbon; PIC: particulate inorganic carbon = CaCO 3 NPP: net primary production

8
Chisholm, Nature 2000 Biological pump Physical or solubility pump Primary Prod. 100 Export > 100m 10 Sediments0.1 Temporal Scale 1 year 100-1000 years > 10 6 years weeks Photic layer, epi-pelagic Who plays here? Aphotic layer: meso & bati-pelagic

9
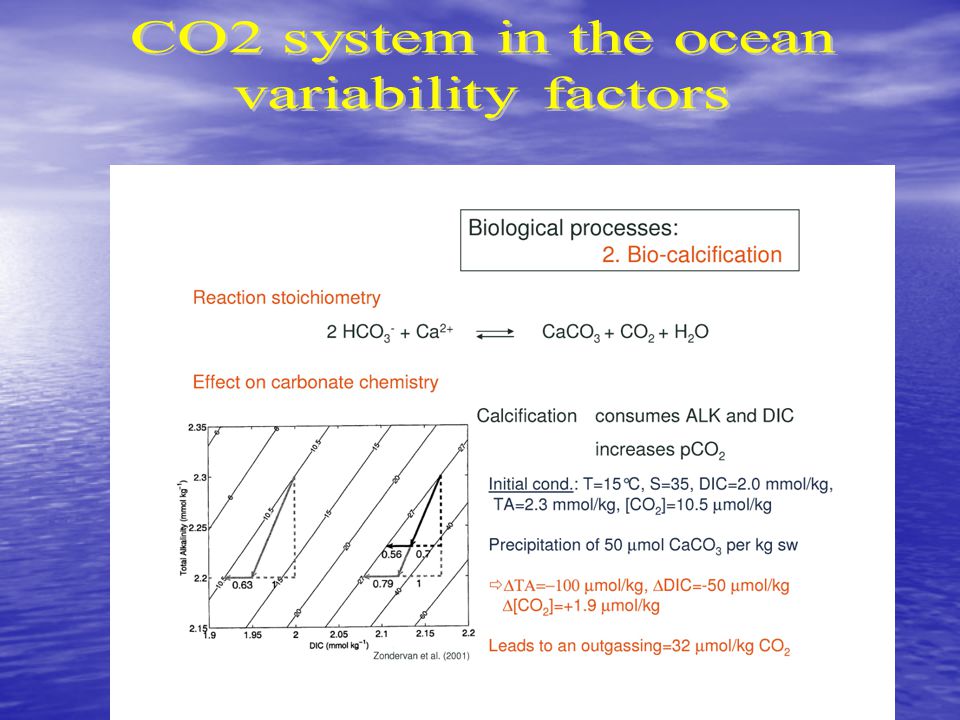
Biological processes: + soft-tissue pump: photosynthesis/ remineralization of OM + carbonate pump: formation/dissolution of CaCO 3 1 mol CaCO 3 => 0.6 mol CO 2

10
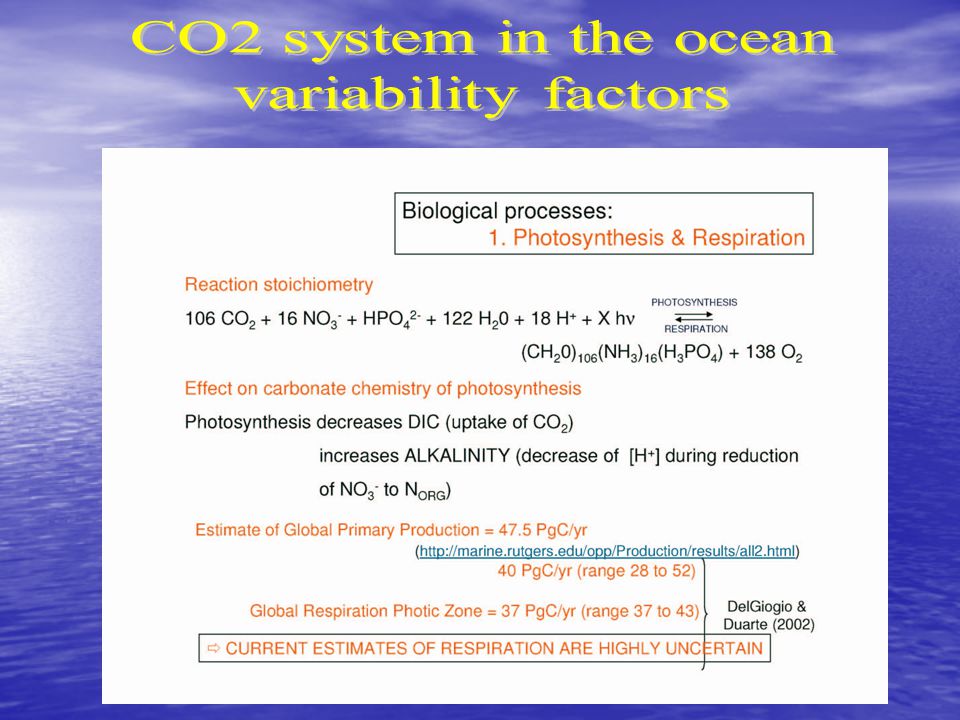
Organic matter synthesis – stoichiometry - Redfield ratios: Redfield ratios: + C:N:P:O 2 + 106:16:1:-138 + mean phyto composition (lipids + proteins + sugars + nucleid acids) in the ocean … BUT … it varies … + what else??
 in the ocean … BUT … it varies … + what else")
11
Organic matter synthesis- limiting factors - nutrients

12
Where do they come from? + atmosphere + lateral transport + vertical transport: upwelling, winter mixing, vertical mixing winter mixing, vertical mixing Chisholm, Nature 2000 Organic matter synthesis- limiting factors - nutrients

13
¿ De dónde vienen? + atmósfera + transporte lateral + transporte vertical: upwelling, winter mixing, vertical mixing Organic matter synthesis- limiting factors - nutrients

14
Organic matter synthesis – limiting factors – nutrients - light + ???? - light + ???? Euphotic zone: area well iluminated, where photosynthesis takes place, but it depends on turbidity, hours of light, balance between photosynthesis and respiration

15
Definitions P= phytoplancton Z= zooplancton B= bacteria DON: dissolved organic nitrogen PON: particulate organic nitrogen More concepts: More concepts: new, regenerated and export production Atmospheric input Vertical input Export as particulate Export or import as dissolved Production & recycling Mainly production N fixation f ratio = New Prod / Primary production e ratio = export prod / PP over long time and space scales f ratio = e ratio

16
Biological efficiency: Biological efficiency: capacity to consume the nutrients available in the photic zone

17
ICE: ICE: the marginal sea ice SP SP: subpolar ST-SS/PS ST-SS/PS: Subtropical Seasonally / Permanently Stratified EQ-D/EQ-U EQ-D/EQ-U: Equatorial downwelling/upwelling LL-U: LL-U: low-latitude upwelling biome OCEAN BIOMAS

18
The efficiency of the biological pump is inversely correlated to the efficiency in the export of organic matter out of the photic zone

19
The input of nutrients, light, physical conditions, etc.. Affect the efficiency of the biological pump, but the export mainly depends on the community structure, which organisms are in the photic zone. Export depends on temperature + nutrients input + Fe

21
1 mol CaCO 3 => 0.6 mol CO 2 Rain Ratio = POC / PIC export

22
La eficiencia del secuestro depende del transporte de carbono por debajo de la capa de mezcla invernal (WML) Secuestro de C = Flujo POC · [(Rain Ratio-0.6)/ Rain Ratio]
![La eficiencia del secuestro depende del transporte de carbono por debajo de la capa de mezcla invernal (WML) Secuestro de C = Flujo POC · [(Rain Ratio-0.6)/ Rain Ratio]](http://images.slideplayer.com/17/5393650/slides/slide_22.jpg "La eficiencia del secuestro depende del transporte de carbono por debajo de la capa de mezcla invernal (WML) Secuestro de C = Flujo POC · [(Rain Ratio-0.6)/ Rain Ratio]")
23
Producción primaria Secuestro de C bajo WML Moderada PP- Bajo secuestro – WML profundo Alta PP- Alto secuestro – WML somero Antia et al. (GBC, 2001)
.")
24
PgC/yr = 10 15 gC = 1 000 000 000 toneladas = 1 billón de kilos 1 tonelada = 1 000 000 gC = 1000 kilos

25
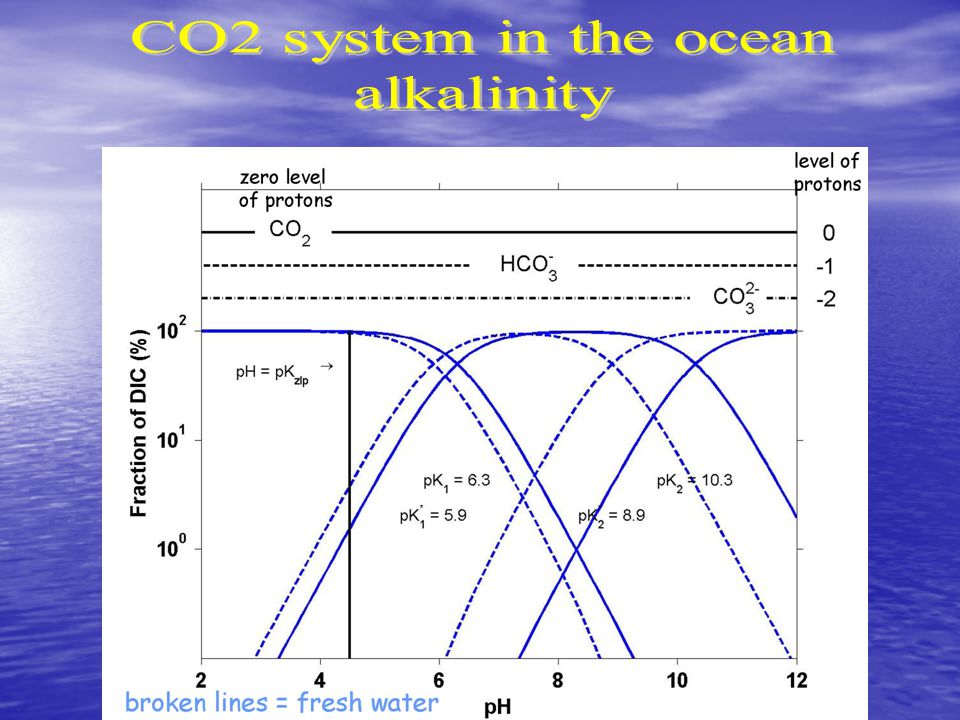
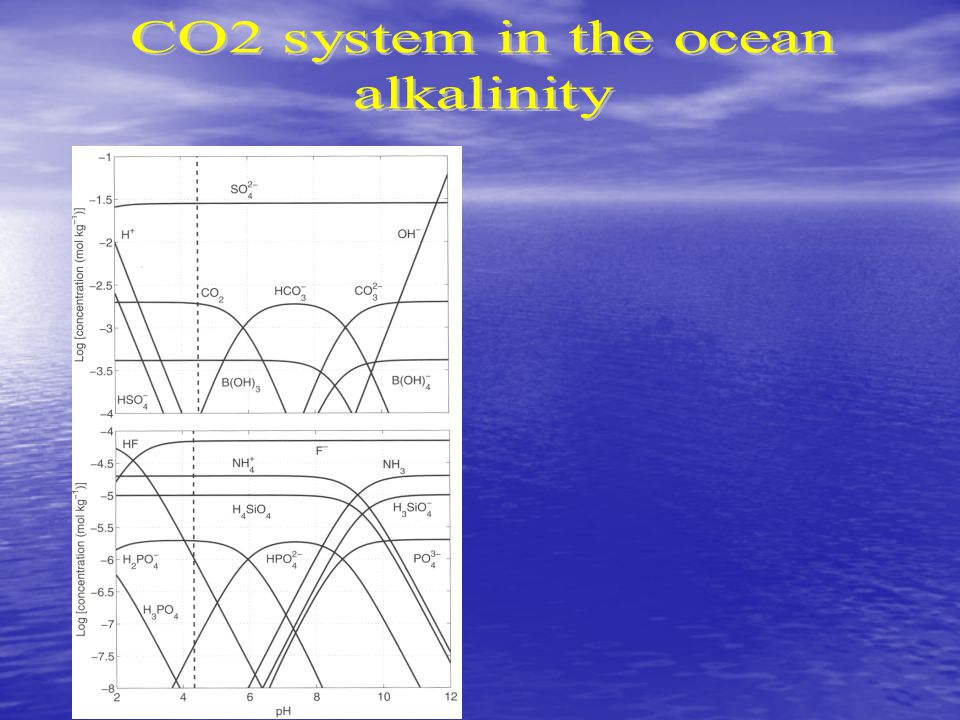
pH TIC Complex system Complex system: Equilibrium system controlled by T, S & pressure thanks to it, seawater is a weak alcaline buffer, pH varies within a 7.5 and 8.5 4 variables: TIC, pH, TA, fCO2

26
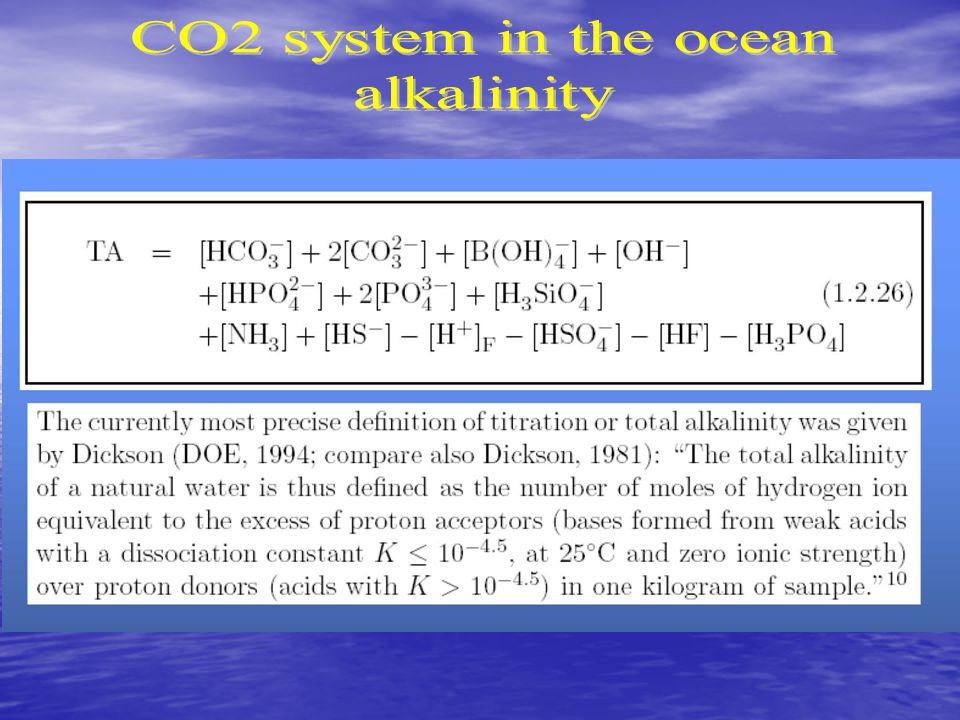
fCO 2 = x(CO 2 ) p atm = [CO 2 ]/ 0 (S,T) A T =[HCO 3 - ]+2· [ CO 3 2- ] + [ B(OH) 4 - ] + [ OH - ] - [ H 3 O + ] C T = [ CO 2 ] + [ HCO 3 - ] + [ CO 3 2- ] Mass balance Charge balance pH= -log [ H 3 O + ]
![fCO 2 = x(CO 2 ) p atm = [CO 2 ]/ 0 (S,T) A T =[HCO 3 - ]+2· [ CO 3 2- ] + [ B(OH) 4 - ] + [ OH - ] - [ H 3 O + ] C T = [ CO 2 ] + [ HCO 3 - ] + [ CO 3 2- ] Mass balance Charge balance pH= -log [ H 3 O + ]](http://images.slideplayer.com/17/5393650/slides/slide_26.jpg "fCO 2 = x(CO 2 ) p atm = [CO 2 ]/ 0 (S,T) A T =[HCO 3 - ]+2· [ CO 3 2- ] + [ B(OH) 4 - ] + [ OH - ] - [ H 3 O + ] C T = [ CO 2 ] + [ HCO 3 - ] + [ CO 3 2- ] Mass balance Charge balance pH= -log [ H 3 O + ]")
27
fCO 2 = x(CO 2 ) p atm = [CO 2 ]/ 0 (S,T) General rule: more dissolved CO2 in cold waters
![fCO 2 = x(CO 2 ) p atm = [CO 2 ]/ 0 (S,T) General rule: more dissolved CO2 in cold waters](http://images.slideplayer.com/17/5393650/slides/slide_27.jpg "fCO 2 = x(CO 2 ) p atm = [CO 2 ]/ 0 (S,T) General rule: more dissolved CO2 in cold waters")
28
C T = [ CO 2 ] + [ HCO 3 - ] + [ CO 3 2- ] Mass balance (C T a.k.a. CO 2 or DIC or TIC) Independent of T & Pr pH TIC 1% 85% 14%
![C T = [ CO 2 ] + [ HCO 3 - ] + [ CO 3 2- ] Mass balance (C T a.k.a.](http://images.slideplayer.com/17/5393650/slides/slide_28.jpg " CO 2 or DIC or TIC) Independent of T & Pr pH TIC 1% 85% 14%.")
35
Explicit approach: 5 species (unknowns) H 2 CO 3 *, HCO 3 –, CO 3 –2, H +, OH – 3 equilibrium equations K 1, K 2, Kw 1 concentration condition C T 1 proton condition Alk Any two carbonate system parameters fix the values of all the rest: C T, Alk, H 2 CO 3 * (or pCO 2 ), HCO 3 –, CO 3 –2, pH
 H 2 CO 3 *, HCO 3 –, CO 3 –2, H +, OH – 3 equilibrium equations K 1, K 2, Kw 1 concentration condition C T 1 proton condition Alk Any two carbonate system parameters fix the values of all the rest: C T, Alk, H 2 CO 3 * (or pCO 2 ), HCO 3 –, CO 3 –2, pH")
36
+ Table 2 Millero et al. (1993) showing estimates of the analytical precision (reproducibility) and accuracy of measurements of pH, TA, TIC and fCO 2 : Analysis Precision Accuracy Reference pH (spectrofot.) ± 0.0004 ± 0.002 Clayton & Byrne (1993) TA (potentiom.) ± 2 umol/kg ± 4 umol/kg Millero et al. (1993) TIC (coulometric) ± 1 umol/kg ± 2 umol/kg Johnson et al. (1993) fCO 2 (infrared) ± 0.5 uatm ± 2 uatm Wannikhof & Thoning (1993)
 showing estimates of the analytical precision (reproducibility) and accuracy of measurements of pH, TA, TIC and fCO 2 : Analysis Precision Accuracy Reference pH (spectrofot.) ± ± Clayton & Byrne (1993) TA (potentiom.) ± 2 umol/kg ± 4 umol/kg Millero et al. (1993) TIC (coulometric) ± 1 umol/kg ± 2 umol/kg Johnson et al. (1993) fCO 2 (infrared) ± 0.5 uatm ± 2 uatm Wannikhof & Thoning (1993).")
37
+ Table 3 Millero et al. (1993) with the estimated errors in the calculated parameters of the CO 2 system using various input measurements Input pH TA TIC fCO 2 Accuracy ±0.002 ±2 umol/kg ±2 umol/kg ±2 uatm. pH-TA ± 3.8 ± 2.1 pH-TIC ± 2.7 ± 1.8 pH-fCO 2 ± 21 ± 18 fCO 2 -TIC ± 0.0025 ± 3.4 fCO 2 -TA ± 0.0026 ± 3.2 TA-TIC ± 0.0062 ± 5.7 Total error: squared root of the errors due to each input parameter
 with the estimated errors in the calculated parameters of the CO 2 system using various input measurements Input pH TA TIC fCO 2 Accuracy ±0.002 ±2 umol/kg ±2 umol/kg ±2 uatm. pH-TA ± 3.8 ± 2.1 pH-TIC ± 2.7 ± 1.8 pH-fCO 2 ± 21 ± 18 fCO 2 -TIC ± ± 3.4 fCO 2 -TA ± ± 3.2 TA-TIC ± ± 5.7 Total error: squared root of the errors due to each input parameter.")
38
pH increase Zeebe and Wolf-Galdrow (2001) Three pumps: - gas-exchange: T + bio - Soft tissue - Carbonate Chisholm, Nature 2000
 Three pumps: - gas-exchange: T + bio - Soft tissue - Carbonate Chisholm, Nature 2000")
41
Factores físicos: + intercambio aire-agua + disolución en el agua

42
Physical factors: + air-sea exchange Piston velocity, units of velocity

43
¿CO2 equilibration time in the mixed layer?

45
Takahashi et a. (DSRII, 2002) Questions: + why are there sinks and sources of CO2 ? + what factors control pCO 2 ?

46
Physical factors: + temperature + salinity pCO2 = 300 uatm, T= 20, S=35 - 1ºC increase in T => +13 uatm - 1 unit increase in S => + 9 uatm

47
Quantification of the biological and physical factors: Seasonal variations in Temp are high in subtropical areas, tropical and polar areas have limited variability in T and so on pCO 2 temp

48
pCO2 decreases due to biological activity (photosynthesis) north of 40ºN, subpolar areas, upwelling areas. Quantification of the biological and physical factors:

49
Biology: green-blue, high north latitudes, Eq. Pacific, SO Temp: temperate & subtropical areas !!: areas of water mass formation, biology predominates. Quantification of the biological and physical factors:

50
The Royal Society (2005)
")
52
Caldeira & Wickett (2003) Oceanography (Vol 17, 2004)
 Oceanography (Vol 17, 2004)")
54
Global mean profiles of the three main carbon pumps. Sarmiento & Gruber (2006)
")
55
NTA = TA*35 / Sal

56
Relevance of the coast LOICZ, 2006

57
Relevancia costas: ocupan ± 20% de la superficie del océano contienen más de un 40% de la población mundial proveen de 75% de las capturas de pesca representan un 25% de la PP directamente afectadas por la actividad humana (contaminación, eutrofización): ríos, aerosoles en atmósfera, interacción tierra-océano-atmósfera-sedimentos en escalas de años. muy heterogéneas y dinámicas, vehículo conductor de carbono hacia el interior del océano. proyectos: LOICZ (1992-2005-2012), CARBOOCEAN (2005- 2009)
, CARBOOCEAN ( ).")
58
0.24 PIC 0.32 POC 33.6 DIC, 1.44 DOC, 0.012 PIC, 0.26 POC 33.92 DIC, 0.84 DOC 0.048 POC CARBON budget (PgC y -1 ) in the continental margins 0.18 PIC 0.18 POC River, drainage & ice Primary Prod: 0.48 PIC, 6.19 POC New Prod.: 0.28 DOC, 0.23 PIC, 0.50 POC Coast & open platforms0.38 DIC, 0.32 DOC, 0.18 PIC, 0.22 POC 0.0012 CH 4 from sediments 0.0017 DMS from biolog. Act. Sediments & fishery Open ocean Mixed layer Deep layer Sediments 0.0036 C Precipitation & dust Atmosphere Chen (2004) Chen & Borges (2009) 0.31 IC (DIC) 0.81 OC (74% DOC) Net sink of CO 2 CONTINENTAL SHELF PUMP ?????????? ????? ????? Wollast (1998) 0.36 CO 2 New Prod 0.25 PIC 0.0008 DMS
 Chen & Borges (2009) 0.31 IC (DIC) 0.81 OC (74% DOC) Net sink of CO 2 CONTINENTAL SHELF PUMP Wollast (1998) 0.36 CO 2 New Prod 0.25 PIC DMS.")
59
Net air-sea CO 2 flux on european coasts Borges et al., ECSS, 2006 Frankingnoulle & Borges GBC 2001

60
Borges et al., ECSS, 2006 Golfo de Vizcaya -0.8 molC m -2 yr -1 Net air-sea CO 2 flux on european coasts

Similar presentations


 2- CARBON production during the Antropocene: sinks, sources, and storage.>")


![Glacial atmospheric CO 2 lowering must be due to greater storage in ocean at equilibrium, atmospheric pCO 2 determined by Henry’s Law pCO 2 = [CO 2 ] /](/14/4335321/big_thumb.jpg "Glacial atmospheric CO 2 lowering must be due to greater storage in ocean at equilibrium, atmospheric pCO 2 determined by Henry’s Law pCO 2 = [CO 2 ] />")


 to euphotic zone Photosynthesis (Dissolved Inorg Particulate Organic Matter) Recycling.>")


