Download presentation
Presentation is loading. Please wait.

1
Yan Y. Kagan Dept. Earth and Space Sciences, UCLA, Los Angeles, CA 90095-1567, ykagan@ucla.edu, http://scec.ess.ucla.edu/ykagan.htmlykagan@ucla.edu Earthquake forecast with CMT vs PDE catalogs CSEP Global Collaboration & Testing Meeting Monday, April 21, 2008 http://moho.ess.ucla.edu/~kagan/CSEP21.ppt

2
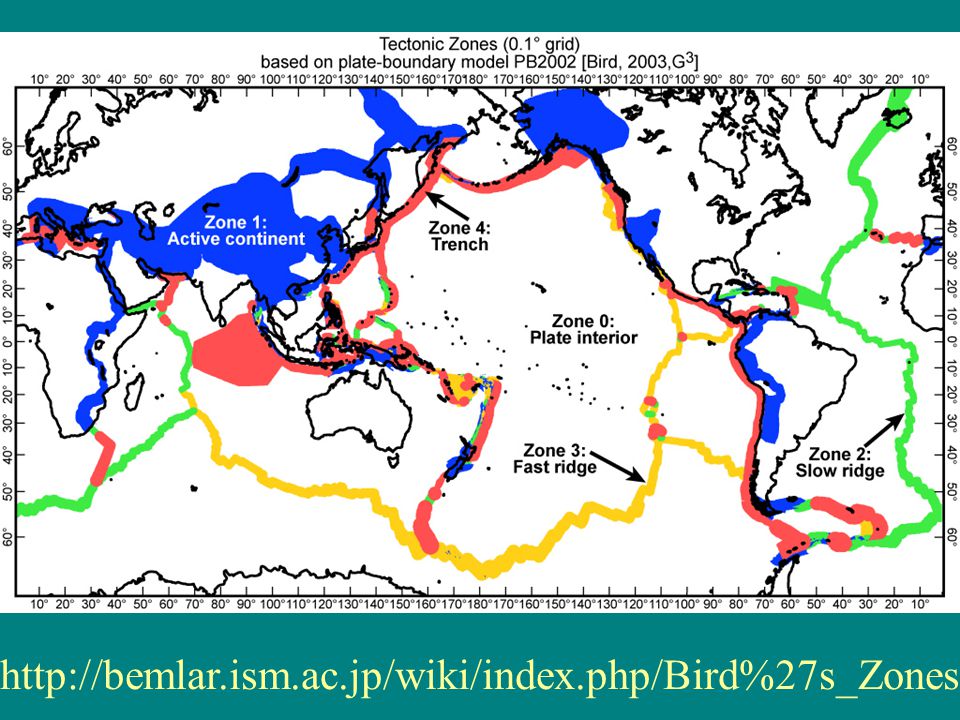
http://bemlar.ism.ac.jp/wiki/index.php/Bird%27s_Zones
3
CMT catalog: Shallow earthquakes, 1976-2005

4
PARAMETER VALUES FOR VARIOUS SUBDIVISIONS OF CMT CATALOG, 1982--2007/03/31, Mw>=5.6 -------------------------------------------------------- All Subd. Orog. Inter. Fast Slow -------------------------------------------------------- 1. N 7720 5022 1004 279 584 831 2 Mmax 9.07 9.07 8.28 8.15 7.67 7.15 3. Inf/N 1.03 1.18 1.11 0.59 0.30 0.44 4. Ind/N 0.745 0.690 0.819 0.866 0.935 0.941 5. \mu 0.131 0.169 0.093 0.099 0.042 0.035 6. b 1.02 0.98 0.96 1.05 1.28 1.23 7. \delta 0.43 0.39 0.37 0.30 0.35 0.39 8. \theta 0.12 0.11 0.27 *0.1 0.27 *1.0 9. \sigma 0.30 0.29 0.15* 0.47 0.17 0.27 10. \eps_r 21.8 22.1 21.6 18.0 19.5 17.7 11. \eps_h 3.5 4.4 3.0* 5.1 3.0* 3.0* -------------------------------------------------------- \sigma – focal size for M4 EQ; \eps_r – horizontal error; \eps_h – vertical error http://bemlar.ism.ac.jp/wiki/index.php/Bird%27s_Zones

5
NW Pacific -- Here we demonstrate forecast effectiveness: displayed earthquakes (108 events) occurred after smoothed seismicity forecast had been calculated.
 occurred after smoothed seismicity forecast had been calculated.")
6
SW Pacific -- Here we demonstrate forecast effectiveness: displayed earthquakes (170 events) occurred after smoothed seismicity forecast had been calculated.
 occurred after smoothed seismicity forecast had been calculated.")
7
1080 events (10 times the actual number of events in 2004-06) have been simulated, using the forecast density. Some points overlap; in low activity area we specified some low-level density to avoid surprises.

8
World seismicity: 1990 – 2000 (PDE)
")
9
PARAMETER VALUES FOR VARIOUS SUBDIVISIONS OF PDE CATALOG, 1968--2007/01/01, M>=5.0 -------------------------------------------------------- All Subd. Orog. Inter. Fast Slow -------------------------------------------------------- 1. N 45942 29980 7686 2191 3296 2789 2. Mmax 8.80 8.80 8.50 8.45 7.60 7.30 3. Inf/N 1.90 1.99 2.16 1.40 1.28 0.98 4. Ind/N 0.680 0.661 0.687 0.716 0.816 0.869 5. \mu 0.141 0.140 0.133 0.234 0.182 0.109 6. b 1.05 1.04 1.05 1.17 1.17 0.93 7. \delta 0.42 0.43 0.43 0.23 0.02 0.12 8. \theta 0.28 0.33 0.23 0.12 0.40 0.55 9. \sigma 0.38 0.37 0.31 0.24 0.15* 0.20 10. \eps_r 9.5 9.7 7.9 9.8 10.1 12.6 11. \eps_h 3.0* 4.5 4.3 3.0* 3.0* 3.0* -------------------------------------------------------- \sigma – focal size for M4 EQ; \eps_r – horizontal error; \eps_h – vertical error http://bemlar.ism.ac.jp/wiki/index.php/Bird%27s_Zones

10
PARAMETER VALUES FOR VARIOUS SUBDIVISIONS OF PDE CATALOG,1968--2007/01/01, M>=5.0; CLOSE AFTERSHOCKS REMOVED (6.5%) -------------------------------------------------------- All Subd. Orog. Inter. Fast Slow -------------------------------------------------------- 1. N 42925 27648 7205 2127 3217 2728 2. Mmax 8.80 8.80 8.50 8.45 7.60 7.30 3. Inf/N 1.25 1.24 1.50 1.17 1.04 0.76 4. Ind/N 0.695 0.674 0.709 0.736 0.831 0.881 5. \mu 0.171 0.177 0.146 0.241 0.185 0.121 6. b 1.04 1.03 1.04 1.17 1.17 0.93 7. \delta 0.38 0.37 0.41 0.18 0.0* 0.0* 8. \theta 0.11 0.13 0.10 0.1* 0.32 0.39 9. \sigma 0.37 0.35 0.32 0.15* 0.15* 0.15* 10. \eps_r 9.7 9.8 7.8 9.7 10.0 12.5 11. \eps_h 3.0* 4.8 4.7 3.0* 3.0* 3.0* -------------------------------------------------------- \sigma – focal size for M4 EQ; \eps_r – horizontal error; \eps_h – vertical error http://bemlar.ism.ac.jp/wiki/index.php/Bird%27s_Zone s

11
NW Pacific -- Here we demonstrate forecast effectiveness: displayed earthquakes M>=5.0 occurred after smoothed seismicity forecast had been calculated.

13
Forecast with CMT vs PDE catalogs The CMT catalog has moment-tensor solutions, hence focal mechanisms can be forecasted. However, the present method can be extended only for subduction zones. The PDE catalog has lower magnitude threshold (4.8 vs 5.8 for CMT). The present methodology can be used for global forecast. A program can be easily designed to issue within a few minutes long- and short-term forecasts with the PDE catalog at the arbitrary spatial window.
. The present methodology can be used for global forecast. A program can be easily designed to issue within a few minutes long- and short-term forecasts with the PDE catalog at the arbitrary spatial window..")
14
END Thank you

Similar presentations


 earthquake near Sendai, east coast of Honshu, Japan Friday, March 11, 2011 at 05:46:23 UTC Japan was struck by a magnitude 8.9 (9.0)>")


 Yan Y. Kagan Department of Earth and Space Sciences, University of.>")


