Download presentation
Presentation is loading. Please wait.

1
Trading to Improve Water Quality Webcast December 14, 2005 Lynda Hall U.S. Environmental Protection Agency and and Sonja Biorn-Hansen Oregon Department of Environmental Quality 1

2
What We’ll Cover What is trading? What is trading? How does trading work? How does trading work? –Setting trading boundaries, defining credits, identifying buyers and sellers Project examples Project examples Where does trading work? For what pollutants? Where does trading work? For what pollutants? Benefits and challenges of trading Benefits and challenges of trading 2

3
What We’ll Cover Key functions for all trading programs Key functions for all trading programs –CWA compliance, public information, connecting buyers/sellers Trading to reduce thermal load in the Tualatin River, Oregon Trading to reduce thermal load in the Tualatin River, Oregon Where is trading occurring now? Where is trading occurring now? What’s next for trading What’s next for trading Where to get more information Where to get more information 3

4
What is “Trading”? Cap and trading Cap and trading Emissions trading Emissions trading Pollutant trading Pollutant trading Effluent trading Effluent trading Offsets Offsets Mitigation Mitigation 4

5
‘Trading’ is a general approach useful for many environmental problems Lead in gasoline phasedown 1980’s Lead in gasoline phasedown 1980’s Acid rain – 1990’s Acid rain – 1990’s Wetlands mitigation Wetlands mitigation Endangered species habitat Endangered species habitat Streambank restoration Streambank restoration Greenhouse gas reduction Greenhouse gas reduction Water quality trading Water quality trading 5

6
What is Water Quality Trading (WQT) ? Watershed management approach suited to particular water quality challenges Watershed management approach suited to particular water quality challenges Based in economic market principles Based in economic market principles –Sources facing higher pollutant control costs may purchase environmentally equivalent pollutant reductions from another source at lower cost Voluntary, but integrated and consistent with Clean Water Act regulations Voluntary, but integrated and consistent with Clean Water Act regulations –An approach to meeting CWA goals, not an alternative to them 6

7
How Trading Works A ‘ cap ’ or limit is placed on the total amount of pollutant that can be released from all sources A ‘ cap ’ or limit is placed on the total amount of pollutant that can be released from all sources –Timeframe is established to meet cap Sources receive an allocation, i.e., authorization to release a given amount of pollutant Sources receive an allocation, i.e., authorization to release a given amount of pollutant Sources can meet their allocation by: Sources can meet their allocation by: –Making all necessary reductions on-site OR –Buying additional allocations - credits - from other sources that have reduced pollutants below their own allocation 7

8
The WQT ‘cap’ is often a TMDL Or other consensus water quality goal Or other consensus water quality goal TMDLs are the most common WQT caps TMDLs are the most common WQT caps –Establish pollutant ‘budget’ sufficient to achieve water quality standards –PS are assigned individual wasteload allocations –Implemented via water quality-based effluent limits in NPDES permits NPS are assigned load allocations by category NPS are assigned load allocations by category –Not enforceable under CWA –Trading can provide incentives for NPS pollutant reductions Introduction 8

9
How Trading Works, cont’d The exchange of credits to meet the water quality cap is ‘ trading ’ The exchange of credits to meet the water quality cap is ‘ trading ’ –BUYERS have high pollutant control costs –SUPPLIERS have lower costs WQT takes different forms WQT takes different forms –Point/point source trades among NPDES facilities Watershed scale; implemented via group permit Watershed scale; implemented via group permit –Point/nonpoint source trades So far limited to offsets for a single NPDES facility So far limited to offsets for a single NPDES facility –Point/nonpoint source trading on a watershed scale 9

10
PS/PS PS/NPS Single facility 10

11
Watershed Scale PS/NPS Trading Several programs under development Several programs under development –Passaic River, NJ –Cape Fear River, NC –Kalamazoo River, MI –Miami River, OH –others 11

12
Questions? 12

13
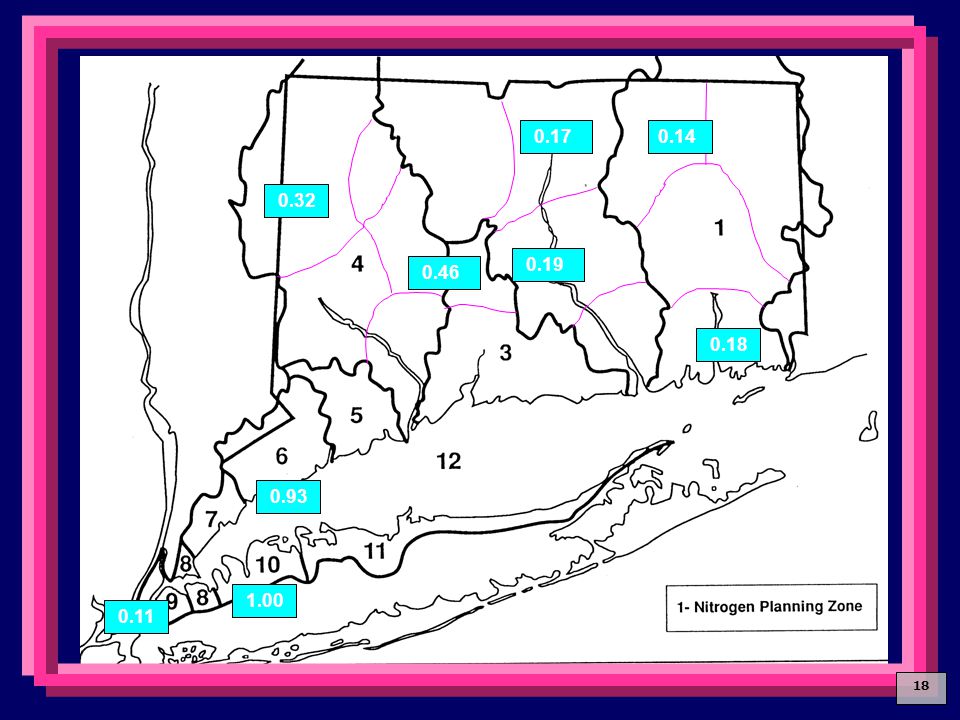
Example: Seasonal Hypoxia in Long Island Sound Excessive nutrient loadings contribute to hypoxic zone in Long Island Sound each summer Excessive nutrient loadings contribute to hypoxic zone in Long Island Sound each summer To eliminate hypoxia, Connecticut TMDL calls for 64% nitrogen reduction among 79 wastewater treatment plants by 2014 To eliminate hypoxia, Connecticut TMDL calls for 64% nitrogen reduction among 79 wastewater treatment plants by 2014 Challenging goal, potential price tag $1 billion Challenging goal, potential price tag $1 billion 13

14
14

15
Each facility was allocated a percentage of the total statewide TMDL loading equal to their percentage contribution to the statewide current discharge flow rate. FlowLoad 15% 2000 2014 15

16
Nitrogen Cap and Trade: Long Island Sound CT established a Nitrogen Exchange allowing WWTPs to CT established a Nitrogen Exchange allowing WWTPs to –reduce nitrogen or –buy nitrogen reductions from the Exchange or –over-control nitrogen and sell reductions 79 WWTPs covered by one NPDES permit 79 WWTPs covered by one NPDES permit Permit has aggregate cap that declines every two years to meet 2014 goal Permit has aggregate cap that declines every two years to meet 2014 goal 16

17
Water Quality Equivalence WQT changes location of pollutant controls within a watershed WQT changes location of pollutant controls within a watershed Water quality equivalence considers that the impact of pollutant control at source A may differ from source B Water quality equivalence considers that the impact of pollutant control at source A may differ from source B Ratios, based on pollutant fate and transport models, account for different WQ impacts Ratios, based on pollutant fate and transport models, account for different WQ impacts Suitability Analysis 17

18
0.14 0.18 1.00 0.32 0.46 0.17 0.19 0.11 0.93 18
19
LIS TMDL IMPLEMENTATION 0 10,000 20,000 30,000 40,000 50,000 20002001 20022003 2004 20052006 20072008 2009 20102011 20122013 2014 Year Nitrogen ( lbs /day) 19
 19")
20
Questions? 20

21
Example: South Nation River, Ontario Trading to reduce total phosphorus in NPS-dominated watershed Trading to reduce total phosphorus in NPS-dominated watershed 21

22
South Nation Water Quality Challenge Phosphorus (P) degradation Phosphorus (P) degradation –Annual mean five times greater than water quality objective of.3 mg/l 18 wastewater treatment plants with several new or expanding facilities 18 wastewater treatment plants with several new or expanding facilities High treatment costs High treatment costs 22
 degradation Phosphorus (P) degradation –Annual mean five times greater than water quality objective of.3 mg/l 18 wastewater treatment plants with several new or expanding facilities 18 wastewater treatment plants with several new or expanding facilities High treatment costs High treatment costs 22")
23
Cap and Trade to Reduce P Province capped loads at 1998 levels Province capped loads at 1998 levels New or expanded dischargers must achieve no net increase of P in watershed by: New or expanded dischargers must achieve no net increase of P in watershed by: –treating their discharge to zero kg P OR –buying P credits to offset loads at 4:1 ratio SNC Authority is the broker for all P trades SNC Authority is the broker for all P trades 23

24
How credits are generated Calculations developed for a set of BMPs Calculations developed for a set of BMPs –Manure storage –Milk-house washwater treatment –Barnyard runoff control –Limiting livestock access –Buffer strips Ratio of 4 to 1 applied Ratio of 4 to 1 applied Credits generated when project installed Credits generated when project installed 24

25
Trading Process Summary 1. SNC Negotiates TPM Agreement with Discharger 2. Discharger pays SNC $/kg - SNC flows money into Clean Water Program 3. Clean Water Committee allocates $ to eligible projects - Farmer Field Reps do all site inspections, reporting to Committee 4. Landowners complete approved projects 5. SNC verifies project is complete - Invoices and photos of completed project - Field Reps randomly inspect 10% of completed projects 25

26
Trading Process, cont’d 6. SNC calculates P reduction from completed projects 7. SNC combines P reductions from all eligible projects and allocates credits to the dischargers 8. SNC reports annually to dischargers on $ contributed and P credits allocated 9. Annual Clean Water Program Report completed and circulated to watershed stakeholders 26

27
Monitoring 13 stations sampled monthly for surface water quality (April – Nov.) 13 stations sampled monthly for surface water quality (April – Nov.) Historical data>40 years at some stations, provides baseline information to track P trends over time Historical data>40 years at some stations, provides baseline information to track P trends over time Monitoring provides data on WQ trends, not on individual BMPs Monitoring provides data on WQ trends, not on individual BMPs 27
 13 stations sampled monthly for surface water quality (April – Nov.) Historical data>40 years at some stations, provides baseline information to track P trends over time Historical data>40 years at some stations, provides baseline information to track P trends over time Monitoring provides data on WQ trends, not on individual BMPs Monitoring provides data on WQ trends, not on individual BMPs 27")
28
Avoiding “hot spots” Trading programs sometimes raise concerns about “hot spots” or locally high pollutant loads Trading programs sometimes raise concerns about “hot spots” or locally high pollutant loads Circumstances that potentially create hotspots can be identified in advance Circumstances that potentially create hotspots can be identified in advance –Large credit buyers or increased discharge upstream of an impoundment or slow-moving reach –Large credit buyers or increased discharges into a highly impaired water segment –Any purchase of credits directly upstream of drinking water reservoir –Trades that become large by crossing numerous equivalency zones 28

29
Avoiding “hot spots” through program design Trading program can and should be designed to avoid hot spots. Some approaches for doing so include: Trading program can and should be designed to avoid hot spots. Some approaches for doing so include: –For group permits, include individual permit limits for parameters affecting local water quality, e.g., ammonia nitrogen –Limit the number of credits used within an area –Limit the direction of trades, e.g., upstream versus downstream, or weight trades to favor a direction –Apply minimum reductions (before trading) on sources with high potential for creating local impacts 29
 on sources with high potential for creating local impacts 29.")
30
Questions? 30

31
Water Quality Trading Activity 31

32
Where Do We Stand With Water Quality Trading? (Scale of trading) So far most trades are single facility offsets So far most trades are single facility offsets Three watershed scale PS trading programs in place, all to protect nutrient-impaired estuaries Three watershed scale PS trading programs in place, all to protect nutrient-impaired estuaries –Connecticut Long Island Sound –Neuse River, NC –Tar-Pamlico, NC Watershed scale programs under development Watershed scale programs under development –Passaic River NJ –Cape Fear River NC –Kalamazoo River, MI –Bear River, CO/WY –Lake Tahoe –Lower Boise River, ID –Miami River, OH 32
 So far most trades are single facility offsets So far most trades are single facility offsets Three watershed scale PS trading programs in place, all to protect nutrient-impaired estuaries Three watershed scale PS trading programs in place, all to protect nutrient-impaired estuaries –Connecticut Long Island Sound –Neuse River, NC –Tar-Pamlico, NC Watershed scale programs under development Watershed scale programs under development –Passaic River NJ –Cape Fear River NC –Kalamazoo River, MI –Bear River, CO/WY –Lake Tahoe –Lower Boise River, ID –Miami River, OH 32.")
33
Water Quality Program Water Quality Trading in Oregon Experiences to Date, What’s Next 33

34
Water Quality Program Perceptions of Trading Proponents: Trading is a way to bring free market efficiencies to reduce compliance costs Opponents: Trading is a way for polluters to get off the hook Alternate view: Trading can be a better way to protect the resource 34

35
35

36
Water Quality Program Tualatin River Temperature Profile (Observed and Predicted for 7/27/99) 36
 36")
37
Water Quality Program Trading Case Study: Clean Water Services The following are allowed: 1. Temperature trading involving a combination of the following: Riparian shading Flow augmentation 2. “Bubble” permit limits for BOD and ammonia Limits allow interplant and intraplant trading of BOD and ammonia 37

38
Water Quality Program CWS Trade: Advantages Avoids the environmental downsides to refrigeration (high need for electricity). Riparian shading via native plants + flow aug. = greater environmental benefit. Much cheaper for the source. 38

39
Water Quality Program CWS Trade: A Side Benefit We are getting good data on: What it takes to get riparian areas planted on agricultural land. What it takes/will take to keep it planted. 39

40
Water Quality Program How much will CWS have to do? Flow augmentation: CWS is able to purchase about 30 cfs throughout the summer Impact established via modeling: about ½ excess heat load is offset Riparian restoration: About 35 miles of stream to be planted 40

41
Water Quality Program How much… (cont’d)? Riparian restoration: Impact quantified by measuring the amount of solar radiation that is blocked by shade- producing vegetation 41

42
Water Quality Program “Good” Riparian Area 42

43
Water Quality Program “Bad” Riparian Area 43

44
Water Quality Program How do they get so “bad”? Streams are messy and unpredictable, they meander and flood. So, people try to control them. --Methods: removal of streamside vegetation, channel straightening, installation of dikes, levees and riprap. And… impervious area happens. As watersheds become increasingly built- up, peak flows increase. 44

45
Water Quality Program What happens when people try to control streams? The Law of Unintended Consequences kicks in. Some unintended consequences: --Increased erosion rates. --Streamside vegetation becomes dominated by nonnative invasives. Or riprap. Or concrete. 45

46
Water Quality Program Back to how much is enough… The Basic Equation: Length of Stream Required = Excess Heat Load (per day) (Reduced Solar Load x Stream Width) 46
 (Reduced Solar Load x Stream Width) 46")
47
Water Quality Program Daily Solar Loading Rates 47

48
Effective Shade on Gales Creek 48

49
Water Quality Program Problems… Trees will take a long time to grow “You are giving CWS credit for something the farmers should already be doing” 49

50
Water Quality Program Compensating for Growth Rate of Trees 50

51
Water Quality Program The equation modified… Length of Stream Required = 2 x Excess Heat Load (Reduced Daily Solar Load x River Width) 51
 51")
52
Water Quality Program Getting riparian areas planted… CWS has developed two incentive programs: “Enhanced CREP” and VEGBACC CWS has a contract with NRCS to enroll farmers There are 1900 farmers in the basin 52

53
Water Quality Program Alternative Approach City of Portland enters into non-binding agreements with (urban) landowners Landowner allows access, in exchange City installs plantings Homeowner gets free “naturescaping,” City has reduced admin. costs 53

54
Water Quality Program Establishing Compliance Challenges: Stream temperature is highly variable Impact of restoration projects may not be readily measurable at outfall Possibility of natural disasters Impact of global warming 54

55
Data courtesy of Philip W. Mote, JISAO/SMA Climate Impacts Group, University of Washington, Seattle, March 2003. 55

56
Water Quality Program Establishing Compliance Compliance will be established as follows: First 5 years: adherence to planting plans After 5 years: plant survival rates and shade density measurements 56

57
Water Quality Program Status of CWS Trade Goals for year 1 have been met, and 5 miles of stream have been planted. 57

58
Water Quality Program 58 Clean Water Services Temperature Trade Motivation Benefits How to Quantify Compliance Questions???

59
Water Quality Program What is next for trading? The Willamette Partnership: an effort to expand trading to the entire Willamette basin. Goal: to put together a “portfolio” of projects for sources to choose from to offset thermal and other impacts. Some projects may involve hyporheic flow. 59

60
Water Quality Program What is hyporheic flow? Hyporheic flow refers to flow through the gravels below and at the margins of the river (the hyporheic zone). Cooling occurs via hyporheic flow. Estimate: hyporheic flows in the Willamette have been reduced by 80% due to bank hardening, loss of channel complexity. 60
. Cooling occurs via hyporheic flow. Estimate: hyporheic flows in the Willamette have been reduced by 80% due to bank hardening, loss of channel complexity. 60.")
61
The Willamette River: Channel Simplification 61

62
Water Quality Program Achieving cooling via hyporheic flow… Some approaches: Direct discharge of effluent to hyporheic gravels Re-creating side channels Floodplain restoration 62

63
Water Quality Program Hyporheic Flow Issues Need to insure the following: Groundwater is not negatively impacted. Cooling is adequate. 63

64
Water Quality Program What is (probably) Not next for trading… The following trading schemes have been proposed: Trading in the context of UAAs. Removal of contaminated sediments in lieu of better-than- background cleanup in uplands. 64

65
Water Quality Program 65

66
Water Quality Program When is trading Not likely to work? Trading probably won’t work if: Regulators, permitted sources and environmental groups do not trust each other. Parties do not feel a sense of urgency. 66

67
Water Quality Program Trading: Lessons Learned Work with stakeholders to design trades. Why? Because the CWA is silent on trading! Where you don’t have rules, you better have trust. 67

68
Water Quality Program What we heard from the stakeholders… Pursue trades involving shade. Limit duration of credit to 20 years. Compensate for the time it takes trees to grow. 68

69
Water Quality Program Lessons Learned (cont’d) If stakeholders appreciate that trading can be a better way to protect the resource, they may accept: Longer timeframe for implementation Environmental benefit in a location other than at the outfall Uncertainty 69
 If stakeholders appreciate that trading can be a better way to protect the resource, they may accept: Longer timeframe for implementation Environmental benefit in a location other than at the outfall Uncertainty 69")
70
Water Quality Program Last but not least… With trading available as a tool, we can ask “what is the best way to protect the resource?” Our perceptions of trading can limit the potential for trading. 70

71
Water Quality Program DEQ Webpage on Trading Q&A Trading Internal Management Directive Links to EPA trading policy, manuals on trading 71

72
Questions? 72

73
Potential benefits of WQT Substantial cost savings in meeting same water quality goal Substantial cost savings in meeting same water quality goal Chesapeake Bay – WQT could save $1 billion Chesapeake Bay – WQT could save $1 billion Miami River, OH – WQT could save $370M Miami River, OH – WQT could save $370M Savings accrue to credit buyers, e.g., publicly-owned treatment plants Savings accrue to credit buyers, e.g., publicly-owned treatment plants Revenue provided to credit suppliers, PS or NPS (e.g., landowner) Revenue provided to credit suppliers, PS or NPS (e.g., landowner) 73
 Revenue provided to credit suppliers, PS or NPS (e.g., landowner) 73")
74
Potential benefits of WQT For PS/NPS trading, environmental benefits in addition to improved WQ For PS/NPS trading, environmental benefits in addition to improved WQ –Riparian improvement, reduced erosion –Co-control of multiple pollutants –Improved habitat, flood retention –Potentially, restoration of more wetlands 74

75
Where is WQT likely? w atershed conditions that favor trading Where is WQT likely? w atershed conditions that favor trading Water quality problem and pollutant sources are characterized Water quality problem and pollutant sources are characterized Desired water quality target is in place, e.g., consensus cap or TMDL Driver Desired water quality target is in place, e.g., consensus cap or TMDL Driver Multiple point sources face more stringent permit limits, i.e., water quality-based limits Multiple point sources face more stringent permit limits, i.e., water quality-based limits Significant pollutant control cost differences exist among PS or between PS and nonpoint sources Significant pollutant control cost differences exist among PS or between PS and nonpoint sources 75

76
Where is WQT likely? w atershed conditions that favor trading Where is WQT likely? w atershed conditions that favor trading Sufficient modeling, data available to assess relative water quality impact of trades Sufficient modeling, data available to assess relative water quality impact of trades Appropriate pollutant type - trading easier for pollutants that exert effects over longer term, larger scale Appropriate pollutant type - trading easier for pollutants that exert effects over longer term, larger scale Timing of pollutant reductions can be aligned for generation/use of credits Timing of pollutant reductions can be aligned for generation/use of credits –e.g., seasonal, annual States, stakeholders willing to take nontraditional approach States, stakeholders willing to take nontraditional approach 76

77
WQT Assessment Handbook : Can WQT Advance Your Watershed’s Goals? Help determine if a watershed has ‘trading potential’ Help determine if a watershed has ‘trading potential’ Assess pollutant suitability Assess pollutant suitability –Pollutant type, timing of loads, WQ equivalence, alignment of credit supply/demand Identify potential buyers, sellers and analyze financial attractiveness Identify potential buyers, sellers and analyze financial attractiveness Functions of WQT ‘market’ Functions of WQT ‘market’ Engaging stakeholders Engaging stakeholders 77

78
Key Functions All WQT programs must: Assure CWA compliance Assure CWA compliance Define trading area boundaries Define trading area boundaries Define credits - exchangeable pollutant reductions Define credits - exchangeable pollutant reductions –e.g., average pounds/day total phosphorus reduced during a one-year period Ensure accountability for pollutant reductions Ensure accountability for pollutant reductions Ensure water quality equivalence and avoidance of hotspots Ensure water quality equivalence and avoidance of hotspots Enable communication among credit buyers and sellers Enable communication among credit buyers and sellers 78

79
Key Functions All WQT programs must: Track trades and progress towards WQ goals Track trades and progress towards WQ goals Manage risk among parties to trades Manage risk among parties to trades Provide information to the public and other stakeholders Provide information to the public and other stakeholders 79

80
Defining PS Credits Defining PS Credits Facilities may not trade to meet technology- based NPDES limits Facilities may not trade to meet technology- based NPDES limits A facility may purchase credits to meet more stringent water quality-based limits A facility may purchase credits to meet more stringent water quality-based limits –within limits needed to protect local water quality A facility can create credits to sell if its discharge is reduced below water quality-based limits A facility can create credits to sell if its discharge is reduced below water quality-based limits –If limit=100, a reduction to 75 could generate 25 credits 80

81
NPS Credits: Addressing Measurement Challenges NPS load estimates are less certain than PS loads NPS load estimates are less certain than PS loads –Loads are diffuse, variable based on weather, site conditions –Unlike PS discharges, distance from waterbody can vary –Best Management Practices (BMPs) vary in effectiveness Approaches to address NPS uncertainty Approaches to address NPS uncertainty –Discount credits based on location, other factors –Apply trading ratios (2 NPS:1PS) or retire portion of each credit traded –Use quantified management practices where feasible –Use conservative assumptions on BMP effectiveness Essential to engage agricultural professionals early and often in PS/NPS trading design and implementation Essential to engage agricultural professionals early and often in PS/NPS trading design and implementation 81
 vary in effectiveness Approaches to address NPS uncertainty Approaches to address NPS uncertainty –Discount credits based on location, other factors –Apply trading ratios (2 NPS:1PS) or retire portion of each credit traded –Use quantified management practices where feasible –Use conservative assumptions on BMP effectiveness Essential to engage agricultural professionals early and often in PS/NPS trading design and implementation Essential to engage agricultural professionals early and often in PS/NPS trading design and implementation 81")
82
Defining NPS Credits Defining NPS Credits 2003 EPA Trading Policy - baseline for creating nonpoint source credits is TMDL load allocation (LA) 2003 EPA Trading Policy - baseline for creating nonpoint source credits is TMDL load allocation (LA) –States have discretion to identify other environmentally appropriate baselines –If TMDL, question becomes how to equitably apply aggregate LA to individual land parcels 82
 2003 EPA Trading Policy - baseline for creating nonpoint source credits is TMDL load allocation (LA) –States have discretion to identify other environmentally appropriate baselines –If TMDL, question becomes how to equitably apply aggregate LA to individual land parcels 82")
83
Defining NPS Credits – An Approach Estimating P credits - Lower Boise, ID program Identify eligible BMPs and efficiencies Identify eligible BMPs and efficiencies Estimate current P load of land parcel using soil slope and loss factors Estimate current P load of land parcel using soil slope and loss factors Estimate P reductions achieved with BMPs including uncertainty factor Estimate P reductions achieved with BMPs including uncertainty factor From total P reduction achieved, deduct contribution to TMDL LA or other WQ goal From total P reduction achieved, deduct contribution to TMDL LA or other WQ goal What remains are marketable ‘credits’ What remains are marketable ‘credits’ –which may be further discounted for location or to offset PS/NPS uncertainty 83

84
Questions? 84

85
What Does the Future Hold? Uncertainty and Opportunity for WQT Uncertainty about when, where trading programs will develop Uncertainty about when, where trading programs will develop Technical challenges remain with nonpoint source trading Technical challenges remain with nonpoint source trading 50,000 waters impaired by excess nutrients; more likely in coming years 50,000 waters impaired by excess nutrients; more likely in coming years –A much smaller subset will have favorable conditions for trading –Where conditions are favorable, incentives for trading can be large In these cases there may be a role for a central ‘banker’ to facilitate trades In these cases there may be a role for a central ‘banker’ to facilitate trades 85

86
Credit ‘Banks’ Could Be Essential for NPS Trading Trading won’t happen unless credit buyers and sellers can readily connect Trading won’t happen unless credit buyers and sellers can readily connect –Multiple buyers, e.g., wastewater treatment plants –Many potential sellers, e.g., landowners Most large buyers will need aggregated credits from multiple locations Most large buyers will need aggregated credits from multiple locations NPS credits vary widely in performance and uncertainty and must be verified, discounted accordingly NPS credits vary widely in performance and uncertainty and must be verified, discounted accordingly Other potential banker/broker functions Other potential banker/broker functions –Optimize selection, location of BMPs –Provide escrow or backup credits in case of BMP failure 86

87
Works with landowner, or purchases land, to generate nutrient reduction credits Nutrient reduction Manure management Riparian buffers Aggregates credits and sells to credit bank or directly to buyers Possible PS-NPS Framework NPS Credit Broker 87

88
In closing… Like other watershed decisions, trading program design and implementation can occur at regional, state and local levels Like other watershed decisions, trading program design and implementation can occur at regional, state and local levels Effective engagement of watershed stakeholders can greatly influence the success and outcomes of trading programs Effective engagement of watershed stakeholders can greatly influence the success and outcomes of trading programs 88

89
Questions? 89

Similar presentations


