Download presentation
Presentation is loading. Please wait.

1
Marcatori genetici nel plant breeding

2
Utilizzo Identificazione clonale Analisi dei parentali
Struttura familiare SCALA Struttura di popolazione Flusso genico Filogeografia Ibridizzazione Filogenesi

3
P = E+G Marcatori in biologia
Marcatori fenotipici = caratteri distinguibili a occhio nudo Colore del fiore, forma del baccello, etc.. P = E+G

4
Karl Von Linne ( )
")
5
Molecular markers Sequenze di proteine o DNA facilmente distinguibili, la cui eredità può essere verificata e associata con tratti ereditati indipendentemente dall’ambiente : a) Polimorfismi di proteine b) Polimorfismi di DNA
 Polimorfismi di proteine. b) Polimorfismi di DNA.")
6
Molecular markers Sequenze (SNPs) Microsatelliti (SSRs)
Multi-locus fingerprints AFLP (Amplified Fragment Length Polymorphism) Potere di risoluzione RAPD (random amplified polymorphic DNA) DNA cloroplastico PCR-RFLP allozimi (elettroforesi di proteine)
 Potere di risoluzione. RAPD (random amplified polymorphic DNA) DNA cloroplastico PCR-RFLP. allozimi (elettroforesi di proteine)")
7
Polimorfismi di proteine
Proteine di riserva del seme Isozimi

8
Isozimi

9
Isozimi Starch gel of the isozyme malate dehydrogenase (MDH). The numbers indicate first the MDH locus, and next the allele present (ie is locus 3 allele 18). Some bands are heterodimers (intralocus or interlocus).
. The numbers indicate first the MDH locus, and next the allele present (ie is locus 3 allele 18). Some bands are heterodimers (intralocus or interlocus).")
10
Struttura del DNA dal cromosoma al DNA
1 ccacgcgtcc gtgaggactt gcaagcgccg cggatggtgg gctctgtggc tgggaacatg 61 ctgctgcgag ccgcttggag gcgggcgtcg ttggcggcta cctccttggc cctgggaagg 121 tcctcggtgc ccacccgggg actgcgcctg cgcgtgtaga tcatggcccc cattcgcctg 181 ttcactcaga ggcagaggca gtgctgcgac ctctctacat ggacgtacag gccaccactc 241 ctctggatcc cagagtgctt gatgccatgc tcccatacct tgtcaactac tatgggaacc 301 ctcattctcg gactcatgca tatggctggg agagcgaggc agccatggaa cgtgctcgcc 361 agcaagtagc atctctgatt ggagctgatc ctcgggagat cattttcact agtggagcta 421 ctgagtccaa caacatagca attaaggtag gaggagggat ggggatgttg tgtggccgac 481 agttgtgagg ggttgtggga agatggaagc cagaagcaaa aaagagggaa cctgacacta 541 tttctggctt cttgggttta gcgattagtg cccctctctc atttgaactc aactacccat 601 gtctccctag ttctttctct gcctttaaaa aaaaatgtgt ggaggacagc tttgtggagt 661 ctgaaatcac catctacctt tacttaggtt ctgagtgcca aacccaaggc accaggcatg 721 cgtccttgac tccggagcca tcaggcaggc tttcctcagc cttttgcagc caagtctttt 781 agcctattgg tctgagttca gtgtggcagt tggttaggaa agaaggtggt tcttcgacca 841 ctaacagttt ggatttttta ggatgctagt cctttaaaa ………. Stretch of nitrogen fixation gene in soybean

11
molecular marker? DNA M1 M2 Gene A Gene B MFG MFG
1 ccacgcgtcc gtgaggactt gcaagcgccg cggatggtgg gctctgtggc tgggaacatg 61 ctgctgcgag ccgcttggag gcgggcgtcg ttggcggcta cctccttggc cctgggaagg 121 tcctcggtgc ccacccgggg actgcgcctg cgcgtgtaga tcatggcccc cattcgcctg 181 ttcactcaga ggcagaggca gtgctgcgac ctctctacat ggacgtacag gccaccactc 241 ctctggatcc cagagtgctt gatgccatgc tcccatacct tgtcaactac tatgggaacc 301 ctcattctcg gactcatgca tatggctggg agagcgaggc agccatggaa cgtgctcgcc 361 agcaagtagc atctctgatt ggagctgatc ctcgggagat cattttcact agtggagcta 421 ctgagtccaa caacatagca attaaggtag gaggagggat ggggatgttg tgtggccgac 481 agttgtgagg ggttgtggga agatggaagc cagaagcaaa aaagagggaa cctgacacta 541 tttctggctt cttgggttta gcgattagtg cccctctctc atttgaactc aactacccat 601 gtctccctag ttctttctct gcctttaaaa aaaaatgtgt ggaggacagc tttgtggag MFG M1 M2 DNA Gene A Gene B AACCTGAAAAGTTACCCTTTAAAGGCTTAAGGAA AAAGGGTTTAACCAAGGAATTCCATCGGGAATTCCG MFG readily detectable sequence of DNA whose inheritance can be monitored and associated with the trait inheritance

12
Image from UV light table
Image from computer screen

13
Co-dominant marker Dominant marker Polymorphism -Parent 1 : one band
-Parent 2 : a smaller band -Offspring 1 : heterozygote = both bands -Offspring 2 : homozygote parent 1 P 2 P 1 O 2 O 1 Gel configuration Dominant marker Polymorphism Parent 1 : one band -Parent 2 : no band -Offspring 1 : homozygote parent 1 -Offspring 2 : ???? P 2 Gel configuration P 1 O 1 O 2

14
Dominant versus Co-dominant
No distinction between homo- and heterozygotes possible No allele frequencies available AFLP, RAPD Co-dominant: homozygotes can be distinguished from heterozygotes; allele frequencies can be calculated microsatellites, SNP, RFLPs

15
Desirable properties for a good
molecular marker * Polymorphic * Co-dominant inheritance * Occurs throughout the genome * Reproducible * Easy, fast and cheap to detect * Selectivity neutral * High resolution with large number of samples

16
Basis for DNA marker technology
Restriction Endonucleases Polymerase chain reaction (PCR) DNA-DNA hybridization DNA sequencing
 DNA-DNA hybridization. DNA sequencing.")
17
RFLP based markers *Examine differences in size of specific DNA restriction fragments *Require pure, high molecular weight DNA *Usually performed on total cellular genome

18
Endonucleases and restriction sequences
AAATCGGGACCTAATGGGCC ATTTAGGGCAATTCCAAGGA YFG Ind 1 Ind 2

19
RFLP techniques

20
RFLP Polymorphisms interpretation
1 MFG 1 2 3 4 5 6 2 3 4 5 6

21
Advantages and disadvantages of RFLP
Time consuming Expensive Use of radioactive probes Advantages Reproducible Co-dominant Simple

22
DNA/DNA Hybridization
Denaturation Elevated temperature Known DNA sequence

23
Polymerase Chain Reaction
Powerful technique for amplifying DNA Amplified DNA are then separated by gel electrophoresis

24
PCR based methods 1. Reactions conditions *Target DNA ( or template)
*Four nucleotides (dATP, dCTP, dGTP, dTTP) 1. Reactions conditions *Target DNA ( or template) *Reaction buffer containing the co-factor MgCl2 *One or more primers *Thermostable DNA polymerase
 1. Reactions conditions. *Target DNA ( or template) *Reaction buffer containing the co-factor MgCl2. *One or more primers. *Thermostable DNA polymerase.")
25
= an enzyme that can synthesize DNA at
2. Use of DNA polymerase = an enzyme that can synthesize DNA at elevated temperature ex : Taq = enzyme purified from hot spring bacterium : Thermus aquaticus 3. Thermal cycle *Denaturing step - one to several min at º C *Annealing step - one to several min at º C *Elongation step - one to several min at 72 º C 4. Repetition typically 20 to 50 times average 35 times

26
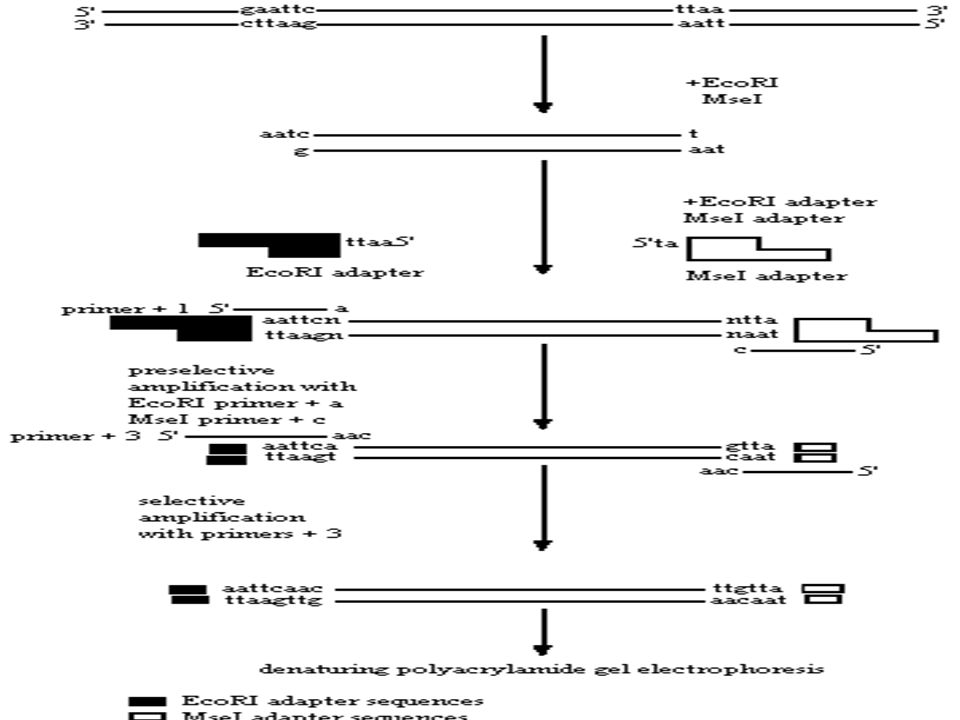
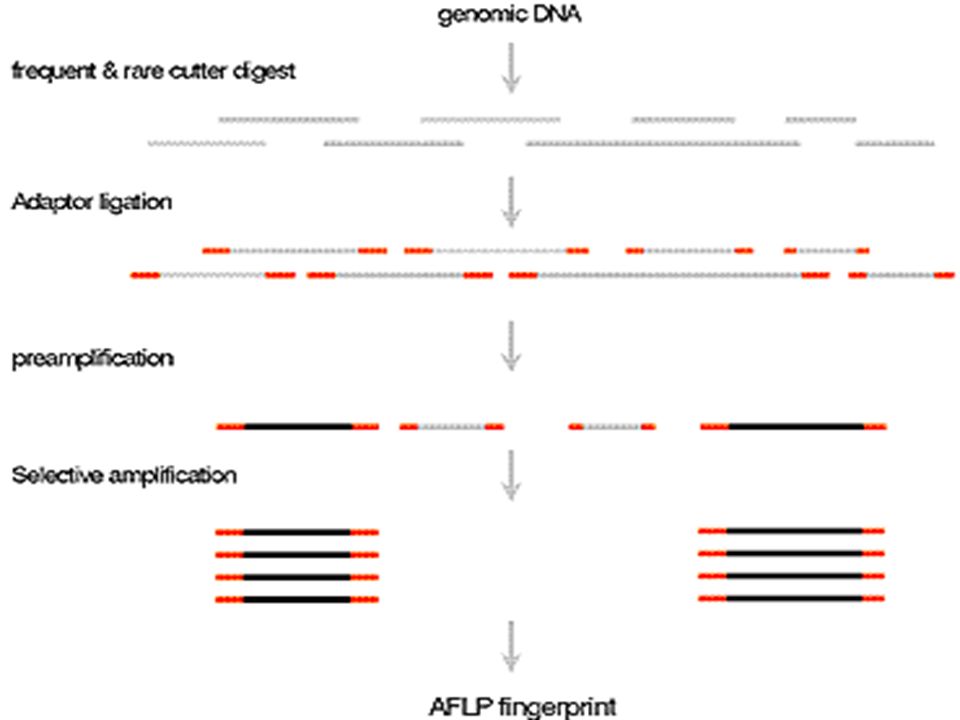
AFLP Markers Most complex of marker technologies
Involves cleavage of DNA with two different enzymes Involves ligation of specific linker pairs to the digested DNA Subsets of the DNA are then amplified by PCR

27
AFLP Markers The PCR products are then separated on acrylamide gel
128 linker combinations are readily available Therefore 128 subsets can be amplified Patented technology

31
AFLP Markers Technically demanding Reliable and stable Moderate cost
Need to use different kits adapted to the size of the genome being analyzed. Like RAPD markers need to be converted to quick and easy PCR based marker

32
RAPD Markers There are other problems with RAPD markers associated with reliability Because small changes in any variable can change the result, they are unstable as markers RAPD markers need to be converted to stable PCR markers. How?

33
RAPD Markers The polymorphic RAPD marker band is isolated from the gel
It is used a template and re-PCRed The new PCR product is cloned and sequenced Once the sequence is determined, new longer and specific primers can be designed

34
RAPD Fast and easy method for detecting polymorphisms Domimant markers
Amplifies anonymous stretches of DNA using arbitrary primers Fast and easy method for detecting polymorphisms Domimant markers Reproducibility problems

35
RAPD Polymorphisms among landraces of sorghum
Sequences of 10-mer RAPD primers Name Sequence OP A08 5’ –GTGACGTAGG- 3’ OP A15 5’ –TTCCGAACCC- 3’ OP A 17 5’ –GACCGCTTGT- 3’ OP A19 5’ –CAAACGTCGG- 3’ OP D02 5’ –GGACCCAACC- 3’ M RAPD gel configuration

36
SSR repeats and primers
GGT(5) Sequence GCGCCGAGTTCTAGGGTTTCGGAATTTGAACCGTC ATTGGGCGTCGGTGAAGAAGTCGCTTCCGTCGTTTGATTCCGGTCGTCAGAATCAGAATCAGAATCGATATGGTGGCAGTGGTGGTGGTGGTGGTGGTTTTGGTGGTGGTGAATCTAAGGCGGATGGAGTGGATAATTGGGCGGTTGGTAAGAAACCTCTTCCTGTTAG ATTCTGGAATGGAACCAGATCGCTGGTCTAGAGGTTCTGCTGTGGAACCA….. GAGGGCTGATGAGGTGGATA ATCTTATGGCGGTTCTCGTG
 Sequence. GCGCCGAGTTCTAGGGTTTCGGAATTTGAACCGTC. ATTGGGCGTCGGTGAAGAAGTCGCTTCCGTCGTTTGATTCCGGTCGTCAGAATCAGAATCAGAATCGATATGGTGGCAGTGGTGGTGGTGGTGGTGGTTTTGGTGGTGGTGAATCTAAGGCGGATGGAGTGGATAATTGGGCGGTTGGTAAGAAACCTCTTCCTGTTAG. ATTCTGGAATGGAACCAGATCGCTGGTCTAGAGGTTCTGCTGTGGAACCA….. GAGGGCTGATGAGGTGGATA. ATCTTATGGCGGTTCTCGTG.")
37
SSR polymorphisms AATCCGGACTAGCTTCTTCTTCTTCTTCTTTAGCGAATTAGG P1
AAGGTTATTTCTTCTTCTTCTTCTTCTTCTTCTTAGGCTAGGCG P2 P1 P2 Gel configuration

38
Linkage groups

39
SSR scoring for F 5:6 pop from the cross
Anand x N N97 Anand M

40
4. SNPs (Single Nucleotide Polymorphisms)
Hybridization using fluorescent dyes SNPs on a DNA strand Any two unrelated individuals differ by one base pair every 1,000 or so, referred to as SNPs. Many SNPs have no effect on cell function and therefore can be used as molecular markers.

41
DNA sequencing Sequencing gel Sequencer Sequencing graph

42
Types of traits =types of markers
Single gene trait: seed shape Multigenic trait; ex: plant growth =Quantitative Trait Loci MFG MFG

43
USES OF MOLECULAR MARKER
Measure genetic diversity Mapping Tagging

44
Genetic Diversity Define appropriate geographical scales for monitoring and management (epidemology) Establish gene flow mechanism identify the origin of individual (mutation detection) Monitor the effect of management practices manage small number of individual in ex situ collection Establish of identity in cultivar and clones (fingerprint) paternity analysis and forensic
 Monitor the effect of management practices. manage small number of individual in ex situ collection. Establish of identity in cultivar and clones (fingerprint) paternity analysis and forensic.")
45
Genetic Diversity

46
Gotcha! early selection of the good allele fingerprints seeds,
plantlets

47
A linear order of genes or DNA fragments
Mapping The determination of the position and relative distances of gene on chromosome by means of their linkage Genetic map A linear arrangement of genes or genetic markers obtained based on recombination Physical map A linear order of genes or DNA fragments

48
It contains ordered overlapping cloned DNA fragment
Physical Mapping It contains ordered overlapping cloned DNA fragment The cloned DNA fragments are usually obtained using restriction enzyme digestion

49
QTL Mapping A set of procedures for detecting genes controlling quantitative traits (QTL) and estimating their genetics effects and location To assist selection

50
Marker Assisted Selection
Breeding for specific traits in plants and animals is expensive and time consuming The progeny often need to reach maturity before a determination of the success of the cross can be made The greater the complexity of the trait, the more time and effort needed to achieve a desirable result.

51
MAS The goal to MAS is to reduce the time needed to determine if the progeny have trait The second goal is to reduce costs associated with screening for traits If you can detect the distinguishing trait at the DNA level you can identify positive selection very early.

52
Developing a Marker Best marker is DNA sequence responsible for phenotype i.e. gene If you know the gene responsible and has been isolated, compare sequence of wild-type and mutant DNA Develop specific primers to gene that will distinguish the two forms

53
Developing a Marker If gene is unknown, screen contrasting populations
Use populations rather than individuals Need to “blend” genetic differences between individual other than trait of interest

54
Developing Markers Cross individual differing in trait you wish to develop a marker Collect progeny and self or polycross the progeny Collect and select the F2 generation for the trait you are interested in Select individuals in the F2 showing each trait

55
Developing Markers Extract DNA from selected F2s
Pool equal amounts of DNA from each individual into two samples - one for each trait Screen pooled or “bulked” DNA with what method of marker method you wish to use Method is called “Bulked Segregant Analysis”

56
Marker Development Other methods to develop population for markers exist but are more expensive and slower to develop Near Isogenic Lines, Recombinant Inbreeds, Single Seed Decent What is the advantage to markers in breeding?

57
Reducing Costs via MAS Example disease resistance
10000 plants Greenhouse space or field plots $ $10000 Time 4 months (salary) $10 - $15000 total cost = $15 - $25,000
 $10 - $ total cost = $15 - $25,000.")
58
Reducing Costs via MAS PCR-based testing @ $5 sample
$50,000 - costs more? Analysis of trait not easily phenotyped E.g: Cadmium in Durum wheat 10000 plants need to reach maturity Cadmium accumulates in seed

59
Reducing costs via MAS $15 - 25 growing costs + analysis
Atomic $15 per sample $150,000 + growing costs PCR analysis still $50000 Savings in time and money increase as more traits are analyzed Many biochemical tests cost >$50 sample

60
Marker Assisted Breeding
MAS allows for gene pyramiding - incorporation of multiple genes for a trait Prevents development of biological resistance to a gene Reduces space requirements - dispose of unwanted plants and animal early

61
QTL study Types of population used for molecular markers studies:
Trait 2.5 8.4 7.1 4.5 2.3 M. 1 1 3 2 M. 2 1 3 M. 3 1 3 2 P.1 P.2 I.1 I.2 I.3 I.4 Statistical programs used in molecular marker studies * SAS * ANOVA * Mapmaker * Cartographer Types of population used for molecular markers studies: F2, RILs, Backcrosses (MILs), DH.
, DH.")
62
QTL Mapping

Similar presentations

>")


 The order of the base pairs in the sequence of every human varies In a single.>")


>")


