Download presentation
Presentation is loading. Please wait.

1
Time and space resolved imaging of electron tunneling from molecules

2
Olga Smirnova, Max-Born Institute, Berlin Serguei Patchkovskii, NRC, Ottawa Misha Ivanov, Imperial College, London Yann Mairesse, CELIA, Université Bordeaux I Nirit Dudovich, Weizmann Institute, Rehovot David Villeneuve, NRC, Ottawa Paul Corkum, NRC, Ottawa

3
Strong Field Ionization: Optical Tunneling + V(x)+xE cos t Field free atom/molecule Tunnel ionization in strong laser fields V(x)
+xE cos t Field free atom/molecule Tunnel ionization in strong laser fields V(x)")
4
We can remove an electron from different orbitals Ion can be left in excited states Many electrons and multiple orbitals IonIon*

5
Ionization from molecules OOC HOMO HOMO-1 HOMO-2 + - Tunnel ionization is exponentially sensitive to Ip X 2 g ~ A 2 u ~ B 2 u ~ Ip~13.8 eV 4.3eV 3.5 eV There is more to ionization than I p

6
Ionization from different orbitals: leaving the ion in excited states OOC HOMO HOMO-1 HOMO-2 + - Our calculations show that 3 channels are important in CO 2 X 2 g ~ A 2 u ~ B 2 u ~ Ip~13.8 eV 4.3eV 3.5 eV Multiple ionization channels are important in molecules Key reasons: Proximity of electronic states in the ion Geometry of Dyson orbitals

7
Main message 1.Channel coupling during ionization (laser-induced) 2.Interaction between the departing electron and hole
 2.Interaction between the departing electron and hole")
8
Main message 1.Channel coupling during ionization (laser-induced) 2.Interaction between the departing electron and hole 1. Affects ionization rates into each channel 2. phase 2. New parameter: phase between channels Reflected in the shape and location of the hole, its recoil from the electron during ionization

9
Main message 1.Channel coupling during ionization (laser-induced) 2.Interaction between the departing electron and hole 1. Affects the magnitude of each channel 2. phase 2. New parameter: phase between channels Reflected in the shape and location of the hole, its recoil from the electron during ionization How can we image the hole dynamics during tunneling? Can we measure the phase of ionization? Consider CO 2

10
Ionization from different orbitals: leaving the ion in excited states OOC HOMO HOMO-1 HOMO-2 + - X 2 g ~ A 2 u ~ B 2 u ~ Ip~13.8 eV Interference suppression of SF ionization A.Becker et al, 2000, C.D. Lin et al 2002 Suppression at both 0 o and 90 o X2gX2g ~ x z

11
Angular dependence: channel X, I=2.10 14 W/cm 2 HOMO |a T | 2 =4.5 10 -3 Interference suppression of SF ionization A.Becker et al, 2000 Suppression at both 0 o and 90 o X2gX2g ~ ~

12
X 2 g ~ A 2 u ~ B 2 u ~ OOC HOMO HOMO-1 HOMO-2 + - 3.5 eV Ionization from different orbitals: leaving the ion in excited states A2uA2u ~

13
Ionization: channel A, I=2.10 14 W/cm 2 |a A | 2 =9 10 -5 = |a X | 2 /50 θ = 90 o : |a A | 2 /|a X | 2 =1/5 Suppression at 0 o A2uA2u ~ ~~ ~ ~ ~

14
OOC HOMO HOMO-1 HOMO-2 + - X 2 g ~ A 2 u ~ B 2 u ~ 4.3eV Ionization from different orbitals: leaving the ion in excited states B2u+B2u+ ~

15
Ionization: channel, I=2.10 14 W/cm 2 |a X | 2 /128 |a B | 2 =3.5 10 -5 = |a B | 2 /|a X | 2 =1/28 Suppression at 90 o B2u+B2u+ ~ B ~ ~~ ~ ~

16
Ionization: intermediate conclusions Strong-field ionization almost always creates dynamics in the ion (Not specific for CO 2 ) This dynamics is different for different orientations of the molecule with respect to the laser field
 This dynamics is different for different orientations of the molecule with respect to the laser field")
17
Ionization: intermediate conclusions Strong-field ionization almost always creates dynamics in the ion (Not specific for CO 2 ) This dynamics is different for different orientations of the molecule with respect to the laser field Visualization of hole dynamics X,A channels ~~ X,B channels ~ ~ x z x z
 This dynamics is different for different orientations of the molecule with respect to the laser field Visualization of hole dynamics X,A channels ~~ X,B channels ~ ~ x z x z")
18
Visualization of hole dynamics for |X-B| 2 ~ ~ Where does the hole begin its motion after tunnel ionization, and how does it move? We need to record relative phase between different channels Direction of tunneling X,B channels ~ ~ |X+B| 2 ~~ |X-iB| 2 ~~ x z x z x z

19
How can one record hole dynamics? We need to record the relative phase between the channels Our wavepacket is entangled. We need to define the measurement.

20
How can one record hole dynamics? We need to record the relative phase between the channels Bring the system into the same state via different channels Our wavepacket is entangled. We need to define the measurement. Wave packet is prepared, but not measured yet. What if we measure ‘direct’ electrons?

21
How can one record hole dynamics? We need to record the relative phase between the channels Bring the system into the same state via different channels Our wavepacket is entangled. We need to define the measurement. What if we measure ‘direct’ electrons? Orthogonal states: No interference in direct electrons, hence no phase.

22
High harmonic spectroscopy 3. Recombination 1. Ionization 2. Propagation -xE L Same initial and final states: ground state of the neutral

23
Multiple channels in HHG IonIon* Different ionization channels- different HHG channels Ion Ion* Interference records relative phase between the channels by mapping it into harmonic amplitude modulations!

24
Multiple channels in HHG Different ionization channels- different HHG channels Ion Ion* Interference records relative phase between the channels by mapping it into harmonic amplitude modulations!

25
High harmonics: temporal resolution Atto-second temporal resolution t - time delay between ionization and recombination t1t1 t2t2 1.75 N1N1 N2N2 E e ( t)+I p 0 2.7 t,fs ~e.g. 60 eV 2fs/20 odd harmonics~100 asec Each harmonic takes snapshot of the system at a particular time delay between ionization and recombination M. Lein, S. Baker et al

26
Getting initial phase H29 X B Total Destructive interference at XB ( * )=(2n+1) XB ( =0)= rec + ion H29 XB =(E X -E B ) + rec + ion Dynamical minimum is tied to *, not harmonic number!
=(2n+1) XB ( =0)= rec + ion H29 XB =(E X -E B ) + rec + ion Dynamical minimum is tied to *, not harmonic number!")
27
I=1.1*10 14 W/cm 2 Amplitude Minima in CO 2 I=2.0*10 14 W/cm 2 Minimum shifts with intensity It is a signature of dynamical minimum and channel interference HH intensity H31 H25 HH intensity 800nm 40fs

28
Intensity dependence of the dynamical minimum =1.17±0.1fs 1.10 14 2.10 14 3.10 14 Electron energy, eV Delay , fs Laser Intensity, 10 14 W/cm 2 Harmonic number cos 4 ( ) cos 6 ( ) N * = E e ( )+I p N* ∞ (1.7±0.2)U p **
 cos 6 ( ) N * = E e ( )+I p N* ∞ (1.7±0.2)U p **")
29
Theory vs experiment Laser Intensity, 10 14 W/cm 2 Harmonic number cos 4 ( ) cos 6 ( ) cos 4 ( ) cos 6 ( ) Experiment: Yann Mairesse, Nirit Dudovich, David Villeneuve, Paul Corkum cos 4 ( ) cos 6 ( ) cos 4 ( ) cos 6 ( ) cos 4 ( ) cos 6 ( ) exp
 cos 6 ( ) cos 4 ( ) cos 6 ( ) Experiment: Yann Mairesse, Nirit Dudovich, David Villeneuve, Paul Corkum cos 4 ( ) cos 6 ( ) cos 4 ( ) cos 6 ( ) cos 4 ( ) cos 6 ( ) exp")
30
The harmonic movie decoded Visualization of hole dynamics for aligned CO 2 : X,B channels ~ ~ In tunneling regime, the initial phase between and is zero, see frame 1: maximum extension in the direction of tunneling. Direction of tunneling 1 2 3 B ~ X ~ |X+B| 2 ~~ |X-iB| 2 ~~ |X-B| 2 ~ ~ x z

31
Theory vs experiment Laser Intensity, 10 14 W/cm 2 Harmonic number cos 4 ( ) cos 6 ( ) cos 4 ( ) cos 6 ( ) Experiment: Yann Mairesse, Nirit Dudovich, David Villeneuve, Paul Corkum cos 4 ( ) cos 6 ( ) cos 4 ( ) cos 6 ( ) cos 4 ( ) cos 6 ( ) exp =1
 cos 6 ( ) cos 4 ( ) cos 6 ( ) Experiment: Yann Mairesse, Nirit Dudovich, David Villeneuve, Paul Corkum cos 4 ( ) cos 6 ( ) cos 4 ( ) cos 6 ( ) cos 4 ( ) cos 6 ( ) exp =1")
32
Hole delocalization in multiphoton regime? Visualization of hole dynamics for aligned CO 2 : X,B channels ~ ~ 1 2 3 Multiphoton regime |X-B| 2 ~~ |X-iB| 2 ~~ |X+iB| 2 ~~

33
Tracking hole dynamics at longer wavelength Each harmonic is a frame of an “attosecond movie” (M. Lein; S. Baker et al) Longer wavelength - longer movie (~ ), more frames per fs (~ ) = 1200nm HH intensity X,A channels ~~
 Longer wavelength - longer movie (~ ), more frames per fs (~ ) = 1200nm HH intensity X,A channels ~~.")
34
Mapping the period of hole motion One can monitor separately the length of the period of hole motion and initial phase for each intensity. X,A channels ~~

35
Mapping the period of hole motion One can monitor separately the length of the period of hole motion and initial phase for each intensity. X,B channels Constructive Destructive

36
Conclusions New questions for theory and experiment: Channel coupling during strong-field ionization Relative phase of strong-field ionization between channels, in tunneling and multi-photon regimes. In simple terms: How does the hole recoil from the departing electron? How does the hole left in the ion records attosecond dynamics of core re-arrangement during strong field ionization?

37
Dynamical origin of the minimum =1.17±0.1fs N = E e ( )+I p U p =E 2 L /4 2 N ∞ (1.7±0.2)U p
+I p U p =E 2 L /4 2 N ∞ (1.7±0.2)U p")
38
Dynamical origin of the minimum =1.8 fs 1.10 14 2.10 14 3.10 14 Electron energy, eV Delay , fs N = E e ( )+I p U p =E 2 L /4 2 N ∞ 3.17U p Laser Intensity, 10 14 W/cm 2 Harmonic number cos 4 ( ) cos 6 ( )
+I p U p =E 2 L /4 2 N ∞ 3.17U p Laser Intensity, W/cm 2 Harmonic number cos 4 ( ) cos 6 ( )")
39
HHG – multichannel interference NN NN Ion Neutral Ion* Interference records relative phase between the channels by mapping it into harmonic amplitude modulations

40
Amplitude Minima in CO 2, cut of the spectrum for =0 o Harmonic intensity I=1.1 10 14 W/cm 2 Harmonic number H25 Interplay of the channels depends on intensity dominates for high harmonics, dominates for low harmonics X ~ X ~ B ~ B ~ B ~ X ~ Total 800nm 40fs Harmonic number H33 I=2.0*10 14 W/cm 2

41
HH spectroscopy: the promise (?) Temporal and spatial information about electron density in the neutral electron density in the ion continuum electron: scattering phase HHG Observables photon energy harmonic amplitude (intensity) harmonic phase harmonic polarization Temporal and spatial information- how it is encoded?
 Temporal and spatial information about electron density in the neutral electron density in the ion continuum electron: scattering phase HHG Observables photon energy harmonic amplitude (intensity) harmonic phase harmonic polarization Temporal and spatial information- how it is encoded")
42
M. Lein et al, 2002 Potential to obtain structural information - gerade - ungerade Structure –related interference minima in HHG R Rcos M. Lein et al, 2002, 2D H 2 + HHG spectroscopy: spatial resolution

43
Example: HHG in CO 2 D Kanai et al, Nature 435, 2005 NB: Molecules are pre-aligned for HHG experiments!

44
CO 2 is different in Tokyo and Milano Harmonic number 25-27 C. Vozzi, PRL 95, 153902 (2005) Tokyo Milano CO 2 Kanai et al, Nature 435, 2005 33-35 CO 2
 Tokyo Milano CO 2 Kanai et al, Nature 435, CO 2.")
45
CO 2 is different in Tokyo and Milano Harmonic number 25-27 C. Vozzi, PRL 95, 153902 (2005) Tokyo Milano CO 2 Kanai et al, Nature 435, 2005 33-35 CO 2 Ottawa: Mairesse, Dudovich, Villeneuve, Corkum – The minimum shifts with intensity > 2. 10 14 W/cm 2 < 2.10 14 W/cm 2
 Tokyo Milano CO 2 Kanai et al, Nature 435, CO 2 Ottawa: Mairesse, Dudovich, Villeneuve, Corkum – The minimum shifts with intensity > W/cm 2 < W/cm 2.")
46
Main message Theory and Experiment in CO 2 HHG spectra for molecules reflect the contribution of different electronic states of the ion The positions of minima in HHG spectrum are related to Structure: geometry of participating Dyson orbitals Dynamics: the interplay of different states of the ion How to tell them apart? What can we learn from positions of dynamical minima?

47
Ionization: intermediate conclusions Strong-field ionization almost always creates dynamics in the ion (Not specific for CO 2 ) This dynamics is different for different orientations of the molecule with respect to the laser field This dynamics can be further modified by the laser field (Not the case for CO 2 in IR field) This dynamics is reflected in HHG spectra and we shall see how X, A channels ~~ X,B channels ~ ~
 This dynamics is different for different orientations of the molecule with respect to the laser field This dynamics can be further modified by the laser field (Not the case for CO 2 in IR field) This dynamics is reflected in HHG spectra and we shall see how X, A channels ~~ X,B channels ~ ~")
48
Recombination matrix element: amplitude k 2 /2+I p =N Harmonic order Log scale B ~ X ~ X ~ B ~ Harmonic order Log scale =20 o =30 o B ~ A ~ X ~ |d B | 2 >> |d X | 2 is not accidental – same nodal planes are at fault! General whenever Dyson orbitals have nodal planes |d rec | 2

49
Amplitude minima in harmonic spectra @ N. Rerikh

50
Theory vs experiment Laser Intensity, 10 14 W/cm 2 Harmonic number cos 4 ( ) cos 6 ( ) cos 4 ( ) cos 6 ( )
 cos 6 ( ) cos 4 ( ) cos 6 ( )")
51
The harmonic movie decoded Visualization of hole dynamics for aligned CO 2 : X,B channels ~ ~ 1 2 3 Multiphoton regime |X-B| 2 ~~ |X-iB| 2 ~~ |X+iB| 2 ~~ Low intensity measurement (multiphoton regime) is consistent with maximum delocalization
 is consistent with maximum delocalization")
52
I=1.7*10 14 W/cm 2 I=1.26*10 14 W/cm 2 Theory vs experiment: HHG spectra Alignment angle - 50 0 50 Alignment angle - 50 0 50 17 25 31 37 HH order Intensity -6 -7 17 21 25 29 33 HH order Intensity -6 -7 17 21 25 29 HH order Intensity -6 -7 17 21 25 29 37 HH order Intensity -6 -7 Alignment angle - 50 0 50 Alignment angle - 50 0 50 I~1.0*10 14 W/cm 2 I~1.8*10 14 W/cm 2

53
Conclusions There are several HHG channels in CO 2 molecule Interference between the channels records attosecond dynamics of ionic states Dynamical minimum is tied to recombination time and is strongly dependent on intensity Structural minimum is tied to electron energy and is intensity- independent. The comparison of theory and experiment has allowed us to ask and answer fundamental question: Where is the hole created and how does it recoil from the departing electron?

54
Harmonic phases near dynamical minimum Structural minimum: -phase jumps Dynamical minimum: H43 Ab-initio, 2D H 2 +, Lein et al, 2002 Intensity Phase Angle

55
phase jumps near dynamical minima I=2.0*10 14 W/cm 2 H33 Molecular alignment angle, Harmonic Phase, units of X ~ B ~ A ~ Total X ~ B ~

56
I=2.0*10 14 W/cm 2 H33 Molecular alignment angle, Harmonic Phase, units of X ~ B ~ A ~ H33 A ~ X ~ B ~ Molecular alignment angle, Harmonic Phase, units of I=1.3*10 14 W/cm 2 Intensity dependence of the phase Total

57
Circular dichroism = McMc |E R | 2 - |E L | 2 |E R | 2 + |E L | 2 = Circular dichroism means that system responds differently to left and right circularly polarized light: no left-right symmetry

58
Circular dichroism of harmonic emission: why? 1. Anisotropy of molecular potential: returning electron does not have to move along the field O O C - E laser

59
Circular dichroism of harmonic emission: how? E laser HHG || HHG ┴ Laser field dominates the motion of continuum electron and HHG ┴ << HHG || Conditions of high circularity: 1.Suppress HHG || -> HHG || ~ HHG ┴ /2 relative phase between HHG || and HHG ┴ Conditions are naturally met both in the vicinity of structural and dynamical minima

60
Circular dichroism “marks” dynamical minima in CO 2 Circularity, calculated from recombination dipole for HOMO, no angle averaging Max circularity marks the positions of structural minimum After averaging the min shifts from H25 to H37-39 HHG spectra, after averaging HHG circularity Max circularity marks the positions of dynamical minima I=2.0*10 14 W/cm 2

61
Circular dichroism “marks” dynamical minima in CO 2 H35: Harmonic phase for each channel H35: HHG amplitudes for each channel H35: Circularity for each channel Circularity indicates “switching” between different channels, and positions of “dynamical” minima I=2.0*10 14 W/cm 2

62
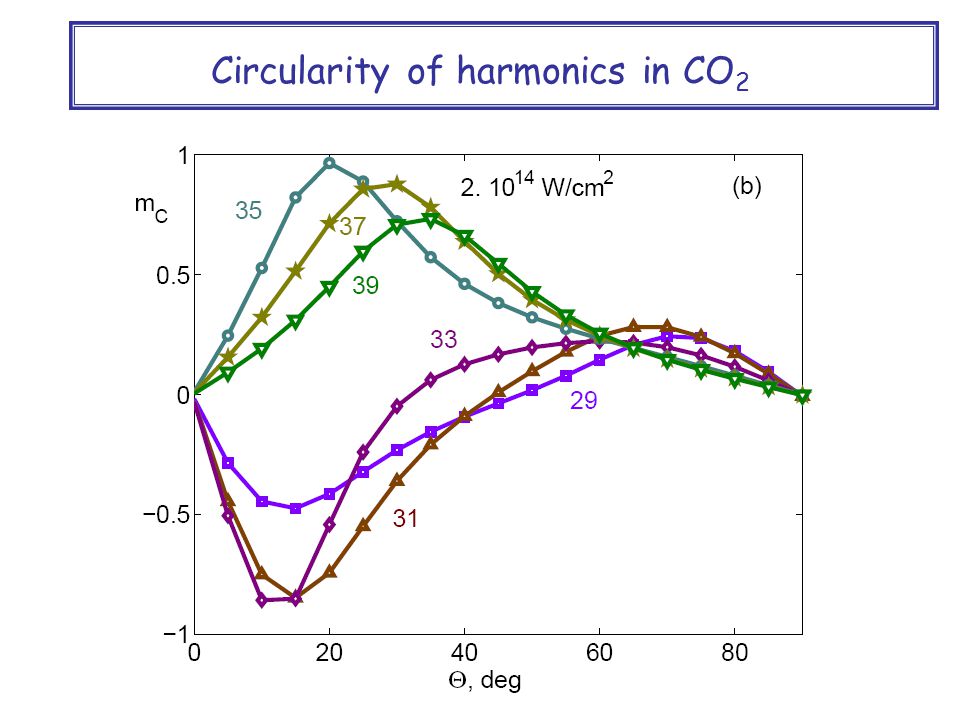
Circularity of harmonics in CO 2 – maximal number of harmonics with high circularity I=2.0*10 14 W/cm 2 I=1.5*10 14 W/cm 2 High values of M c shift to lower harmonic orders for lower intensity M c =(|E z ||E x |sin( z - x ))/ |E x | 2 + |E z | 2
)/ |E x | 2 + |E z | 2")
63
Circularly polarized attosecond pulses McMc |E R | 2 - |E L | 2 |E R | 2 + |E L | 2 = |E R |- |E L | |E R |+ |E L | = 150 asec pulse with M c =0.7I=2.0*10 14 W/cm 2 :

64
Conclusions 1.High circularity of harmonic light marks the positions of dynamical minima, background –free measurement 2.Structural minima can be hard to observe in polarization measurement 3.If the amplitude minimum is not accompanied by high circularity it is neither structural, no dynamical, but reflects switching from one dominant channel to another without destructive interference between them 4.Multichannel nature of HHG in molecules allow to shape polarization of asec pulses

65
Dynamical minimum in HH spectra XB =(E X -E B ) (N )+ rec + ion 1.10 14 2.10 14 3.10 14 Electron energy, eV N = E e ( )+I p N = 3.17 Up Delay , fs 1.8 fs 1.8 fs Dynamical minimum shifts linearly with the intensity
 (N )+ rec + ion Electron energy, eV N = E e ( )+I p N = 3.17 Up Delay , fs 1.8 fs 1.8 fs Dynamical minimum shifts linearly with the intensity")
66
Conclusions & Outlook HH spectroscopy -identifies different molecular orbitals (electronic continua) -records the interference between different electronic continua -records attosecond dynamics of the hole left in the molecule via interference between different electronic continua (HH channels) HH spectroscopy: additional observables -harmonic phases, -harmonic polarizations circularity Circular dichroism in HHG: Max circularity marks the positions of dynamical minima (background –free measurement) I=2.0 10 14 W/cm 2
 -records the interference between different electronic continua -records attosecond dynamics of the hole left in the molecule via interference between different electronic continua (HH channels) HH spectroscopy: additional observables -harmonic phases, -harmonic polarizations circularity Circular dichroism in HHG: Max circularity marks the positions of dynamical minima (background –free measurement) I= W/cm 2")
67
HH spectroscopy can be used to study -Multielctron dynamics in polyatomic molecules in strong fields -Reconstruction of individual contributions of different orbitals vs intensity gives insight into the largely unknown dynamics of strong field ionization in multielectron systems. -Where is the hole created and how does it recoil from the departing electron? (done for CO 2 ) -How non-adiabatic laser induced transitions affect the dynamics of the hole? (current work - N 2 ). - Towards strong –field control of the hole shape and motion in polyatomic molecules (possibly leading to control of fragmentation, charge transfer) Conclusions & Outlook
 -How non-adiabatic laser induced transitions affect the dynamics of the hole. (current work - N 2 ). - Towards strong –field control of the hole shape and motion in polyatomic molecules (possibly leading to control of fragmentation, charge transfer) Conclusions & Outlook.")
68
Non-linear optical wave- mixing (e.g. CARS) IpIp pump HH-probe Conclusions & Outlook Time-resolved PES HH spectroscopy can be used to study -Field-free coupled electronic and nuclear dynamics in polyatomic molecules via pump-HH probe schemes
 IpIp pump HH-probe Conclusions & Outlook Time-resolved PES HH spectroscopy can be used to study -Field-free coupled electronic and nuclear dynamics in polyatomic molecules via pump-HH probe schemes.")
69
Conclusions & Outlook HH spectroscopy can be used to study -Field-free coupled electronic and nuclear dynamics in polyatomic molecules via UV pump-HH probe schemes Stimulated Raman Pumping of N-N stretch HHG probing after t (800 nm strong field) r NN RAMAN PUMP HHG PROBE tt r NN N O O N O O Wen Li et al, Science 2008
 r NN RAMAN PUMP HHG PROBE tt r NN N O O N O O Wen Li et al, Science 2008")
70
Ion Ion* e-e- e-e- IpIp Ion Ion* e-e- e-e- IpIp PES HHS HHS Observables: -amplitudes (spectra) -phases (!) -polarizations (!) Asec resolution Selectivity: same initial and final state HHS is inverse of PES +coherence in continuum
 -phases (!) -polarizations (!) Asec resolution Selectivity: same initial and final state HHS is inverse of PES +coherence in continuum")
71
Harmonic phases near dynamical minimum Structural minimum: -phase jumps Dynamical minimum: H43 Ab-initio, 2D H 2 +, Lein et al, 2002 Intensity Phase Angle

72
phase jumps near dynamical minima I=2.0*10 14 W/cm 2 H33 Molecular alignment angle, Harmonic Phase, units of X ~ B ~ A ~ Total X ~ B ~

73
I=2.0*10 14 W/cm 2 H33 Molecular alignment angle, Harmonic Phase, units of X ~ B ~ A ~ H33 A ~ X ~ B ~ Molecular alignment angle, Harmonic Phase, units of I=1.3*10 14 W/cm 2 Intensity dependence of the phase Total

74
Conclusions There are several HHG channels in CO 2 molecule Position of the HHG minimum is intensity dependent and is determined by the interplay of different channels Interference between the channels records dynamics of ionic states Structural minimum is not easy to observe in HHG spectrum – the minimum is “filled” by the HH emission associated with other orbitals (other channels) Structural minimum is tied to electron energy and is intensity- independent. Dynamical minimum is tied to recombination time and is strongly dependent on intensity. Intensity dependence of amplitude minima and harmonic phases can be used to disentangle structural and dynamical information in HHG spectra

75
Circular dichroism in HHG emission from aligned molecules = McMc |E R | 2 - |E L | 2 |E R | 2 + |E L | 2 =

76
High circularity identifies switching between the channels McMc |E R | 2 - |E L | 2 |E R | 2 + |E L | 2 =

77
Circularity of harmonics in CO 2 M c indicates “switching” between different channels, and positions of “structural” minima McMc |E R | 2 - |E L | 2 |E R | 2 + |E L | 2 =

78
Circularity of harmonics in CO 2

80
Circular dichroism in HHG emission from aligned molecules = McMc |E R | 2 - |E L | 2 |E R | 2 + |E L | 2 =

81
High circularity identifies switching between the channels McMc |E R | 2 - |E L | 2 |E R | 2 + |E L | 2 =

82
Circularity of harmonics in CO 2 M c indicates “switching” between different channels, and positions of “structural” minima McMc |E R | 2 - |E L | 2 |E R | 2 + |E L | 2 =

83
Disentangling structural and dynamical information Structural minimum: Position of minimum is tied to the De-Broglie wavelength and hence energy of the continuum electron (approximately intensity independent) Dynamical minimum: Position of minimum is tied to the time of recombination (approximately linearly depends on intensity)
 Dynamical minimum: Position of minimum is tied to the time of recombination (approximately linearly depends on intensity)")
84
Modeling HHG: including different channels j – labels different states of the ion

85
Modeling HHG: including different channels NEUT (t) – MC SCF, quasi-static field, for all relevant electrons (CAS) ION, j (t) MC SCF for all (j=1..5) essential stationary ionic states, field-free Calculate all dipole couplings between these states Do TDSE dynamics in restricted basis of these ionic states Channel-specific Hartree potential : Hartree [ ION,J ] a ion : syb-cycle Y udin I vanov * orbital-dependent angular factor (CC-VGSFA) CONT, j (t) from SF EVA (Smirnova, Spanner, Ivanov PRA (2008)) j – labels different states of the ion
![Modeling HHG: including different channels NEUT (t) – MC SCF, quasi-static field, for all relevant electrons (CAS) ION, j (t) MC SCF for all (j=1..5) essential stationary ionic states, field-free Calculate all dipole couplings between these states Do TDSE dynamics in restricted basis of these ionic states Channel-specific Hartree potential : Hartree [ ION,J ] a ion : syb-cycle Y udin I vanov * orbital-dependent angular factor (CC-VGSFA) CONT, j (t) from SF EVA (Smirnova, Spanner, Ivanov PRA (2008)) j – labels different states of the ion](http://images.slideplayer.com/17/5355938/slides/slide_85.jpg "Modeling HHG: including different channels NEUT (t) – MC SCF, quasi-static field, for all relevant electrons (CAS) ION, j (t) MC SCF for all (j=1..5) essential stationary ionic states, field-free Calculate all dipole couplings between these states Do TDSE dynamics in restricted basis of these ionic states Channel-specific Hartree potential : Hartree [ ION,J ] a ion : syb-cycle Y udin I vanov * orbital-dependent angular factor (CC-VGSFA) CONT, j (t) from SF EVA (Smirnova, Spanner, Ivanov PRA (2008)) j – labels different states of the ion")
86
Basis of continuum states Ansatz for j-channel U J (r) = Nuclei + Hartree [ ION,J ] + Exch. + Polarization (S. Tonzani, C. Green, 2005) Substituting this ansatz into N-electron TDSE and integrating out core electrons we get
![Basis of continuum states Ansatz for j-channel U J (r) = Nuclei + Hartree [ ION,J ] + Exch.](http://images.slideplayer.com/17/5355938/slides/slide_86.jpg "+ Polarization (S. Tonzani, C. Green, 2005) Substituting this ansatz into N-electron TDSE and integrating out core electrons we get.")
87
Strong Field EVA for continuum EVA – generalized Eikonal – Volkov Approximation free e - in strong field phase correction amplitude correction “All about EVA”: Smirnova, Spanner, Ivanov PRA (2008) r L (k,r, ) – trajectory in the laser field, arriving to “r” at “t” U J (r) = Nuclei + Hartree of (N-1) electrons + Exch. + Polarization (S. Tonzani, C. Green, 2005) Single hard scattering can be included in Born-like series after partitioning U(r) = Short-range singular + Long-range non-singular
 Single hard scattering can be included in Born-like series after partitioning U(r) = Short-range singular + Long-range non-singular.")
88
Recombination matrix element: amplitude k 2 /2+I p =N Harmonic order Log scale B ~ X ~ X ~ B ~ Harmonic order Log scale =20 o =30 o B ~ A ~ X ~ |d B | 2 >> |d X | 2 is not accidental – same nodal planes are at fault! General whenever Dyson orbitals have nodal planes |d rec | 2

89
Outlook Each harmonic is a frame of an “attosecond movie” (M. Lein; S. Baker et al) Longer wavelength - longer movie (~ ), more frames per fs (~ ) = 1200nm HH intensity X,A channels ~~
 Longer wavelength - longer movie (~ ), more frames per fs (~ ) = 1200nm HH intensity X,A channels ~~.")
90
Contributions to XB ~~ XB =(E B -E X ) (N )+ rec ~ ~~~ X ≈ B ≈ ~ ~ if (E B -E X ) << N Recombination time, fs X - B ~ ~ Harmonic number ~ ~ B ~ X ~ N =E e ( )+I p
 (N )+ rec ~ ~~~ X ≈ B ≈ ~ ~ if (E B -E X ) << N Recombination time, fs X - B ~ ~ Harmonic number ~ ~ B ~ X ~ N =E e ( )+I p")
91
Destructive interference: XB =(2n+1) ~~ Harmonic number rec, units of X ~ B ~ XB =(E X -E B ) (N )+ rec ~ ~~~ Evolution of phase
 ~~ Harmonic number rec, units of X ~ B ~ XB =(E X -E B ) (N )+ rec ~ ~~~ Evolution of phase")
92
Conclusions I -amplitudes There are several HHG channels in CO 2 molecule Position of the HHG minimum is intensity dependent and is determined by the interplay of different channels Structural minimum is not easy to observe in HHG spectrum – the minimum is “filled” by the HH emission associated with other orbitals (other channels)
")
93
Conclusions II -phases Phase measurements can be very useful to disentangle the contribution of different orbitals Phase jumps are often related to the switch between the channels and do not have to be = Recombination matrix elements give the dominant contribution into harmonic phases in the case of CO 2

94
phase jumps near interference minima H33 I=2.0*10 14 W/cm 2 H33 Molecular alignment angle, Harmonic Phase, units of Harmonic Amplitude X ~ X ~ B ~ B ~ A ~ A ~

95
Intensity dependence of the phase H33 I=1.3*10 14 W/cm 2 H33 A ~ A ~ X ~ X ~ B ~ B ~ Molecular alignment angle, Harmonic Phase, units of Harmonic Amplitude

96
Role of electron-ion entanglement Norm: Low degree of entanglement:

97
Eikonal vs exact, hydrogen atom

98
Eikonal vs plane wave =20 o =30 o =40 o Harmonic number |d| 2 Eikonal Plane wave

99
Contributions to XB Harmonic number rec, units of ~~ ~~ D TOT = D x (N )+ D B (N ~ ~ ~ X ~ B ~ D x (N )=exp{-i V -iE X X (N )-i rec,X } ~ ~ D B (N )=exp{-i V -iE B B (N )-i rec,B } ~ ~~ Destructive interference XB =(2n+1) ~~ V << XB if (N )<< (N ~ ~ XB =(E X -E B ) (N )+ rec ~ ~~~
+ D B (N ~ ~ ~ X ~ B ~ D x (N )=exp{-i V -iE X X (N )-i rec,X } ~ ~ D B (N )=exp{-i V -iE B B (N )-i rec,B } ~ ~~ Destructive interference XB =(2n+1) ~~ V << XB if (N )<< (N ~ ~ XB =(E X -E B ) (N )+ rec ~ ~~~")
100
I=10 14 W/cm 2 Angle of molecular alignment, deg Harmonic phase, units of Switching orbitals: harmonic phases

101
Interpretation of NRC phase measurements Yann Mairesse, Nirit Dudovich, Paul Corkum & David Villeneuve Phase measurements @ NRC: H19 H21H23 H17

102
I=10 14 W/cm 2 Experiment vs Theory Harmonic phase, units of Angle of molecular alignment, deg Harmonic phase, rad 0.64 0.4 H21H23 0.6 0.9

103
I=10 14 W/cm 2 Experiment vs Theory Angle of molecular alignment, deg H17 Harmonic phase, units of Harmonic phase, rad 0.4 0.6 H21 Harmonic phase, rad 0.1

104
Conclusions I -amplitudes There are several HHG channels in CO 2 molecule Position of the HHG minimum is intensity dependent and is determined by the interplay of different channels Structural minimum is not easy to observe in HHG spectrum – the minimum is “filled” by the HH emission associated with other orbitals (other channels)
")
105
Conclusions II -phases Phase measurements can be very useful to disentangle the contribution of different orbitals Phase jumps are often related to the switch between the channels and do not have to be = Recombination matrix elements give the dominant contribution into harmonic phases in the case of CO 2

106
Main message HHG spectra for molecules reflect the contribution of different channels related to different states of the ion The relative contributions of these channels change with the intensity The positions of minima in HHG spectrum and phase jumps are often determined by the interplay of different channels The channels can be distinguished by looking at harmonics: amplitude, phase, photon energy vs molecular orientation (Example: CO 2 molecule)
")
107
Interference between the channels for =0 o E Laser D x, D B || E Laser =0 o : ~ ~ Harmonic intensity Harmonic number H27 H33 cos ( XB ) |D x + D B | 2 = |D x | 2 + | D B | 2 +2 |D x |*| D B | cos ( XB ) ~~ ~ ~ ~ ~ ~ ~ 1.3 10 14 W/cm 2 2.10 14 W/cm 2
 |D x + D B | 2 = |D x | 2 + | D B | 2 +2 |D x |*| D B | cos ( XB ) ~~ ~ ~ ~ ~ ~ ~ W/cm W/cm 2")
108
Modeling HHG: including different channels j – labels different states of the ion Visualization of hole dynamics X+A channels ~~ X+B channels ~ ~ Question: Where does the hole begin its motion?

109
Where does the hole start its motion? Laser Intensity, 10 14 W/cm 2 Harmonic number cos 4 ( ) cos 6 ( ) The position of the minimum depends on the initial phase between the X and B channels: Xe i +B
 cos 6 ( ) The position of the minimum depends on the initial phase between the X and B channels: Xe i +B.")
110
Where does the hole start its motion? Laser Intensity, 10 14 W/cm 2 Harmonic number cos 4 ( ) cos 6 ( ) The position of the minimum depends on the initial phase between the X and B channels: Xe i +B
 cos 6 ( ) The position of the minimum depends on the initial phase between the X and B channels: Xe i +B .")
111
Ionization: intermediate conclusions Strong-field ionization almost always creates dynamics in the ion (Not specific for CO 2 ) This dynamics is different for different orientations of the molecule with respect to the laser field This dynamics can be further modified by the laser field (Not the case for CO 2 in IR field) This dynamics is reflected in HHG spectra and we shall see how
 This dynamics is different for different orientations of the molecule with respect to the laser field This dynamics can be further modified by the laser field (Not the case for CO 2 in IR field) This dynamics is reflected in HHG spectra and we shall see how")
112
High harmonic generation in molecules: a new spectroscopic tool Les entrées The basics of High Harmonic Generation Attosecond measurements without attosecond pulses Combining atto-second temporal and sub-A spatial resolution Les plats CO 2 Attosecond hole dynamics after tunnel ionization Les desserts (add 7’) Circular dichroism spectroscopy with high harmonics Formule du Midi - 49’ 49’
 Circular dichroism spectroscopy with high harmonics Formule du Midi - 49’ 49’")
113
Where does the hole start its motion? Laser Intensity, 10 14 W/cm 2 Harmonic number cos 4 ( ) cos 6 ( ) X&B channels ~ ~ Direction of ionization =0 ==
 cos 6 ( ) X&B channels ~ ~ Direction of ionization =0 ==.")
114
Dynamical origin of the minimum Laser Intensity, 10 14 W/cm 2 Harmonic number X+B channels ~ ~ Direction of ionization cos 4 ( ) cos 6 ( ) cos 4 ( ) cos 6 ( ) cos 4 ( ) cos 6 ( ) exp At low intensity the hole starts in the middle between the turning points: Xe i /2 +B
 cos 6 ( ) cos 4 ( ) cos 6 ( ) cos 4 ( ) cos 6 ( ) exp At low intensity the hole starts in the middle between the turning points: Xe i /2 +B")
115
Ionization: intermediate conclusions Strong-field ionization almost always creates dynamics in the ion (Not specific for CO 2 ) Wave-packet for CO 2 molecules aligned along laser field
 Wave-packet for CO 2 molecules aligned along laser field")
116
Recollision as a probe + V(x)+xE L cos t X~E L / 2 ~ 10-100 Å Energy E~10 2 eV DeBroglie < 1 Å Electron probes the parent ion Elastic scattering Inelastic scattering Radiative recombination
+xE L cos t X~E L / 2 ~ Å Energy E~10 2 eV DeBroglie < 1 Å Electron probes the parent ion Elastic scattering Inelastic scattering Radiative recombination")
117
High harmonic emission: an attosecond movie? Each harmonic is a frame of a movie The movie lasts for about ¼ -cycle: ~ 600 asec for 800 nm Number of frames: ~3Up/ ~ 20-40 at 800 nm M. Lein, 2005, S. Baker et al, 2006 t1t1 t2t2 t=t r -t i N1N1 N2N2 E e ( t)+I p
+I p.")
118
High harmonic emission vs PES Corkum,1993, Schafer, Krause & Kulander, 1993 Is HHG spectroscopy a PES in reverse? – NO! measure photons, e-m fields, not electrons all photon energies “in one shot”, … 10-… 100 eV broad recombining electron is created by tunnel ionization attosecond correlation between ionization and recombination 3. Recombination 1. Ionization 2. Propagation -xE L

119
Recollision after Tunnel Ionization Corkum,1993, Schafer, Krause & Kulander, 1993 + V(x)+xE L cos t ionization return -eE L
+xE L cos t ionization return -eE L")
120
Ionization: intermediate conclusions Strong-field ionization almost always creates dynamics in the ion (Not specific for CO 2 )
")
121
Ionization: intermediate conclusions Strong-field ionization almost always creates dynamics in the ion (Not specific for CO 2 ) This dynamics is different for different orientations of the molecule with respect to the laser field Visualization of hole dynamics X+A channels ~~ X+B channels ~ ~
 This dynamics is different for different orientations of the molecule with respect to the laser field Visualization of hole dynamics X+A channels ~~ X+B channels ~ ~")
122
Ionization: intermediate conclusions Strong-field ionization almost always creates dynamics in the ion (Not specific for CO 2 ) This dynamics is different for different orientations of the molecule with respect to the laser field This dynamics can be further modified by the laser field (Not the case for CO 2 in IR field) This dynamics is reflected in HHG spectra and we shall see how
 This dynamics is different for different orientations of the molecule with respect to the laser field This dynamics can be further modified by the laser field (Not the case for CO 2 in IR field) This dynamics is reflected in HHG spectra and we shall see how")
123
HHG – multichannel interference NN NN Neutral Interference of light records relative phase between the channels Let us look @ HHG spectra for different intensities B ~ ~ X j – labels different states of the ion

124
Disentangling structural and dynamical information Structural minimum: Position of minimum is tied to the De-Broglie wavelength and hence energy of the continuum electron (approximately intensity independent) Dynamical minimum: Position of minimum is tied to the time of recombination (approximately linearly depends on intensity)
 Dynamical minimum: Position of minimum is tied to the time of recombination (approximately linearly depends on intensity)")
125
-6 -5 -4 17 21 25 37 33 29 -50 50 0 35 -3 29 31 35 33 37 27 25 Theory vs experiment: HHG spectra Experiment: Yann Mairesse, Nirit Dudovich, David Villeneuve, Paul Corkum I~1.8*10 14 W/cm 2 I=1.7*10 14 W/cm 2 HH intensity Harmonic order Alignment angle

126
Theory vs experiment: HHG spectra Experiment: Yann Mairesse, Nirit Dudovich, David Villeneuve, Paul Corkum -6 -5 -4 17 21 25 29 21 25 29 27 31 27 I~1*10 14 W/cm 2 -50 50 0 I=1.26*10 14 W/cm 2 Alignment angle HH intensity Harmonic order

127
Kinematics of Electron recollision E rec /U p, U p =E 2 /4 Recollision energy Time X 3.17Up Up~10 eV Scheme: Rev.Mod. Phys, Krausz, Ivanov

128
The harmonic movie decoded Visualization of hole dynamics for aligned CO 2 : X,B channels ~ ~ In tunneling regime, the initial phase between and is zero, see frame 1: maximum extension in the direction of tunneling. Low intensity measurement (multiphoton regime) is consistent with frame 2: maximum delocalization Direction of tunneling 1 2 3 B ~ X ~ |X+B| 2 ~~ |X-iB| 2 ~~ |X-B| 2 ~ ~
 is consistent with frame 2: maximum delocalization Direction of tunneling B ~ X ~ |X+B| 2 ~~ |X-iB| 2 ~~ |X-B| 2 ~ ~.")
129
HH spectroscopy: Non-linear Optics perspective NN Ion Neutral HH generation as a wave-mixing process

130
The harmonic movie decoded Visualization of hole dynamics for aligned CO 2 : X,B channels ~ ~ 1 2 3 Multiphoton regime |X-B| 2 ~~ |X-iB| 2 ~~ |X+iB| 2 ~~

131
Getting initial phase H29 X B Total Destructive interference at XB ( * )=(2n+1) ** 2.6 H29 E e ( +I p =N 0 fs XB ( =0)=?
=(2n+1) ** 2.6 H29 E e ( +I p =N 0 fs XB ( =0)=")
132
Time scale 1 as = 1/1000 fs Time 10 sec 100 as 10 billion years We can apply strong laser fields to drive electrons and use them to image their own motion

133
We can remove an electron from different orbitals Ion can be left in excited states Many electrons and multiple orbitals IonIon* Different ionization channels-different HHG channels

134
High harmonics: temporal resolution Many different N are emitted at different times within 2 fsec Atto-second temporal resolution t1t1 t2t2 1.8 N1N1 N2N2 E e ( t)+I p 0 2.6 t,fs t - time delay between ionization and recombination ~e.g. 60 eV 2fs/20 odd harmonics~100 asec

Similar presentations


 in gases by Benoît MAHIEU 1.>")
 Katharine L. Reid (Paul Hockett, Mick.>")


 Radiation Source. Gilad Marcus The Department of Applied.>")
 Tunneling is one of the simplest quantum mechanical process A Laser STM for Molecules Tunneling has transformed surface science. Scanning.>")


