Download presentation
Presentation is loading. Please wait.

1
Creating Socio-Economic Household Data at the Small Area Level: An Introduction to Spatial Microsimulation Ann Harding Presentation to Department of Geography Seminar Series, University of California Santa Barbara, USA, 12 May 2008 National Centre for Social and Economic Modelling (NATSEM), University of Canberra
, University of Canberra.")
2
What are microdata and microsimulation models?
Focus on individuals or households Start with large microdata sets (admin or sample survey) Primarily used to estimate impact of government policy change on these individuals or households Impact on small sub-groups Aggregate impact Impact on government revenue or expenditure
 Primarily used to estimate impact of government policy change on these individuals or households. Impact on small sub-groups. Aggregate impact. Impact on government revenue or expenditure.")
3
Static models of taxes and transfers

4
Income tax and social security
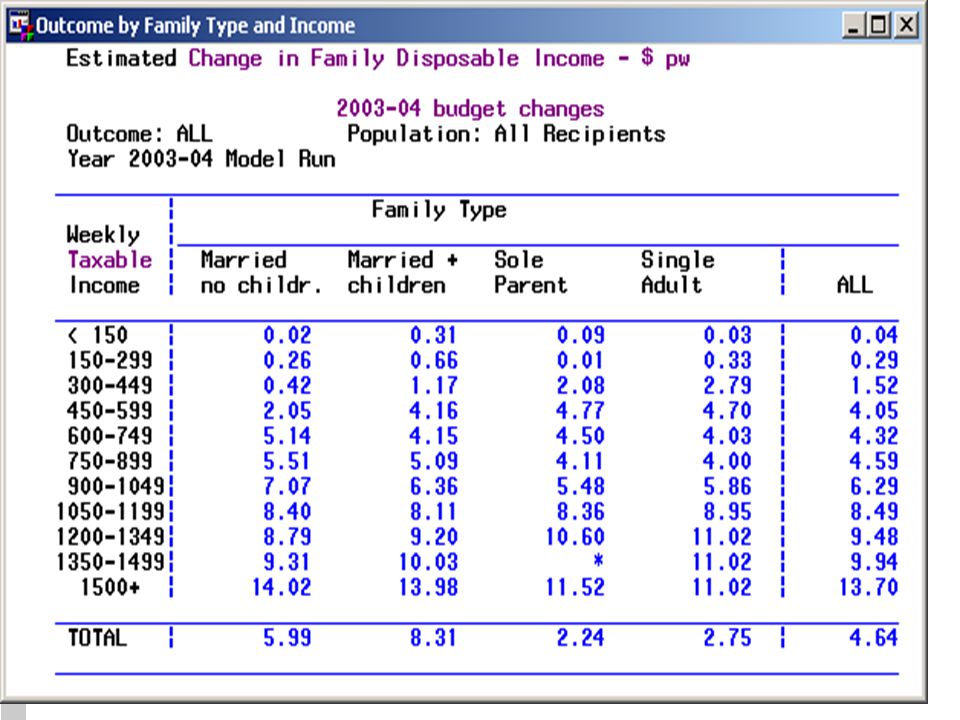
STINMOD model is now maintained by NATSEM for Australian government departments (Family and Community Services, Education Science and Training, Treasury, Employment and Workplace Relations) 13 years old STINMOD simulates all the major income tax and cash transfer programs (age pension, family payments etc) Used regularly in research – distributional impact of welfare state, impact of minimum wage rises, EMTRs Constructed on top of Income Surveys and Expenditure Surveys (2 versions)
 13 years old. STINMOD simulates all the major income tax and cash transfer programs (age pension, family payments etc) Used regularly in research – distributional impact of welfare state, impact of minimum wage rises, EMTRs. Constructed on top of Income Surveys and Expenditure Surveys (2 versions)")
8
Disposable income of sole parents with one child aged 8+, Impact of 2005 ‘welfare to work’ budget changes

9
EMTRs of sole parents with one child aged 8+, 2006-07 *
* EMTR of 65% means that person keeps 35 cents from an additional dollar of earnings

10
Dynamic models

11
Dynamic microsimulation modelling
Simulates the events that happen to ordinary Australians over their lifetime Starts in 2001 with 180,000 people (1% of the Australian population – the Census sample) Models individuals (the micro level) Uses regression equations to model human behaviour over time (dynamic) APPSIM (Australian Population and Policy Simulation Model) currently under devt – won ARC grant last year with 13 govt depts as research partners Earlier version was DYNAMOD3
 Models individuals (the micro level) Uses regression equations to model human behaviour over time (dynamic) APPSIM (Australian Population and Policy Simulation Model) currently under devt – won ARC grant last year with 13 govt depts as research partners. Earlier version was DYNAMOD3.")
12
DYNAMOD3’s Simulation Cycle
Immigration Macro-economics Emigration Annual Earnings And Savings Labour Force Education Couple Formation Y New Quarter? Pregnancy and Births Couple Dissolution Deaths Disability & Recovery Simulation Clock Australia 2001 Australia 2050 New Year?

13
Spatial models

14
Characteristics of available datasets
National sample surveys Census of Popn & Housing ? Population detail High Medium Geographic detail Low

15
Synthetic Spatial Microdata
Solution: Combine the information-rich survey data with the geographically disaggregated Census data Using ‘spatial microsimulation’ (synthetic estimation) to: create detailed unit record data for small areas (synthetic spatial microdata)
 to: create detailed unit record data for small areas (synthetic spatial microdata)")
16
Constructing small-area estimates
SMALL AREA DATA UNIT RECORD DATA (SOURCE) 2001 Census data at SLA level: 1998 - 99 Household Expenditure Survey - XCP data for SLAs Major data preparation task UNIT RECORD DATA REWEIGHTING (AMENDED) USING LINKING - Updated to 2001 VARIABLES Enhanced income - Iterative process to identify a set of variables suitable for reweighting SMALL-AREA ESTIMATES 1) Unit record dataset 2) Set of weights for each SLA
 2001 Census data at SLA. level: Household. Expenditure Survey. - XCP data for SLAs. Major data preparation task. UNIT RECORD DATA. REWEIGHTING. (AMENDED) USING. LINKING. - Updated to VARIABLES. Enhanced income. - Iterative process to identify a set of variables suitable for reweighting. SMALL-AREA ESTIMATES. 1) Unit record dataset. 2) Set of weights for each SLA.")
17
What is ‘reweighting’? turning the national household weights
in the HES survey file into … … household weights of small-areas Reweighting in a nut-shell

18
Linkage variables available in the 2001 Census and 1998-99 HES
Person level variables Age Sex Social marital status Country of birth Level of schooling Non-school qualifications Educational institution attending Study status Hours worked Individual income Occupation Labour force status Year of arrival Relationship in household Family level variables Family type Family income Household level variables Dwelling structure Tenure type Household income Household type Household size Number of dependents Number of cars Rent paid Mortgage repayments

19
Application 1: Analysis of Specific Population Sub-Groups
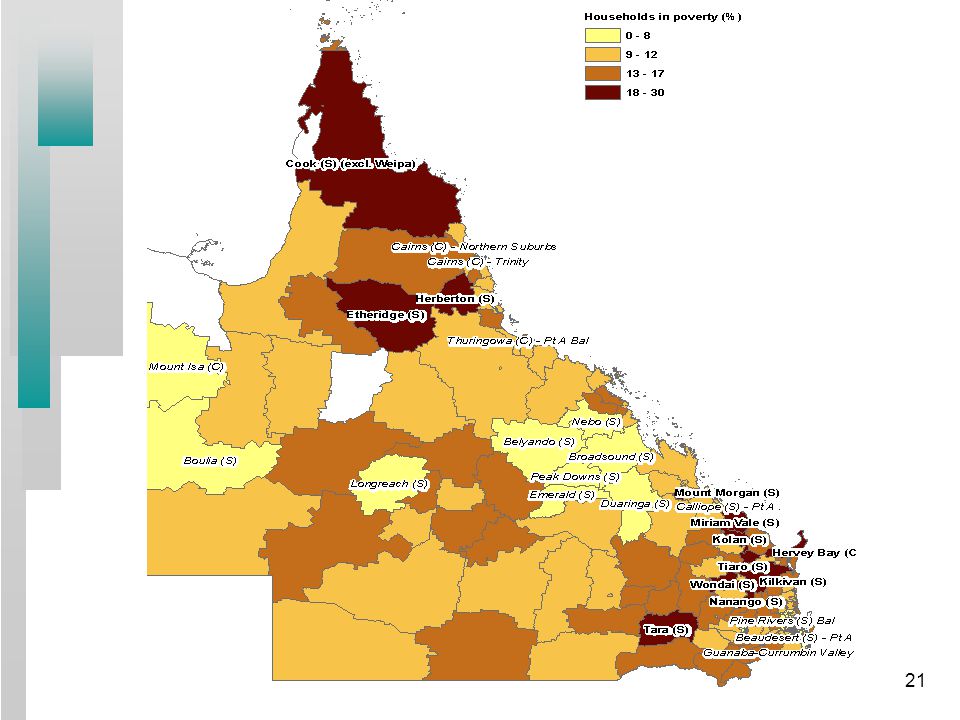
Allows – for small areas: identification and analysis of specific socio-demographic groups and characteristics analysis at various population levels: e.g. persons, income units, households Examples – children in low income families; children in jobless families; unskilled youth, those in housing stress

22
Age profile of those in poverty in postcode in metro Sydney

23
Application 2: Predict spatial impact of a policy change
Spatial microdata now linked with NATSEM’s existing microsimulation models to model the immediate distributional/revenue impact of a policy change link synthetic spatial output to STINMOD and model changes to the tax and transfer system for small geographic areas Currently modelling changes in Commonwealth Rent Assistance, income tax, social security and family payments

24
Where did the $5bn of 2005-06 tax cuts go?
Updated 2001 population numbers to using ABS estimates pop’n growth by SLA Updated household incomes and rules of govt programs to

25
Estimated average tax cut per household per week, Sydney SLAs, 2005-06
$ $9.50 (lightest) $ $13.70 $ $19.30 $ $34.10 (darkest) High tax cut areas mainly in the capital city
 $ $ $ $ $ $34.10 (darkest) High tax cut areas mainly in the capital city.")
26
Example of aggregating the microdata
Estimated average dollar tax cut per household per week, by regions, Explain: (1) regions are aggregates of SLAs using the ABS Section-of-State classification (2) Capital cities enjoy higher tax cuts (3) ACT enjoys higher tax cuts (4) QLD rural area relatively high value due to mining areas Example of aggregating the microdata
 regions are aggregates of SLAs using the ABS Section-of-State classification. (2) Capital cities enjoy higher tax cuts. (3) ACT enjoys higher tax cuts. (4) QLD rural area relatively high value due to mining areas. Example of aggregating the microdata.")
27
HOUSEMOD Spatial model (SLA)
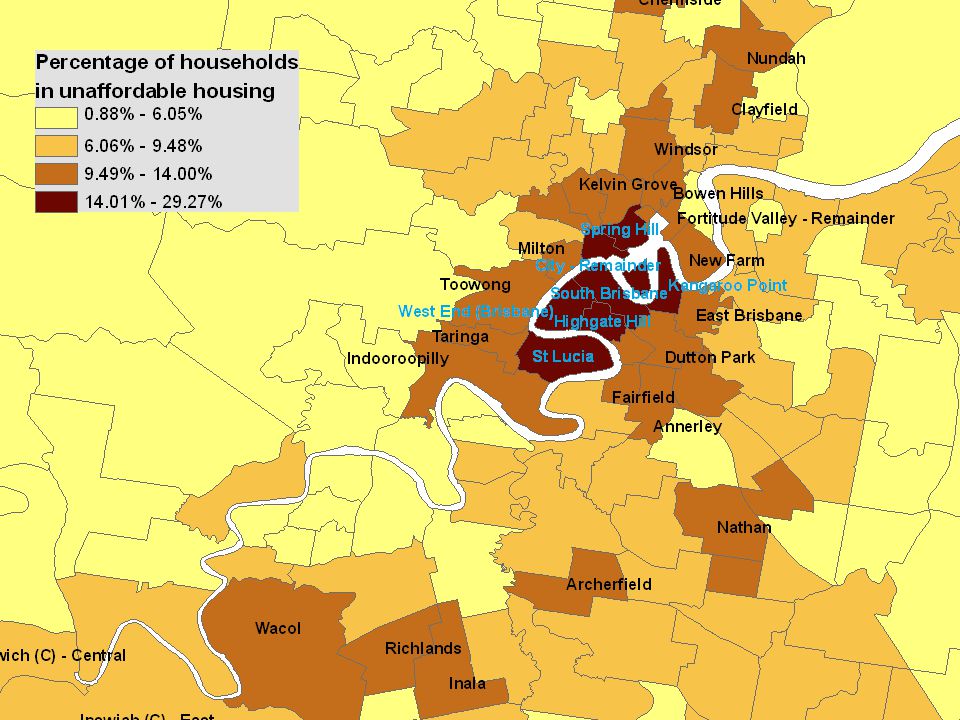
Models receipt of Commonwealth Rent Assistance Means-tested assistance to low income private renters Can change rules of CRA and predict spatial impact Has been extended to add: public renters as well plus projections for 20 years

28
% in unaffordable housing

29
Application 3: Where to put govt offices? (access channel planning)
The Centrelink CuSP Model (Customer Service Projection Model) Centrelink needed an evidence based methodology to help: match services available to customers’ needs and preferences deliver the service via the most suitable channel and in most efficient way. CuSP model assists Centrelink strategic decision-making by: producing projections of Centrelink customers and channel use over the next 5 years for small areas and under alternative scenarios about the future
 Centrelink needed an evidence based methodology to help: match services available to customers’ needs and preferences. deliver the service via the most suitable channel and. in most efficient way. CuSP model assists Centrelink strategic decision-making by: producing projections of Centrelink customers and channel use. over the next 5 years. for small areas. and under alternative scenarios about the future.")
30
Projected % changes in customer numbers – 2002-07

31
Application 4: Forecasting current & future need for services
CAREMOD model simulates current characteristics of older Australians at a detailed regional level (SLA) Imputing functional status and thus likely need for different types of care Industry partners: NSW Dept of Ageing, Disability and Home Care and Fed Dept of Health and Ageing ( ) Also new ARC grant for examining spatial implications of population ageing over next 20 years (esp. for needs-based planning of govt services) – with four states and territories
 Imputing functional status and thus likely need for different types of care. Industry partners: NSW Dept of Ageing, Disability and Home Care and Fed Dept of Health and Ageing ( ) Also new ARC grant for examining spatial implications of population ageing over next 20 years (esp. for needs-based planning of govt services) – with four states and territories.")
32
% needing high level institutional care
YEARS AND OVER

33
Where do self-funded retirees live

34
Other forthcoming ARC funded & ARCRNSISS initiatives
By end 2008, estimates of poverty, housing stress & smoking expenditure to be available via web to ARCRNSISS members At labour market area level At SLA level Based on new Income and Household Expenditure Surveys Have also developed small area index of social exclusion for children Would like to link the SLA estimates to administrative data about usage of government services Eg do poor children use public health services more or less than children from affluent families? Continue to refine the technology

35
Evidence based policy making
Growing demand for decision support tools Reduce risk to policy makers making billion dollar decisions Assess distributional implications of policy change before implemented Improve predictive capacity & strategic planning NATSEM has now constructed dozens of microsimulation models, based on ABS or admin microdata Exciting new developments are Spatial microsimulation models Health and housing models Next generation of dynamic models For free copies of all publications as released,

36
Selected references Spatial Microsimulation (spatial estimates of poverty, disadvantage etc) Lloyd, R, Harding, A and Greenwell, H, 2001, 'Worlds apart: postcodes with the highest and lowest poverty rates in today's Australia', Eardley, A, and Bradbury, B (eds), Refereed Proceedings of the National Social Policy Conference 2001, SPRC Report 1/02, pp. 279–97 ( Harding, A., Lloyd, R., Bill, A., and King, A., ‘Assessing Poverty and Inequality at a Detailed Regional Level – New Advances in Microsimulation’, in M McGillivray (ed), Perspectives on Human Wellbeing, UN University Press, Helsinki. Taylor, E, Harding, A, Lloyd, R, Blake, M, “Housing Unaffordability at the Statistical Local Area Level: New Estimates Using Spatial Microsimulation”, Australasian Journal of Regional Studies, 2004, Volume 10, Number 3, pp S.F., Chin, A., Harding, R., Lloyd, J., McNamara, B,.Phillips and Q., Vu, 2006, “Spatial Microsimulation Using Synthetic Small Area Estimates of Income, Tax and Social Security Benefits” , Australasian Journal of Regional Studies, vol. 11, no. 3, pp Chin, S.F. and Harding, A. 2006, Regional Dimensions: Creating Synthetic Small-area Microdata and Spatial Microsimulation Models. Technical Paper no. 33, April* Child Social Exclusion Index (small area index of social exclusion specifically developed for children) Harding, A., McNamara, J., Tanton, R., Daly, A., and Yap, M., “Poverty and disadvantage among Australian children: a spatial perspective” Paper for presentation at 29th General Conference of the International Association for Research in Income and Wealth , Joensuu, Finland, 20 – 26 August 2006 CuSP Model (spatial model for service delivery and access issues) King, A. , 2007, ‘Providing Income Support Services to a Changing Aged Population in Australia: Centrelink’s Regional Microsimulation Model’, in Gupta, A and Harding, A , 2007, Modelling Our Future: Population Ageing, Health and Aged Care, North Holland, Amsterdam. CAREMOD (spatial model of care needs) Brown, L and Harding, A. 2005, ‘The New Frontier of Health And Aged Care: Using Microsimulation to Assess Policy Options’, Quantitative Tools for Microeconomic Policy Analysis, Productivity Commission, Canberra ( ) L, Brown, S, Lymer, M,Yap, M,Singh and A, Harding “Where are Aged Care Services Needed in NSW – Small Area Projections of Care Needs and Capacity for Self Provision of Older Australians” , Aged Care Association of Victoria State Conferences, May 2005 * Lymer, S., Brown, L. Harding, A. Yap, M. Chin, S.F. and Leicester, S. Development of CareMod/05, NATSEM Technical Paper no. 32, March 2006* HOUSEMOD (spatial model of housing assistance and housing issues) King, A and Melhuish, T, 2004, The regional impact of Commonwealth Rent Assistance, Final report, Australian Housing and Urban Research Institute, Melbourne, November ( Kelly, S., Phillips, B. and Taylor, E., “Baseline Small Area Projections of the Demand for Housing Assistance”. Final report, The Australian Housing and Urban Research Institute RMIT-NATSEM AHURI Research Centre. May 2006 (ahuri.edu.au) DYNAMOD (dynamic microsimulation model - now being replaced by APPSIM) Kelly, S, Percival, R and Harding, A., 2001, ‘Women and superannuation in the 21st century: poverty or plenty?’, Eardley, A, and Bradbury, B (eds), Refereed Proceedings of the National Social Policy Conference 2001, SPRC Report 1/02, pp. 223–47. ( Kelly, S, 2007, ‘ Self Provision In Retirement? Forecasting Future Household Wealth in Australia’ , in Harding, A and Gupta, A., Modelling Our Future: Population Ageing, Social Security and Taxation (eds), North Holland, Amsterdam. Cassells, R., Harding, A. and Kelly, S., 2006, Problems and Prospects for Dynamic Microsimulation: A Review and Lessons for APPSIM. NATSEM Discussion Paper no. 63, December *. * Means available on NATSEM website at
, Refereed Proceedings of the National Social Policy Conference 2001, SPRC Report 1/02, pp. 279–97 ( Harding, A., Lloyd, R., Bill, A., and King, A., ‘Assessing Poverty and Inequality at a Detailed Regional Level – New Advances in Microsimulation’, in M McGillivray (ed), Perspectives on Human Wellbeing, UN University Press, Helsinki. Taylor, E, Harding, A, Lloyd, R, Blake, M, Housing Unaffordability at the Statistical Local Area Level: New Estimates Using Spatial Microsimulation , Australasian Journal of Regional Studies, 2004, Volume 10, Number 3, pp S.F., Chin, A., Harding, R., Lloyd, J., McNamara, B,.Phillips and Q., Vu, 2006, Spatial Microsimulation Using Synthetic Small Area Estimates of Income, Tax and Social Security Benefits , Australasian Journal of Regional Studies, vol. 11, no. 3, pp Chin, S.F. and Harding, A. 2006, Regional Dimensions: Creating Synthetic Small-area Microdata and Spatial Microsimulation Models. Technical Paper no. 33, April* Child Social Exclusion Index (small area index of social exclusion specifically developed for children) Harding, A., McNamara, J., Tanton, R., Daly, A., and Yap, M., Poverty and disadvantage among Australian children: a spatial perspective Paper for presentation at 29th General Conference of the International Association for Research in Income and Wealth , Joensuu, Finland, 20 – 26 August CuSP Model (spatial model for service delivery and access issues) King, A. , 2007, ‘Providing Income Support Services to a Changing Aged Population in Australia: Centrelink’s Regional Microsimulation Model’, in Gupta, A and Harding, A , 2007, Modelling Our Future: Population Ageing, Health and Aged Care, North Holland, Amsterdam. CAREMOD (spatial model of care needs) Brown, L and Harding, A. 2005, ‘The New Frontier of Health And Aged Care: Using Microsimulation to Assess Policy Options’, Quantitative Tools for Microeconomic Policy Analysis, Productivity Commission, Canberra ( ) L, Brown, S, Lymer, M,Yap, M,Singh and A, Harding Where are Aged Care Services Needed in NSW – Small Area Projections of Care Needs and Capacity for Self Provision of Older Australians , Aged Care Association of Victoria State Conferences, May 2005 * Lymer, S., Brown, L. Harding, A. Yap, M. Chin, S.F. and Leicester, S. Development of CareMod/05, NATSEM Technical Paper no. 32, March 2006* HOUSEMOD (spatial model of housing assistance and housing issues) King, A and Melhuish, T, 2004, The regional impact of Commonwealth Rent Assistance, Final report, Australian Housing and Urban Research Institute, Melbourne, November ( Kelly, S., Phillips, B. and Taylor, E., Baseline Small Area Projections of the Demand for Housing Assistance . Final report, The Australian Housing and Urban Research Institute RMIT-NATSEM AHURI Research Centre. May 2006 (ahuri.edu.au) DYNAMOD (dynamic microsimulation model - now being replaced by APPSIM) Kelly, S, Percival, R and Harding, A., 2001, ‘Women and superannuation in the 21st century: poverty or plenty ’, Eardley, A, and Bradbury, B (eds), Refereed Proceedings of the National Social Policy Conference 2001, SPRC Report 1/02, pp. 223–47. ( Kelly, S, 2007, ‘ Self Provision In Retirement Forecasting Future Household Wealth in Australia’ , in Harding, A and Gupta, A., Modelling Our Future: Population Ageing, Social Security and Taxation (eds), North Holland, Amsterdam. Cassells, R., Harding, A. and Kelly, S., 2006, Problems and Prospects for Dynamic Microsimulation: A Review and Lessons for APPSIM. NATSEM Discussion Paper no. 63, December *. * Means available on NATSEM website at")
37
Selected references STINMOD applications (static tax-benefit model)
Toohey, M and Beer, G, 2004, Financial incentives to work for married mothers under A New Tax System’, Australian Journal of Labour Economics, vol. 7, no. 1, p. 53–69, January Harding, A., Warren, N., Robinson, M. and Lambert, S., 2000, ‘The Distributional Impact of the Year 2000 Tax Reforms in Australia’, Agenda, Volume 7, No 1, pp McNamara, J, Lloyd, R, Toohey, M and Harding, A, 2004, Prosperity for all? How low income families have fared in the boom times, Report commissioned by the Australian Council of Social Service, the Brotherhood of St Laurence, Anglicare NSW, Family Services Australia, Canberra, October.* A. Harding, R. Lloyd & N. Warren, 2006, "The Distribution of Taxes and Government Benefits in Australia", in Dimitri Papadimitriou. (ed), The Distributional Effects of Government Spending and Taxation, Chapter 7, Palgrave Macmillan, New York., pp Harding, A, Vu, Q.N, Percival, R & Beer, G, “ Welfare-to-Work Reforms: Impact on Sole Parents” Agenda, Volume 12, Number 3, 2005, pages ( Harding, A., Payne, A, Vu Q N and Percival, P., 2006, ‘Trends in Effective Marginal Tax Rates, to ’, ,AMP NATSEM Income and Wealth Report Issue 14, September (available from Lloyd, R, 2007, ‘STINMOD: Use of a static microsimulation model in the policy process in Australia’, in Harding, A and Gupta, A., Modelling Our Future: Population Ageing, Social Security and Taxation (eds), North Holland, Amsterdam. CHILDMOD (static child support model) Ministerial Taskforce on Child Support, 2004, In the Best Interests of Children – Reforming the Child Support Scheme, Report of the Ministerial Taskforce on Child Support, May (see Chap 16 for output from CHILDMOD) ( NSW Hospitals Model (spatial model of socio-economic status and hospital usage and costs) Walker, A., Thurect, L and Harding, A. 2006, Changes in hospitalisation rates and costs – New South Wales, and The Australian Economic Review, vol. 39, no. 4, pp (Dec) Walker, A. Pearse, J, Thurect, L and Harding, A. 2006, Hospital admissions by socioeconomic status: does the ‘inverse care law’ apply to older Australians? Australian and New Zealand Journal of Public Health, vol. 30, no. 5, pp (October) Thurecht, L, Bennett, D, Gibbs, A, Walker, A, Pearse, J and Harding, A., 2003, A Microsimulation Model of Hospital Patients: New South Wales, Technical Paper No. 29, National Centre for Social and Economic Modelling, University of Canberra.* Thurecht, L, Walker, A, Harding, A, Pearse, J, 2005, ‘The “Inverse Care Law”, Population Ageing and the Hospital System: A Distributional Analysis’, Economic Papers, Vol 24, No 1, March A, Walker, R, Percival, L, Thurecht, J, Pearce, 2005 “ Distributional Impact of Recent Changes in Private Health Insurance Policies” Australian Health Review, 29(2), , May MediSim (static model of the Pharmaceutical Benefits Scheme) Brown. L., Abello, A., Phillips, B. and Harding A., 2004, "Moving towards an improved microsimulation model of the Australian PBS' Australian Economic Review., 1st quarter Abello, A., Brown, L., Walker, A. and Thurecht, T., 2003, An Economic Forecasting Microsimulation Model of the Australian Pharmaceutical Benefits Scheme, Technical Paper No. 30, National Centre for Social and Economic Modelling, University of Canberra.* Harding, A., Abello, A., Brown, L., and Phillips, B The Distributional Impact of Government Outlays on the Australian Pharmaceutical Benefits Scheme in , Economic Record, Vol 80, Special Issue, September Brown, L., Abello, A. and Harding, A Pharmaceuticals Benefit Scheme: Effects of the Safety Net. Agenda, vol. 13, no. 3, pp HEALTHMOD (under development: model of hospital, medical and pharmaceutical sectors) Lymer, s, Brown, Payne, and Harding, 2006, ‘Development of HEALTHMOD: a model of the use and costs of medical services in Australia, 8th Nordic Seminar on Microsimulation Models, Oslo, June (
, The Distributional Effects of Government Spending and Taxation, Chapter 7, Palgrave Macmillan, New York., pp Harding, A, Vu, Q.N, Percival, R & Beer, G, Welfare-to-Work Reforms: Impact on Sole Parents Agenda, Volume 12, Number 3, 2005, pages ( Harding, A., Payne, A, Vu Q N and Percival, P., 2006, ‘Trends in Effective Marginal Tax Rates, to ’, ,AMP NATSEM Income and Wealth Report Issue 14, September (available from Lloyd, R, 2007, ‘STINMOD: Use of a static microsimulation model in the policy process in Australia’, in Harding, A and Gupta, A., Modelling Our Future: Population Ageing, Social Security and Taxation (eds), North Holland, Amsterdam. CHILDMOD (static child support model) Ministerial Taskforce on Child Support, 2004, In the Best Interests of Children – Reforming the Child Support Scheme, Report of the Ministerial Taskforce on Child Support, May (see Chap 16 for output from CHILDMOD) ( NSW Hospitals Model (spatial model of socio-economic status and hospital usage and costs) Walker, A., Thurect, L and Harding, A. 2006, Changes in hospitalisation rates and costs – New South Wales, and The Australian Economic Review, vol. 39, no. 4, pp (Dec) Walker, A. Pearse, J, Thurect, L and Harding, A. 2006, Hospital admissions by socioeconomic status: does the ‘inverse care law’ apply to older Australians Australian and New Zealand Journal of Public Health, vol. 30, no. 5, pp (October) Thurecht, L, Bennett, D, Gibbs, A, Walker, A, Pearse, J and Harding, A., 2003, A Microsimulation Model of Hospital Patients: New South Wales, Technical Paper No. 29, National Centre for Social and Economic Modelling, University of Canberra.* Thurecht, L, Walker, A, Harding, A, Pearse, J, 2005, ‘The Inverse Care Law , Population Ageing and the Hospital System: A Distributional Analysis’, Economic Papers, Vol 24, No 1, March. A, Walker, R, Percival, L, Thurecht, J, Pearce, 2005 Distributional Impact of Recent Changes in Private Health Insurance Policies Australian Health Review, 29(2), , May. MediSim (static model of the Pharmaceutical Benefits Scheme) Brown. L., Abello, A., Phillips, B. and Harding A., 2004, Moving towards an improved microsimulation model of the Australian PBS Australian Economic Review., 1st quarter. Abello, A., Brown, L., Walker, A. and Thurecht, T., 2003, An Economic Forecasting Microsimulation Model of the Australian Pharmaceutical Benefits Scheme, Technical Paper No. 30, National Centre for Social and Economic Modelling, University of Canberra.* Harding, A., Abello, A., Brown, L., and Phillips, B The Distributional Impact of Government Outlays on the Australian Pharmaceutical Benefits Scheme in , Economic Record, Vol 80, Special Issue, September. Brown, L., Abello, A. and Harding, A Pharmaceuticals Benefit Scheme: Effects of the Safety Net. Agenda, vol. 13, no. 3, pp HEALTHMOD (under development: model of hospital, medical and pharmaceutical sectors) Lymer, s, Brown, Payne, and Harding, 2006, ‘Development of HEALTHMOD: a model of the use and costs of medical services in Australia, 8th Nordic Seminar on Microsimulation Models, Oslo, June (")
Similar presentations


 #00212K.>")


