Download presentation
Presentation is loading. Please wait.

1
Obesity – a man’s problem Dr Ian W Campbell General Practitioner and Assoc. Specialist, UHN National Obesity Forum

2
Prevalence of Obesity

3
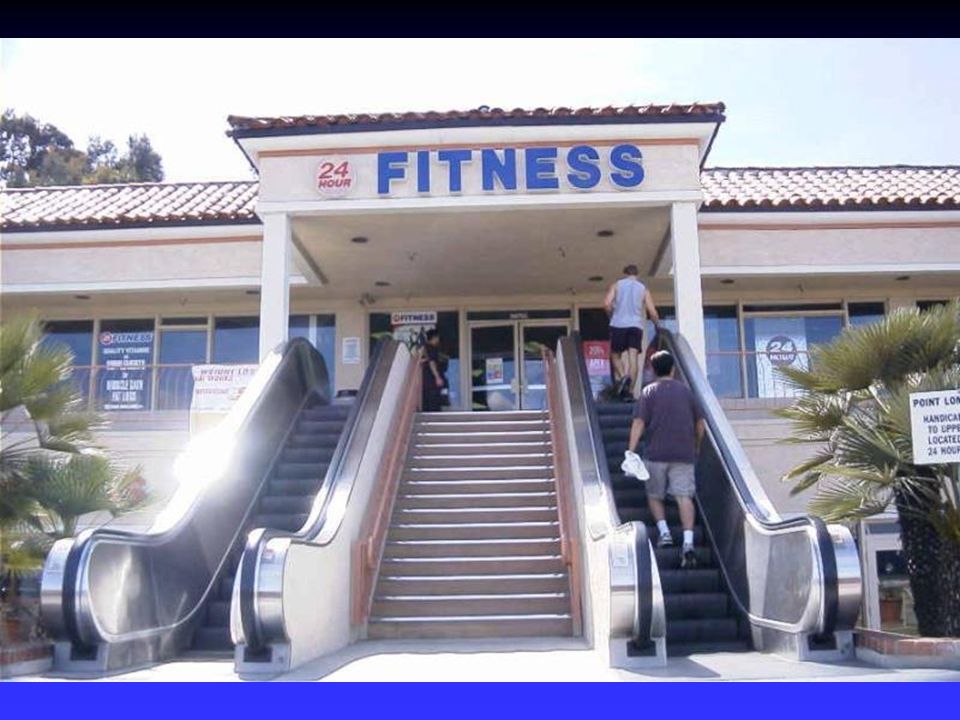
Workplaces and Inactivity Past 50 years - shift from manual to sedentary employment

4
Obesity Trends* Among U.S. Adults BRFSS, 1990 (*BMI 30, or ~ 30 lbs overweight for 5’4” woman) No Data <10% 10%-14% 15-19% 20% Source: Mokdad AH.
 No Data <10% 10%-14% 15-19% 20% Source: Mokdad AH..")
5
Obesity Trends* Among U.S. Adults BRFSS, 1991 (*BMI 30, or ~ 30 lbs overweight for 5’4” woman) No Data <10% 10%-14% 15-19% 20% Source: Mokdad AH.
 No Data <10% 10%-14% 15-19% 20% Source: Mokdad AH..")
6
Obesity Trends* Among U.S. Adults BRFSS, 1991 (*BMI 30, or ~ 30 lbs overweight for 5’4” woman) No Data <10% 10%-14% 15-19% 20% Source: Mokdad AH.
 No Data <10% 10%-14% 15-19% 20% Source: Mokdad AH..")
7
Obesity Trends* Among U.S. Adults BRFSS, 1992 (*BMI 30, or ~ 30 lbs overweight for 5’4” woman) No Data <10% 10%-14% 15-19% 20% Source: Mokdad AH.
 No Data <10% 10%-14% 15-19% 20% Source: Mokdad AH..")
8
Obesity Trends* Among U.S. Adults BRFSS, 1993 (*BMI 30, or ~ 30 lbs overweight for 5’4” woman) No Data <10% 10%-14% 15-19% 20% Source: Mokdad AH.
 No Data <10% 10%-14% 15-19% 20% Source: Mokdad AH..")
9
Obesity Trends* Among U.S. Adults BRFSS, 1994 (*BMI 30, or ~ 30 lbs overweight for 5’4” woman) No Data <10% 10%-14% 15-19% 20% Source: Mokdad AH.
 No Data <10% 10%-14% 15-19% 20% Source: Mokdad AH..")
10
Obesity Trends* Among U.S. Adults BRFSS, 1995 (*BMI 30, or ~ 30 lbs overweight for 5’4” woman) No Data <10% 10%-14% 15-19% 20% Source: Mokdad AH.
 No Data <10% 10%-14% 15-19% 20% Source: Mokdad AH..")
11
Obesity Trends* Among U.S. Adults BRFSS, 1996 (*BMI 30, or ~ 30 lbs overweight for 5’4” woman) No Data <10% 10%-14% 15-19% 20% Source: Mokdad AH.
 No Data <10% 10%-14% 15-19% 20% Source: Mokdad AH..")
12
Obesity Trends* Among U.S. Adults BRFSS, 1997 (*BMI 30, or ~ 30 lbs overweight for 5’4” woman) No Data <10% 10%-14% 15-19% 20% Source: Mokdad AH.
 No Data <10% 10%-14% 15-19% 20% Source: Mokdad AH..")
13
Obesity Trends* Among U.S. Adults BRFSS, 1998 (*BMI 30, or ~ 30 lbs overweight for 5’4” woman) No Data <10% 10%-14% 15-19% 20% Source: Mokdad AH.
 No Data <10% 10%-14% 15-19% 20% Source: Mokdad AH..")
14
Obesity Trends* Among U.S. Adults BRFSS, 1999 (*BMI 30, or ~ 30 lbs overweight for 5’4” woman) Source: Mokdad A H, et al. J Am Med Assoc 2000;284:13 No Data <10% 10%-14% 15-19% 20%
 Source: Mokdad A H, et al. J Am Med Assoc 2000;284:13 No Data <10% 10%-14% 15-19% 20%.")
15
Obesity Trends* Among U.S. Adults BRFSS, 2000 (*BMI 30, or ~ 30 lbs overweight for 5’4” woman) Source: Mokdad A H, et al. J Am Med Assoc 2001;286:10 No Data <10% 10%-14% 15-19% 20%
 Source: Mokdad A H, et al. J Am Med Assoc 2001;286:10 No Data <10% 10%-14% 15-19% 20%.")
16
Obese Adults – UK % Adapted from Erens & Primatesta 1999

17
Increasing prevalence of overweight and obesity in English children 0 5 10 15 20 197419841994 Boys overweightBoys obese Girls overweightGirls obese Prevalence (%) Adapted from Chinn & Rona. BMJ 2001; 322: 24-26

18
Rise in Childhood Obesity - UK Bundred et al, BMJ Feb 2001

19
Prevalence of overweight and obesity in UK children and adolescents 0 5 10 15 20 25 30 35 6789101112131415 Overweight (BMI>85th centile) Obese (BMI>95th centile) Adapted from Reilly & Dorosty. Lancet 1999; 354: 1874-1875 Prevalence (%) Age (years)
 Age (years).")
20
WHO classification of obesity BMI = weight(kg)/height(m)2 WHO Classification BMI Risk of Comorbidity Underweight Below 18.5 Low Healthy weight 18.5-24.9Average Overweight (grade 1 obesity) 25.0-29.9 Mild increase Obese (grade 2 obesity) 30.0-39.0Moderate/severe Morbid/severe obesity(grade 3) 40.0 and above Very severe World Health Organisation. Obesity: Preventing and Managing the Global Epidemic. Geneva: WHO, 1997 [3]

21
Fat or Fit? Jonah Lomu Height 196cm Weight 118kg BMI 31 Waist? Body fat mass?

22
Women >88 cm (80cm) = Increased risk Men >102 cm (90cm) = Increased risk Lean MEJ et al. Lancet; 1998; 351:853-6 Body fat distribution Apple shaped obesity cm

23
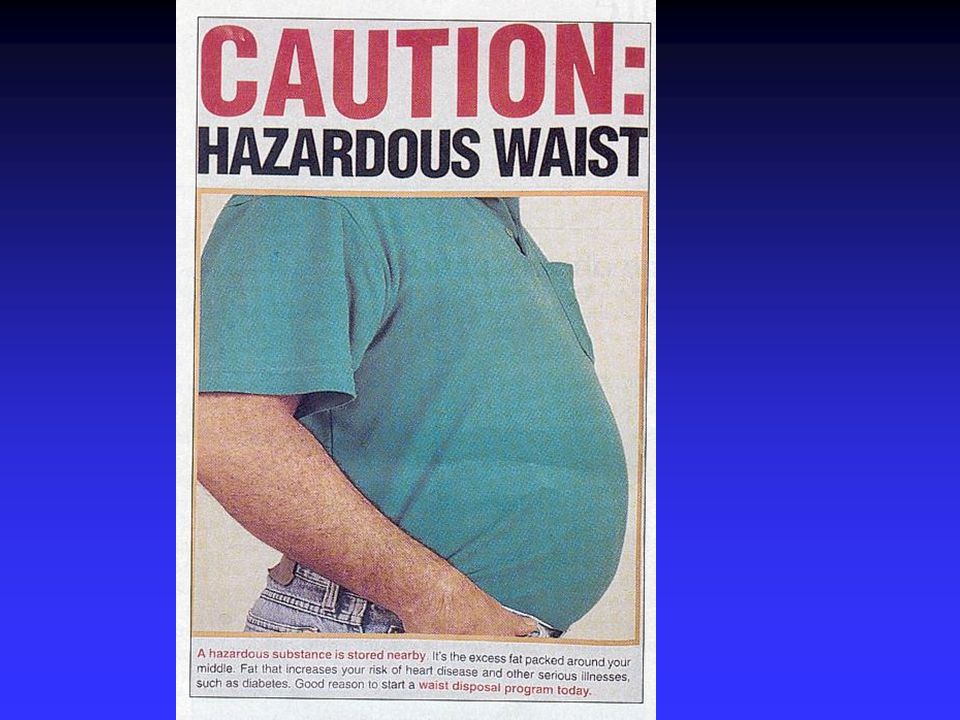
Cause of Obesity

24
Genes Obesity Environment

25
Obesity trends, diet and physical activity over 40 years Prentice and Jebb, 1995, BMJ - UK data. 1950 1960197019801990 Data normalised as % of mean for whole period 0 100 200 1950 196019701980 1990 Data normalised as % of mean for whole period 0 0 0 0 100 200 % obese Fatintake Energyintake Cars per household TV hr per wk

27
Effects of Obesity

28
Daniel Lambert 1770-1809 52 st, 11 lb (336kg) “his corpulence never caused him any pain. He never snored, rarely retired before 1 a.m., never slept more than 8 hours and was very partial to the female sex”

29
The metabolic syndrome Waist circumference M 102cm, F 88cm Triglycerides > 1.69 mmol HDL M < 1.0 mmol F < 1.3 mmol Blood pressure > 130/85 mmHg Fasting glucose > 6.1 mmol ATP III: The metabolic syndrome, JAMA 2001;285:2486-2497

30
Physical Effects of Obesity Cardiovascular Respiratory disease Gall bladder disease Hormonal abnormalities Hyperuricaemia and gout Stroke Diabetes Osteoarthritis Cancer

31
Relative risk of non-fatal MI and fatal CHD (Combined) vs BMI, in women with no previous CHD <2121-22.923-24.925-28.9>29 0 1 2 3 4 Relative Risk MI = myocardial infarction; CHD = coronary heart disease. Adapted from Willett et al. JAMA. 1995;273:461-465 (Nurses Health Study). BMI Obesity and cardiovascular disease n = 115,818 1.00 1.19 1.46 2.06 3.56
. BMI Obesity and cardiovascular disease n = 115,")
32
32 Obesity is a Risk Factor for Type 2 Diabetes in Men Adapted from Chan JM et al. Diabetes Care 1994; 17: 961-9 Multivariate adjusted relative risk of type 2 diabetes 0 10 20 30 40 50 <2323- 23.9 24- 24.9 25- 26.9 27- 28.9 29- 30.9 31- 32.9 33- 34.9 35 1.0 1.5 2.2 4.4 6.7 11.6 21.3 42.1 Body mass index (kg/m 2 )
.")
33
The Costs of Obesity Direct UK £500 million co-morbidities, GP and nurse time, prescriptions, hospitals Indirect UK £ 2.1 billion disability, unemployment, early retirement 18 m sick days, 40 000 lost years working life, 30 000 deaths, die 9 years early Intangible

34
Genetic, hormonal environmental, socio-economic, cultural behavioural Blaming patient is inappropriate and does not produce positive outcomes Medical management of obesity Lifestyle modifications Nutrition/diet Physical activity Behaviour modification Pharmacotherapy Surgery Treatment options 3 Multiple causes 2 Serious health consequences Major risk factor for common causes of death Legitimate, chronic disease 1 1. 1. Clinical guidelines. National Heart, Lung, and Blood Institute Web site. Available at: http://www. nhlbi.nih.gov/guidelines/obesity/ob_home.htm. Accessed March, 2001. 2. Weighing the Options; 1995:52. 3. Beales et al. PharmacoEconomics. 1994;5(suppl 1):18-32.
:")
35
Working with commercial weight loss groups: Weight Watchers meetings compared with self-help/brief counselling programme Heshka et al 2003, JAMA, 289:14:1792-8 Mean weight lossWeight Watchers (n=150) Self help (n=159) @ 1 year 5kg0.6kg @ 2 years 3kg0.1kg
 Self help 1 year 2 years 3kg0.1kg")
37
Men and their trousers 50% of men wear their trousers too tight only 10% admit to it 40% identified their own image 20% women identified their man’s image 45% of men thought they were overweight 30% hated their stomach most of all Prof Steven Gray, NTU, 1999

38
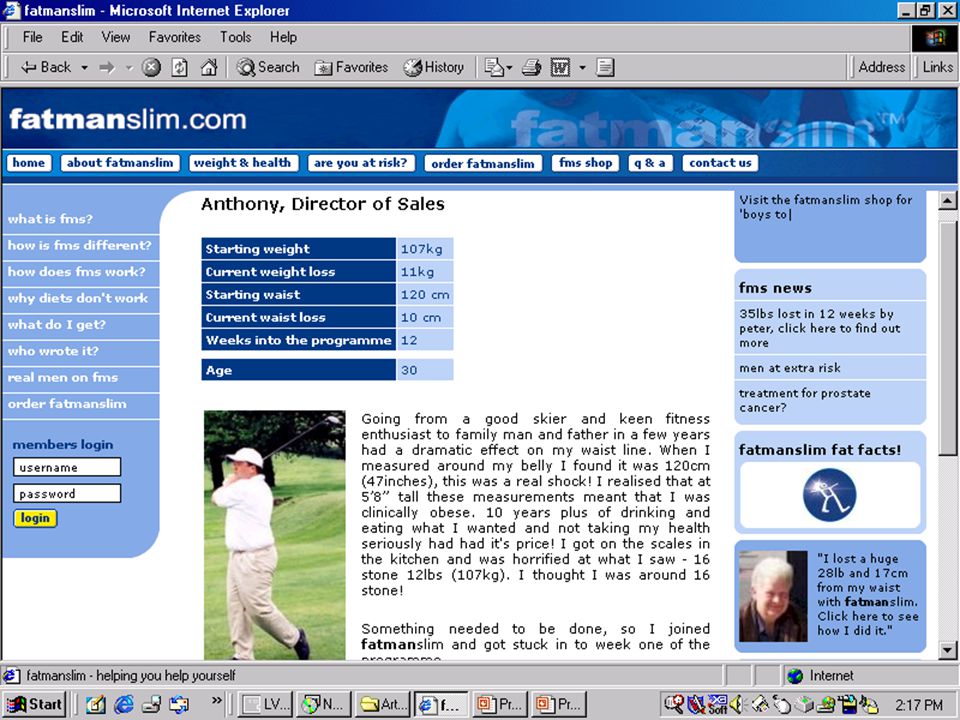
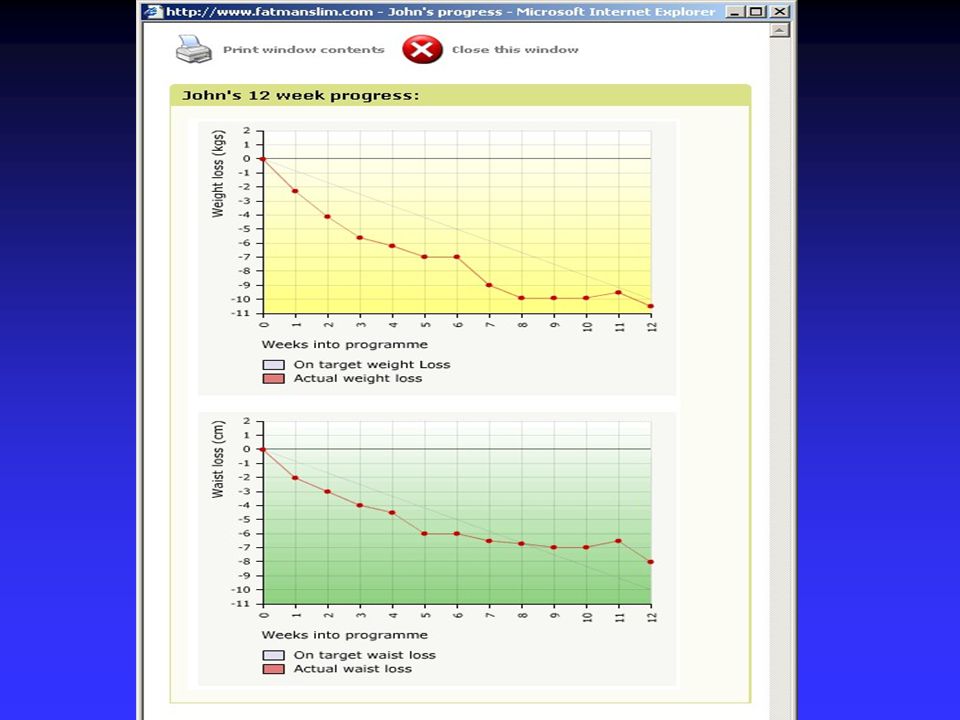
No nonsense approach to waist loss – for men A personal web-bases waist loss programme Enables men to make healthy choices Teaches techniques to change habits of a lifetime Sustainable, realistic and gradual modification Enjoyable www.fatmanslim.com

39
CHD risk increases when waist size is greater than 90cm/35”. Consider losing waist if the belly exceeds 35”. At the very least not to increase over this amount. Encourage waist loss if greater than 102cm/40”. Healthy Less than 90 cm or 35 inches Increased Health Risk 90 to 102 cm or 35 - 40 inches Greater Health Risk More than 102cm or 40 inches www.fatmanslim.com Importance of waist size Waist size & health risk

40
Weight loss of 5-10 kg (5- 10cm or 2-4inches from around your waist) brings improvements to blood pressure, cholesterol levels, glucose tolerance and a reduced incidence of type 2 diabetes. Sustained intentional weight loss of 5-10 kg (5-10 cm waist reduction) Chance of dying from heart problems by 9% Risk of dying from any disease by 20% Risk of dying from cancer by 37% >40% fall in obesity related deaths Deaths due to diabetes by 44% 10mmHg systolic and diastolic BP 50% fall in fasting glucose Lipids10% dec. total cholesterol 15% dec. in LDL 30% dec. in triglycerides 8% inc. in HDL www.fatmanslim.com The benefits of waist loss
 Chance of dying from heart problems by 9% Risk of dying from any disease by 20% Risk of dying from cancer by 37% >40% fall in obesity related deaths Deaths due to diabetes by 44% 10mmHg systolic and diastolic BP 50% fall in fasting glucose Lipids10% dec. total cholesterol 15% dec. in LDL 30% dec. in triglycerides 8% inc. in HDL The benefits of waist loss.")
41
www.fatmanslim.com Small movements add up TV remote control – can result in: 20 less short walks per day 20 x 20m = 400m 400m x 365 days=146 km 5 km/hr = 25 hrs 220 kcal/hour x25hrs = 6000 kcal = 1 kg of fat in one year

42
www.fatmanslim.com Small measures add up The humble digestive biscuit Over one year: 1 biscuit = 80 kcal 365 days = 29200 kcal = 4kg fat gain

46
fatmanslim.com

48
Foretelling the future……..

49
If you want a job done well………… Do it yourself…………..

Similar presentations


 describes relative weight for height: weight (kg)/height (m 2 ) Overweight = 25–29.9 BMI Obesity = >30 BMI.>")


 system Primarily includes heart.>")
