Download presentation
Presentation is loading. Please wait.

1
MEASURES OF DISPERSION: SPREAD AND VARIABILITY

2
DATA SETS FOR PROJECT NES2000.sav States.sav World.sav

3
Outline: Key Measures of Dispersion (Interval Scale) 1.Range 2.Variance 3.Standard Deviation 4.Standard Score
 1.Range 2.Variance 3.Standard Deviation 4.Standard Score")
4
1. Range of Values X max – X min = Range

5
i i

7
2. The Meaning of Variance Formula: Variance = s 2 = Σ (X i – X) 2 /n [or n – 1] Definition: Mean squared deviation from the mean That is: Overall variation or cumulative “spread” of values around the arithmetic mean (or “average”) for a variable Relevance: A key goal of statistical analysis is to detect underlying patterns within the overall variance. Question: Why are some values below the mean and some values above? Can we find an explanation?
 2 /n [or n – 1] Definition: Mean squared deviation from the mean That is: Overall variation or cumulative spread of values around the arithmetic mean (or average ) for a variable Relevance: A key goal of statistical analysis is to detect underlying patterns within the overall variance. Question: Why are some values below the mean and some values above. Can we find an explanation .")
8
2. Variance (continued) Thus: We want to understand variation in values of a variable—the so-called “dependent” variable. Question: Might the variation in the dependent variable be a function (or consequence) of variation in another variable—the “independent” variable? Key concept: Explanation of variance (in the dependent variable).
 Thus: We want to understand variation in values of a variable—the so-called dependent variable. Question: Might the variation in the dependent variable be a function (or consequence) of variation in another variable—the independent variable. Key concept: Explanation of variance (in the dependent variable)..")
9
3. The Standard Deviation Measure of how individual observations deviate from or vary around the mean of the variable Allows comparison of variation: –Standard deviation is 0 only if no variation –The greater the spread, the greater the standard deviation of variable –Two variables with similar means but different standard deviations differ in extent of variation around mean

10
Definition: Z i = (X i – X)/s Measures distance from mean in standard deviation units Allows comparison across variables Useful in construction of composite variables (i.e., adding apples and oranges—or level of education plus annual income, or GDP per capita plus life expectancy) 4. Standard Scores (Z Scores)
.")
11
1. Aggregating Indicators Add, multiply….? Apples and oranges? 2. Weighting Indicators Are some indicators “more important”? Weighting cannot be avoided Reprise: Constructing Composite Indicators--Two Key Problems

12
Example: Socio-economic Status Education: Mean = 10 years, sd = 2, observation X = 16, Z x = (16-10)/2 = + 3 Parents’ annual income: Mean = $ 50,000, sd = 5,000, observation X = $40,000, Z x = (40,000-50,000)/5,000 = -2
/2 = + 3 Parents’ annual income: Mean = $ 50,000, sd = 5,000, observation X = $40,000, Z x = (40,000-50,000)/5,000 = -2")
13
Composite scale 1/Mobility and Class Equal Z 1 = 3 + (-2) = + 1 Composite scale 2/Social Mobility>Class Z 2 = 3(2) + (-2) = + 4 Composite scale 3/Economic Class>Mobility Z 3 = 3 + 2(-2) = -1 Alternative Results
 = + 1 Composite scale 2/Social Mobility>Class Z 2 = 3(2) + (-2) = + 4 Composite scale 3/Economic Class>Mobility Z 3 = 3 + 2(-2) = -1 Alternative Results")
14
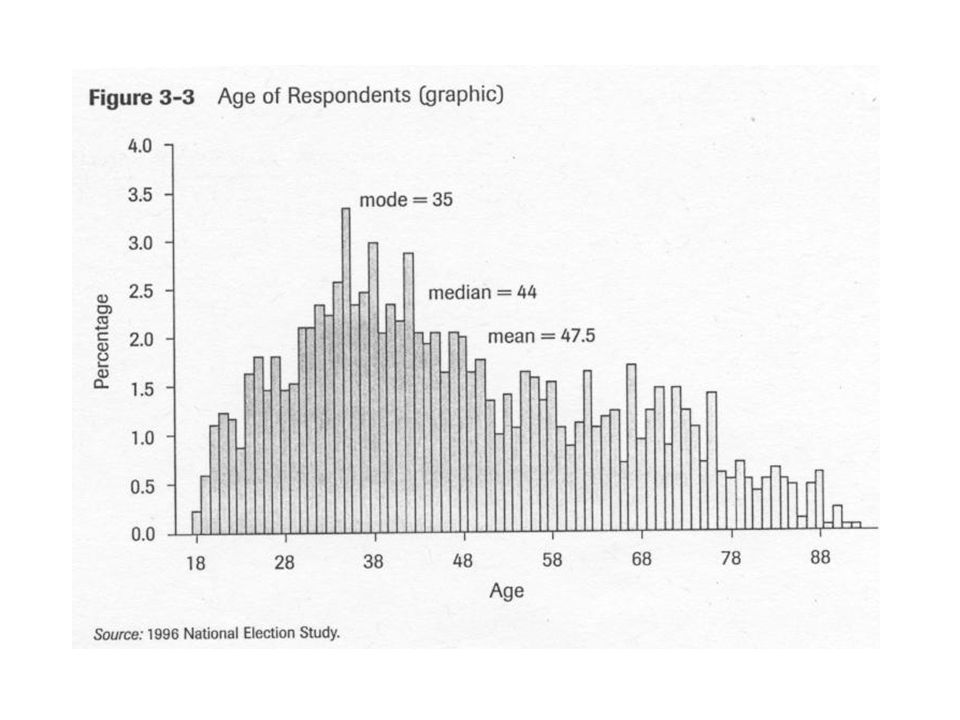
Postscript: On Skewness Sk = (X – Mo)/s= 3 (X – Md)/s Sk = 0 for a symmetrical (normal) curve, positive if skewed to the right, negative if skewed to the left If Sk > 1, consider using median not mean If Sk/standard error >2, use median not mean
/s= 3 (X – Md)/s Sk = 0 for a symmetrical (normal) curve, positive if skewed to the right, negative if skewed to the left If Sk > 1, consider using median not mean If Sk/standard error >2, use median not mean")
Similar presentations


>")


