Download presentation
Presentation is loading. Please wait.

2
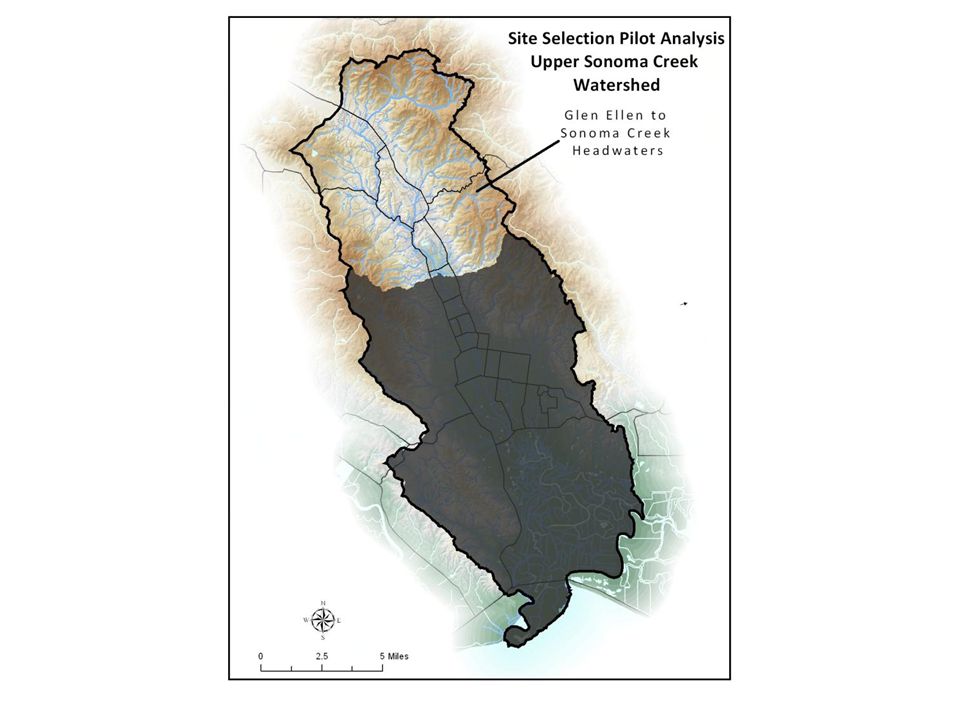
Restoration Site Prioritization Analysis Pilot Coarse Filters: Glen Ellen to Sonoma Creek headwaters SSA sub-watersheds Areas of observed salmonid presence Instream habitat quality Reach Filter: Long-term sediment supply (cubic ft / linear ft)
")
3
Site Selection GIS Analysis Observed salmonid presence Long-term Sediment Production (cubic ft / linear ft) Sediment production by sub-watershed (SSA) Aquatic Habitat Impact by Sub-Watershed Accessibility / Restoration Amenability
 Sediment production by sub-watershed (SSA) Aquatic Habitat Impact by Sub-Watershed Accessibility / Restoration Amenability")
4
Site Selection Inputs Aquatic Habitat Impact (CDFG habitat survey data summarized by reach and ranked by NOAA Fisheries criteria for impact) Observed salmonid presence (snorkel, electrofishing, habitat surveys) Sediment production by sub-watershed (Sediment Source Analysis 2006; RUSLE, roads, landslides, channel) Long-term sediment production by reach (Laurel Collins field work and model) Accessibility (Willing partners, stream stewards, public land)
 Observed salmonid presence (snorkel, electrofishing, habitat surveys) Sediment production by sub-watershed (Sediment Source Analysis 2006; RUSLE, roads, landslides, channel) Long-term sediment production by reach (Laurel Collins field work and model) Accessibility (Willing partners, stream stewards, public land)")
5
Habitat Impact Score Calculation Canopy Cover Shelter Rating Frequency of Primary Pools % Agriculture by Sub-watershed % Impervious Surface per Sub-watershed Composite Habitat Score by Sub-watershed

6
Digitizing Historic Sediment Data Laurel Collins mylar overlays were scanned and geo-referenced into the GIS to match existing stream layer Stream Segments were split or joined to match Laurel’s “Station” lengths and attributed with station ID.

7
Geo-referenced Mylar

8
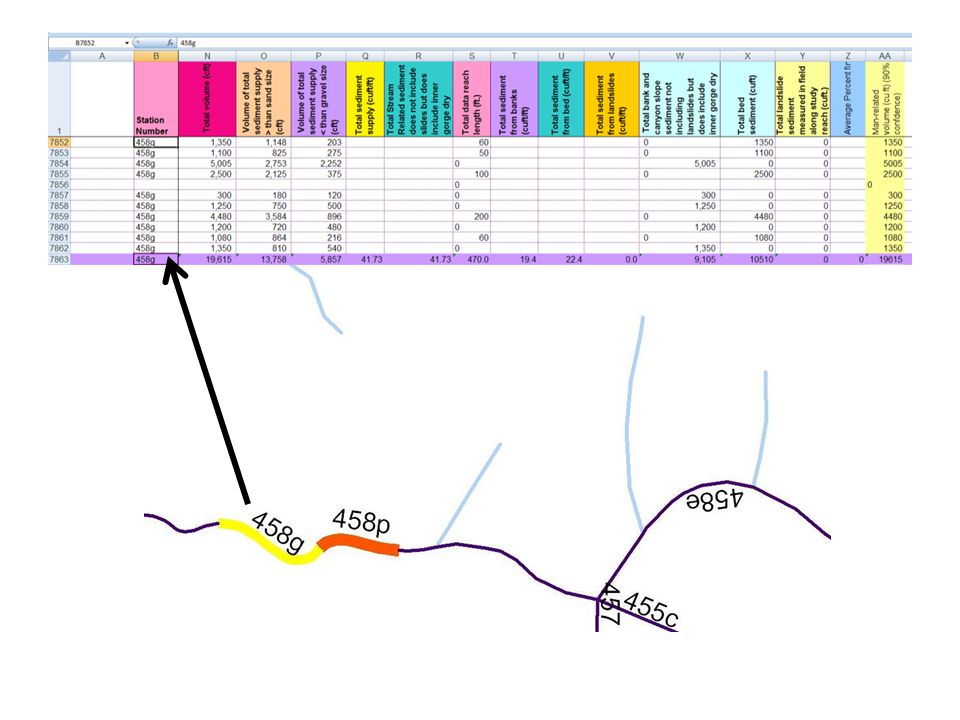
Digitized Data with Station ID & Associated Sediment Load Area of Detail

11
Observed Salmonid Presence

12
Sub-watersheds with Fish Presence and Habitat Survey

13
Additional Sub-Watersheds with Fish Presence and/or High Sediment Yield (No Habitat Survey)
")
14
Sub-watersheds with Habitat Score Assigned

15
Long-term Sediment Supply Over 150 yr time period (not per annum)
")
16
Accessibility

17
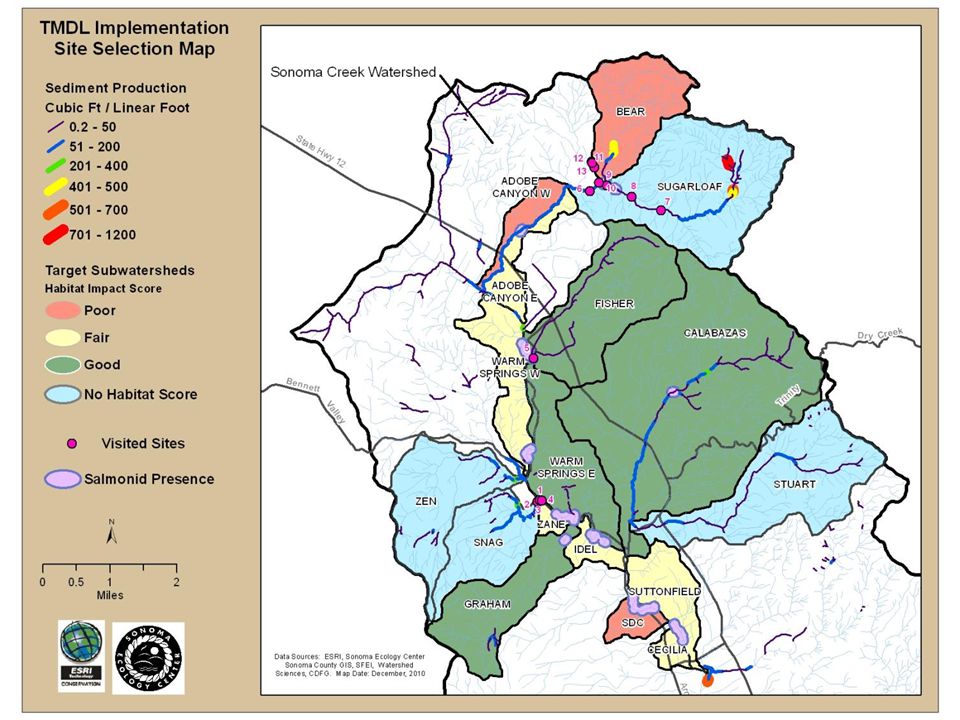
Sites Selected for Field Inspection

18
Selected Sites Site 1-2: Brewer Property, Snag Creek Site 3-4: Brewer Property, Sonoma Creek Site 5: 986 Warm Springs, Sonoma Creek Site 6: Old Slump in Adobe Canyon Road, Sonoma Creek Site 7: Headwaters Area near Visitor Center, Sonoma Creek Site 8: Waterfall, Sonoma Creek Site 9: Goodspeed Bridge, Sonoma Creek Site 10: Goodspeed Trail, Bear Creek watershed, above Sonoma Creek Site 11: Slide near Goodspeed Trail, upslope of Sonoma Creek Site 12-13: Fire Road above Goodspeed Trail, upslope of Sonoma Creek

20
Site 4: Brewer Property as viewed from Warm Springs Bridge

21
Site 6: Adobe Canyon, Sonoma Creek; Old Slump along Adobe Canyon Road

22
“More Info” Slides

23
Vector data was rasterized and assigned numeric value for particular habitat value Values ranged from 1 – 4 for Poor, Fair, Good, Very Good Raster Calculator was used to average the values in stacked raster cells Output layer was returned to vector format to be overlayed with additional data layers Areas of higher impact with Salmonid Presence are locations that will have the greatest remediation value once restored. Processing Habitat Impact Score

24
IndicatorPoorFairGood Very Good Canopy Cover<75% avg. over survey length75-85% 85- 95%>95% Shelter Rating<60 avg. rating60-80 80 - 100>100 Frequency of Primary Pools <30% primary pools by order and length30-40% 40- 50%>50% Agriculture>30% of watershed by area10-30% 0.1- 10%<0.1% Impervious Surfaces>12.01% of watershed by area 7.01- 12% 3.01- 7% 0-3% NOAA Fisheries Steelhead Habitat Indicator Ratings

Similar presentations


 Yakama Nation Division of Natural Resources.>")


 Stream Channel Pattern Substrate Chemical Properties pH Dissolved Oxygen Temperature Nutrients Turbidity.>")
>")


