Download presentation
Presentation is loading. Please wait.

1
Robert S. Galen, M.D., M.P.H. Professor and Head, Department of Health Administration, Biostatistics and Epidemiology College of Public Health University of Georgia Athens, Georgia, USA 30604 The Predictive Value of Laboratory Tests: Past, Present and Future

2
United States Atlanta Los Angeles Chicago Dallas New York LOCATION Athens Atlanta State of Georgia 60 miles northeast of Atlanta

3
HISTORY UGA The University of Georgia America’s oldest state chartered university January 27, 1785 Chartered by Georgia General Assembly The Arch, Symbol of UGA

4
Aerial photo of Sanford Stadium, holds over 92,000 cheering fans UGA Mascot, UGA VI UGA Quarterback, D.J. Shockley SANFORD STADIUM

7
Evaluating the Usefulness of Screening Tests Sensitivity, Specificity, Predictive Value Effects of pre-test probability on predictive value Trade-offs in choosing different cut-off values Trade-offs in choosing test combinations Series and Parallel Testing When to test ? Which test is best ? What does the result mean?

9
Predictive Value Table Number with positive test result Number with negative test result Totals Number with disease TPFNTP + FN Number without disease FPTNFP + TN TotalsTP + FPFN + TNTP + FP + TN + FN

10
Measures of the Validity of Tests Sensitivity Specificity Predictive value (+) Predictive value (-) Accuracy (efficiency) Sensitivity Specificity Predictive value (+) Predictive value (-) Accuracy (efficiency)
 Predictive value (-) Accuracy (efficiency) Sensitivity Specificity Predictive value (+) Predictive value (-) Accuracy (efficiency)")
11
Sensitivität = Positivität bei Krankheit = x 100 Spezifität = Negativität bei Gesundheit = x 100 Prädiktiver Wert eines positiven Tests = x 100 TP TP+FN TN TN+FP TP TP+FP

12
Effect of prevalence on predictive value when sensitivity and specificity equal 95% Prevalence of disease (%) 0.1 1 2 5 50 Predictive value of a positive test (%) 1.9 16.1 27.9 50.0 95.0
 Predictive value of a positive test (%)")
13
Effect of prevalence on predictive value when sensitivity and specificity equal 99% Prevalence (%) 0.1 1.0 2.0 5.0 50.0 Predictive value of a positive test (%) 9.0 50.0 66.9 83.9 99.0
 Predictive value of a positive test (%)")
15
Sensitivity and Specificity of Anti-HIV Tests in One Study ReagentSensitivity (%)Specificity (%)Sum (%) Abbott, Routine99.674.6174.2 Abbott, p2477.393.7171.0 Abbott, p4197.686.9184.9 Abbott, p24 & p4174.999.0173.9 Abbott, p24 or p41 or both100.081.3181.3 duPont100.088.8188.0 Electro-Nucleonics, Routine97.992.2190.1 Electro-Nucleonics, Sorin100.070.0170.0 Litton98.796.9195.6 Organon97.893.0190.8 Pasteur98.898.3197.1 Wellcome98.594.0192.5
Specificity (%)Sum (%) Abbott, Routine Abbott, p Abbott, p Abbott, p24 & p Abbott, p24 or p41 or both duPont Electro-Nucleonics, Routine Electro-Nucleonics, Sorin Litton Organon Pasteur Wellcome")
16
Coin flip data arranged in tabular format Number with positive coin flip Number with negative coin flip Totals Renovascular hypertension 5000 10,000 No renovascular Hypertension 45,000 90,000 Totals50,000 100,000

17
Combination testing for hypothetical data Test(s)Sensitivity (%)Specificity (%) Single Series Parallel A B A and B A or B 95.0 80.0 76.0 99.0 90.0 95.0 99.9 85.1
Sensitivity (%)Specificity (%) Single Series Parallel A B A and B A or B")
20
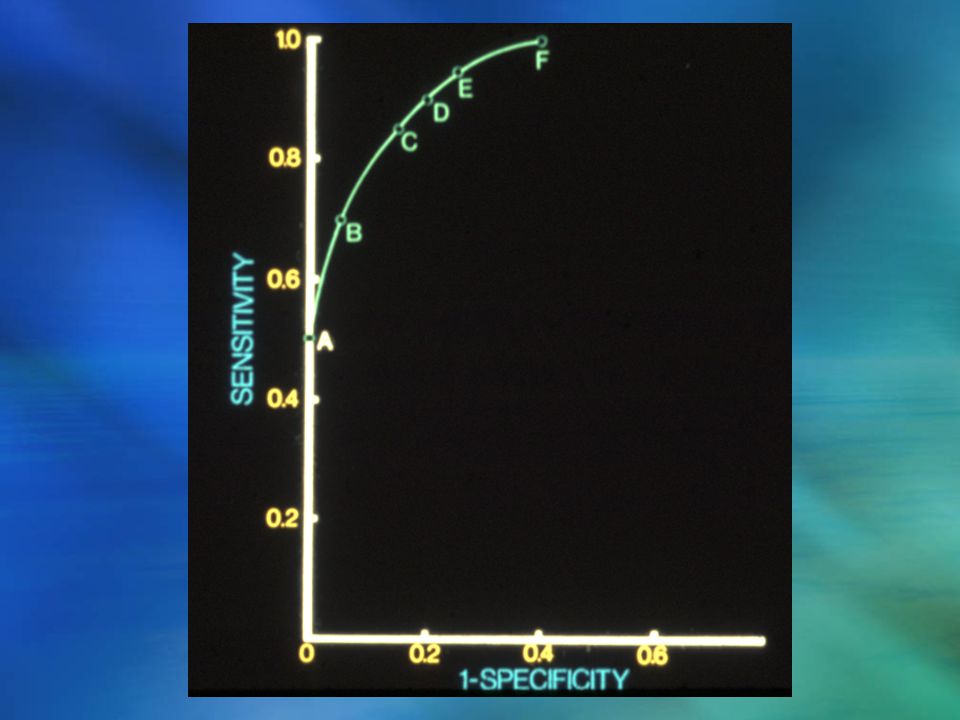
ROC Curves

21
Area under the ROC curve = 0.661 Standard error = 0.041 95% Confidence interval = 0.587 to 0.729 P (Area=0.5) = 0.0001
 =")
22
Predictive Value Number with positive test result Number with negative test result Totals Number with disease pap(1 – a)p Number without disease (1 – p)(1 – b)(1 – p)b1 – p Totalspa + (1 – p)(1 – b)p(1 – a) + (1 – p)b1
p Number without disease (1 – p)(1 – b)(1 – p)b1 – p Totalspa + (1 – p)(1 – b)p(1 – a) + (1 – p)b1")
23
IN MEMORIUM Bayes, Reverend Thomas. An essay toward solving a problem in the doctrine of chance. Philo. Trans. Roy. Soc. 53: 370- 418, 1763.

24
Laboratory advances in the predictive value of tests can drive clinical applications and improve quality of care: a) protecting the nation’s blood supply b) screening high risk patients c) screening all pregnant women d) screening everyone ? There are some challenges, however, as tests improve. The best test may not always be the most useful in a particular clinical situation. The HIV Epidemic

25
Number HIV infected 850,000 - 950,000 Number unaware of their HIV infection 180,000 - 280,000 Awareness of Serostatus among Persons with HIV, United States

26
HIV Testing Challenges “In the United States, 32 % of the people who test positive don’t come back for their results.” Dr Bernard Branson, CDC

27
Four priorities: 1. Make voluntary HIV testing a routine part of medical care 2. Implement new models for diagnosing HIV infections outside medical settings 3. Prevent new infections by working with persons diagnosed with HIV and their partners 4. Further decrease perinatal HIV transmission Advancing HIV Prevention: New Strategies for a Changing Epidemic MMWR April 18, 2003

28
Four FDA-approved Rapid HIV Tests Sensitivity (95% C.I.) Specificity (95% C.I.) OraQuick Advance - whole blood - oral fluid - plasma 99.6 (98.5 - 99.9) 99.3 (98.4 - 99.7) 99.6 (98.5 - 99.9) 100 (99.7-100) 99.8 (99.6 – 99.9) 99.9 (99.6 – 99.9) Uni-Gold Recombigen - whole blood - serum/plasma 100 (99.5 – 100) 99.7 (99.0 – 100) 99.8 (99.3 – 100)
 Specificity (95% C.I.) OraQuick Advance - whole blood - oral fluid - plasma 99.6 ( ) 99.3 ( ) 99.6 ( ) 100 ( ) 99.8 (99.6 – 99.9) 99.9 (99.6 – 99.9) Uni-Gold Recombigen - whole blood - serum/plasma 100 (99.5 – 100) 99.7 (99.0 – 100) 99.8 (99.3 – 100)")
29
OraQuick Advance HIV-1/2 CLIA-waived for finger stick, whole blood, oral fluid; moderate complexity with plasma Store at room temperature Screens for HIV-1 and 2 Results in 20 minutes

30
Obtain finger stick specimen…

31
Insert loop into vial and stir

32
Collect oral fluid specimens by swabbing gums with test device. Gloves optional; waste not biohazardous

33
Insert device; test develops in 20 minutes

34
Positive Negative Positive HIV-1/2 Reactive Control Read results in 20 – 40 minutes

35
Remember the tradeoffs… Good News: More HIV-positive people receive their test results. Bad News: Some people will receive a false-positive result before confirmatory testing.

36
Positive Predictive Value of a Single Test Depends on Specificity & Varies with Prevalence Test Specificity HIV Prevalence Predictive Value, Positive Test 10% 99% 98% 92% 5% 98% 96% 85% 2% 95% 91% 69% 1% 91% 83% 53% 0.5% 83% 71%36% 0.3% 75%60% 25% 0.1% 50% 33% 10% OraQuickSingle EIAReveal 99.9%99.8%99.1% 97% 95% 87% 77% 63% 50% 25% Uni-Gold 99.7%

37
HIV Screening with OraQuick in Labor and Delivery: the MIRIAD Study Testing of pregnant women in labor for whom no HIV test results are available; 16 hospitals in 6 cities: Atlanta, Baton Rouge, Chicago, Miami, New Orleans, New York Results: 4849 women screened 34 (0.7%) new HIV infections identified Sensitivity 100 % Specificity 99.9 % Positive Predictive value: OraQuick 90%; EIA 76% Bulterys et al, JAMA 2004; 292: 219-223
 new HIV infections identified Sensitivity 100 % Specificity 99.9 % Positive Predictive value: OraQuick 90%; EIA 76% Bulterys et al, JAMA 2004; 292:")
38
USPSTF Recommends Screening All Pregnant Women for HIV “The United States Preventive Services Task Force continues to recommend screening all adolescents and adults at high risk for HIV and now also recommends screening all pregnant women.”

39
USPSTF Recommends Screening All Pregnant Women for HIV Evidence is good that pregnant women find recommended regimens of highly antiretroviral therapy (HAART) to be acceptable, and that HAART significantly lowers rates of mother-to-child transmission. Early diagnosis of maternal HIV infection also facilitates discussion of elective cesarean section and avoidance of breast-feeding, which may lower HIV transmission rates.

40
HIV Screening with OraQuick in Labor and Delivery: the MIRIAD Study The CDC now recommends routine rapid HIV testing using an opt-out approach (ie, a woman is informed that HIV testing will be routinely done during labor if her HIV status is unknown but she may decline testing). Rationale: there is a brief window of opportunity for interventions to decrease HIV transmission to the newborn Bulterys et al, JAMA 2004; 292: 219-223

41
HIV Screening with OraQuick in Labor and Delivery: the MIRIAD Study “In many settings, including in the developing world, pregnant women with unknown HIV status are often seen by clinicians for the first time during labor. Rapid testing during labor can enable pregnant women with undocumented HIV status to learn their HIV infection status so they can receive antiretroviral prophylaxis and be referred for comprehensive medical care and follow-up.” Bulterys et al, JAMA 2004; 292: 219-223

42
Nucleic acid amplification testing Two steps forward and one step back: Do antibody tests miss cases that could otherwise be diagnosed? We know there have been false-negatives during the acute infection period. How bad is the problem ?

43
Nucleic acid amplification testing “ In this study, we found that antibody tests alone detected only 96 percent of HIV infections, as compared with an algorithm that included nucleic acid amplification tests to detect acute HIV infections.” Pilcher et.al. NEJM 2005; 352: 1873-83

44
Nucleic acid amplification testing “The addition of nucleic amplification testing to an HIV testing algorithm significantly increases the identification of cases of infection without impairing the performance of diagnostic testing. The detection of highly contagious, acutely infected persons creates new opportunities for HIV surveillance and prevention.” Pilcher et.al. NEJM 2005; 352: 1873-83

45
Nucleic acid amplification testing “ We believe that the work that has been done to date…is now sufficient to allow us to conclude that this form of testing should be a standard tool for the prevention and surveillance of HIV infection and for the care of infected persons.” Pilcher et.al. NEJM 2005; 352: 1873-83

46
Nucleic acid amplification testing What is the value of a test, if patients don’t get the result ? In some clinical situations the best test may not solve the problem! Tests must be selected in the clincial context they will be used, not in a vacuum!

47
Routine Population-Wide HIV Screening May Be Cost-Effective “The findings of Paltiel et al. and Sanders et al. show that, given the availability of effective therapy and preventive measures, it is possible to improve care and perhaps influence the course of the epidemic through widespread, effective, and cost-effective screening.” Bozzette S.A. N.E.J.M. 2005; 352: 620-621.

48
Routine Population-Wide HIV Screening May Be Cost-Effective “Failure to implement widespread routine screening for HIV infection represents a critical disservice to patients who are currently infected, those at risk for infection, and the future health of the nation.” Bozzette S.A. N.E.J.M. 2005; 352: 620-621.

50
What is a risk factor? The traits, factors, and characteristics that predispose to the development of atherosclerosis have been collectively termed “risk factors.” Not all risk factors are useful laboratory tests

51
Not all risk factors are useful lab tests Predicting risk is a different problem than classification. We classify patients to decide to treat or not. If we want to use risk factors this way, they need to be evaluated by the test characteristics of sensitivity, specificity, predictive value and ROC curve analysis. This was done and published in July, 2006.

52
ROC Curves

53
July, 2006: A challenging month for novel risk factors Is routine screening of CRP warranted? Folsom et al. Arch Intern Med 166: 1368-73 Lloyd-Jones & Tian. 1342-1344 Lloyd-Jones et al. Annals: 145:35-42 Cook et al. Annals: 145: 21-29 Smith et al. Annals: 145: 70-72

54
ARIC Study shows little benefit of measuring 19 novel risk factors 15,792 adults followed since 1987-1989 Participants had physical exam, assessment of major risk factors and novel markers Inflammation, endothelial function, fibrin formation, fibrinolysis, B vitamins, antibodies to infectious agents Folsom et al. Arch Intern Med. 2006; 166:1368-1373

55
ARIC Study shows little benefit of measuring 19 novel risk factors Change in AUC was used to assess the additional contribution of novel risk markers to CHD prediction beyond that of traditional risk factors Traditional risk factor model predicted CHD well: AUC 0.8 CRP did not add significantly to the AUC and neither did most other novel risk factors Folsom et al. Arch Intern Med. 2006; 166:1368-1373

56
ARIC Study shows little benefit of measuring 19 novel risk factors “C-reactive protein level does not emerge as a clinically useful addition to basic risk factor assessment for identifying patients at risk of a first CHD event.” “Routine measurement of these novel markers is not warranted for risk assessment.” Folsom et al. Arch Intern Med. 2006; 166:1368-1373

57
Predicting Cardiovascular Risk “On their face, these results appear astonishing. Can it really be that 19 of the most exciting new markers for CVD, about which there are thousands of published articles and on which entire careers have been based, do not add anything substantial to risk prediction for CVD?” Lloyd-Jones, Tian. Arch Intern Med. 2006; 166:1342-1344.

58
Predicting Cardiovascular Risk Age adjusted hazard ratios may be similar to those of traditional risk factors Traditional risk factors have been proven to have a causal role in CHD and are targets of therapy They must form the basic risk prediction model Lloyd-Jones, Tian. Arch Intern Med. 2006; 166:1342-1344.

59
Predicting Cardiovascular Risk A new marker is useful only if it corrects a substantial portion of misclassification by the existing risk score, which the 19 novel markers in the ARIC study did not do. Lloyd-Jones, Tian. Arch Intern Med. 2006; 166: 1342-1344.

60
Predicting Cardiovascular Risk The established risk factors should remain the focus of CHD risk estimation and prevention for now and routine measurement of any of these 19 novel markers for the entire population cannot be recommended. Lloyd-Jones, Tian. Arch Intern Med. 2006; 166:1342-1344.

61
Predicting Cardiovascular Risk “There is no definitive evidence (in the literature) that, for most individuals, CRP adds substantial predictive value above that provided by risk estimation using traditional risk factors for CVD.” Lloyd-Jones et al. Ann Intern Med. 2006; 145: 35-42

62
Quality Laboratory Testing Doing the right test (precisely and accurately) in the right patient at the right time to effectuate a positive clinical outcome in a cost-effective way. Much of the testing we engage in does not meet these requirements.

63
Quality Laboratory Testing In the future, laboratory tests will be evaluated in the context of the clinical decision making they contribute to, not just in the laboratory! Quality testing will be integrated into cost effective medical care, based on sound evidence and clinical trials.

Similar presentations


 Public Health England London,>")


 of organ donors:>")