Download presentation
Presentation is loading. Please wait.

1
Example: Test score A survey was conducted to measure the relationship between hours spent on studying JMSC0103 and the scores in the final examination. Is it more effort put on, better results then? Regression Analysis

2
Hours studiedTest score xy 431 958 1065 1473 437 744 1260 2291 121 1784

3
Scatter diagram

4
Example: Test score (revisited) Find the regression model of the test scores on the number of hours studied. A person studied 14 hours for the test, can we make a prediction on his average test score?

5
y = 1 x + 0 –y = score –x = hours spent 1 =SLOPE(X,Y) 0 =INTERCEPT(X,Y)
 0 =INTERCEPT(X,Y)")
6
The equation of the least square line is For a given value of x=14 (hours), the predicted test score is
, the predicted test score is")
7
For a given value of y= 80, the predicted hours for study is x = (80-21.69)/3.471 = 16.8 hours
/3.471 = 16.8 hours")
8
Example: Test score r xy = 0.9762 r 2 = 0.9530 The regression relationship is quite strong as 95.3% of the variation in number of cars sold can be explained by the linear regression model.

9
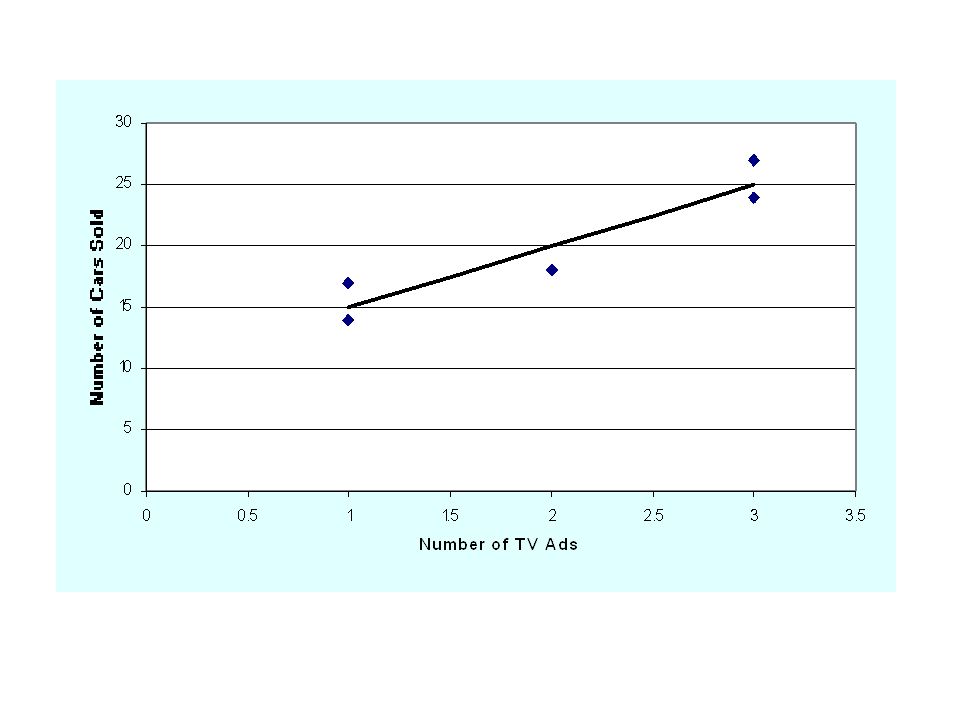
Example: Sales Company A has a special week-long sale. As part of the advertising campaign, it runs one or more television commercials during the weekend preceding the sale. Data from a sample of 5 pervious sales are shown below.

10
Number of TV AdsNumber of Cars Sold 114 324 218 117 327

12
Estimated Simple Linear Regression Equation y = β 0 + β 1 x β 1 (slope) = 5 β 0 (intercept) = 10 Estimated Regression Equation
 = 5 β 0 (intercept) = 10 Estimated Regression Equation ")
13
Coefficient of Determination The regression relationship is very strong 88% of variance in number of cars sold can be explained by the linear regression model.

Similar presentations