Download presentation
Presentation is loading. Please wait.

1
Climate in the Last 20,000 years Last Glacial Maximum Last Glacial Maximum Low temperatures and expansive ice sheets Low atmospheric CO 2 levels (190 ppmv) Dry, windy and sparsely vegetated landscapes Quite different mammalian fauna
 Dry, windy and sparsely vegetated landscapes Quite different mammalian fauna")
2
Why the Cooling? Seasonal insolation similar to today Seasonal insolation similar to today Expected if glaciers reaching maximum extent Still insolation cannot explain climate 20K years ago Still insolation cannot explain climate 20K years ago Cooling caused by Cooling caused by Presence of ice sheets Lower atmospheric greenhouse gas levels

3
CLIMAP Reconstructions Continental glaciations (25% land mass; 10% today) Continental glaciations (25% land mass; 10% today) Earth 4°C colder Earth 4°C colder
 Continental glaciations (25% land mass; 10% today) Earth 4°C colder Earth 4°C colder")
5
CLIMAP Reconstructions N. Atlantic 8°C colder and sea ice more extensive N. Atlantic 8°C colder and sea ice more extensive Less cooling away from northern ice sheets Expansion of Southern Ocean sea ice Expansion of Southern Ocean sea ice Equatorial temperatures a little colder Equatorial temperatures a little colder

6
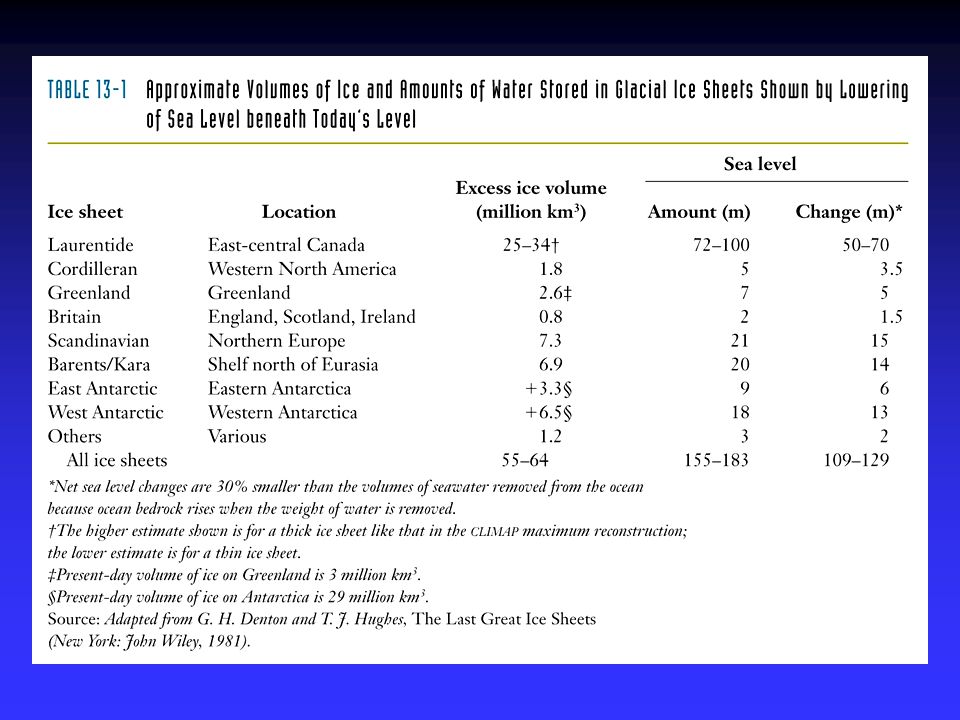
Extent of Ice Sheets Ice sheets were at maximum extent 21,000 years ago Ice sheets were at maximum extent 21,000 years ago Major ice sheets covered shelf regions Barents and part of Kara Seas Barents and part of Kara Seas

7
Ice Sheet Thickness CLIMAP assumed thick, mature ice sheets CLIMAP assumed thick, mature ice sheets Sea level did not drop enough to accommodate thick ice sheets N. American ice sheets rested on sediments N. American ice sheets rested on sediments Slid more readily Bedrock rebound rates support thin ice sheets Bedrock rebound rates support thin ice sheets

8
Dry Glacial Environments Evidence for glacial aridity is bountiful Evidence for glacial aridity is bountiful Glacial loess deposits widespread Glacial loess deposits widespread

9
Dry Glacial Environments Desert environments source of much dust today Desert environments source of much dust today At LGM, environments produced more dust At LGM, environments produced more dust

10
Dry Glacial Environments At LGM At LGM Sand dune deposition more extensive Drier climate Stronger winds Virtually every region on Earth Virtually every region on Earth Shows LGM drier and dustier Unfortunately, model simulations poor

11
COHMAP Combined terrestrial ecology – modeling approach to understand Holocene Combined terrestrial ecology – modeling approach to understand Holocene Assemble records of boundary conditions Climate drivers Ice sheet size and greenhouse gasesIce sheet size and greenhouse gases Model simulations using changing boundary conditions Compared with climate records from marine and lacustrine environments

12
Pollen Analysis Rainfall and temperature control distribution of plants Rainfall and temperature control distribution of plants Percentages of pollen allow climate reconstruction and can be 14 C dated Many lakes in northern N. America formed from glacial retreat Many lakes in northern N. America formed from glacial retreat Contain pollen from LGM to present

13
Pollen in Northern Lakes Spruce pollen indicates cold conditions Spruce pollen indicates cold conditions Oak pollen indicates warmer climates Oak pollen indicates warmer climates Prairie grass pollen indicate a drier climate Prairie grass pollen indicate a drier climate Transitions follow deglaciation of region Transitions follow deglaciation of region

14
Pollen Distributions Pollen analyzed in lake cores worldwide Pollen analyzed in lake cores worldwide Provide geographic distribution of vegetation LGM Deglaciation Geographic distribution of vegetation Compared with output model simulations

15
Spruce Distributions Spruce found today in northeastern Canada Spruce found today in northeastern Canada During LGM, found only in northern US lakes Distribution agrees well with model simulations

16
GCM and High-Level Winds Presence of ice sheets can redirect jet stream Presence of ice sheets can redirect jet stream Low-level atmospheric flow blocked by ice LGM flow causes clockwise spiral of cold air LGM flow causes clockwise spiral of cold air Southwestward flow over N. Atlantic Flow west across US Flow west across US Clockwise spiral over Scandinavia cooled Europe Clockwise spiral over Scandinavia cooled Europe Upper level jet crossed Atlantic and flowed into Europe at 45-50°N Upper level jet crossed Atlantic and flowed into Europe at 45-50°N

17
Cold Glacial North Atlantic Largest ocean cooling in N. Atlantic Largest ocean cooling in N. Atlantic Pushed the Gulf Stream and N. Atlantic Drift towards Portugal Highest rates of deposition of ice rafted debris Highest rates of deposition of ice rafted debris North of 50°N Southward flowing icebergs encountered warm water and melted

18
Southwestern United States Southward displacement of jet stream Southward displacement of jet stream Brought increased moisture to SW Increased winter storm Cloudiness inhibited evaporation Most extensive lake deposits glacial Lake Bonneville Pacific NW dry Pacific NW dry Southward displacement of jet stream Cool, dry west winds from mid-continent

19
Eastern United States Extensive lake deposits allow rigorous model tests Extensive lake deposits allow rigorous model tests Mismatch for elm pollen (warm-adapted diciduous) Model simulations underestimate actual cooling Cooling may be due to Mississippi River inflow Gulf of Mexico, cooling much of SE United States
 Model simulations underestimate actual cooling Cooling may be due to Mississippi River inflow Gulf of Mexico, cooling much of SE United States")
20
LGM in Europe Modern vegetation dominated by forests Modern vegetation dominated by forests Conifers in north Deciduous in south At LGM At LGM Arctic tundra large area south of ice sheets Mostly prairie and grassy steppe Forests only on southern margin

21
Cooling in Europe Clockwise flow of cold low-level winds Clockwise flow of cold low-level winds Across Scandinavian ice sheets Cold North Atlantic sea surface temperatures Cold North Atlantic sea surface temperatures Mediterranean temperatures moderated Mediterranean temperatures moderated Winter storms Brought to region by southward-shifted jet stream across the Atlantic

22
LGM in Asia Modern Asia covered by forests Modern Asia covered by forests LGM grass steppe LGM grass steppe Forests largely absent Very harsh climate Probably produced deep permafrost Growth of grasses during summer thaw Model simulations suggest strong high-pressure cell in Siberia during winter Moisture to region from N. Atlantic nonexistent Cold N. Pacific and Bering Sea from Siberian winds

23
LGM in Antarctica Winter sea ice extended further north Winter sea ice extended further north Shift in the Polar Front (region of high productivity) Not simple; driven by bathymetry Simple models suggest Simple models suggest Lower CO 2 levels Decreased flow of warm saline NADW
 Not simple; driven by bathymetry Simple models suggest Simple models suggest Lower CO 2 levels Decreased flow of warm saline NADW")
24
LGM in Australia Showed expanded development of dune deposits Showed expanded development of dune deposits Arid climate and intensification of CCW winds Large regions north of Australia exposed with drop in sea level Probably resulted from lower CO 2 levels Shift of storms to south in Southern Ocean

25
LGM in South America Suggestion of drier conditions in Amazon Suggestion of drier conditions in Amazon Cooler ocean SST, lower sea level and low CO 2 Know Amazon was wetter from Paul Baker’s work Know Amazon was wetter from Paul Baker’s work Wetter from south shift in westerly winds Even if Amazon wetter Even if Amazon wetter Could not offset loss of vegetation in N. hemisphere

26
Cold LGM Tropics Conundrum CLIMAP studies indicate tropical cooling CLIMAP studies indicate tropical cooling 1-2°C compared with today in most regions Southern tropical Pacific 1°C warmer Terrestrial indicators suggest 4-6°C cooling Terrestrial indicators suggest 4-6°C cooling What caused the cooling? What caused the cooling? Was it glaciers? Too far away Was it insolation? Similar to today Was it greenhouse gases? Perhaps, as a result of lower trapping of background radiation Was it the data?

27
LGM a Model for Greenhouse World? If LGM tropical cooling from CO 2 If LGM tropical cooling from CO 2 Could be a model for future climate change Response of the Earth climate system Atmospheric CO 2 change of ~90 ppmvAtmospheric CO 2 change of ~90 ppmv What will be the future warming of the tropical oceans? Warming of the Planet?

28
CLIMAP Cooling: Pros Temperature estimates from faunal assemblages Temperature estimates from faunal assemblages Species that existed in tropics at LGM Species that existed in tropics at LGM Not much different from modern Not much different from modern Conclude that cooling was slight (average 1.5°C) Conclude that cooling was slight (average 1.5°C)
 Conclude that cooling was slight (average 1.5°C)")
29
CLIMAP Cooling: Pros Independent agreement from alkenones Independent agreement from alkenones Alkenone paleotemperatures agree with those from faunal assemblages 18 O from planktic foraminifera Also show general agreement When ice volume signal removed (1.1‰)When ice volume signal removed (1.1‰)
When ice volume signal removed (1.1‰)")
30
CLIMAP Cooling: Cons Faunal assemblage have low sensitivity to temperature change at 20°C Faunal assemblage have low sensitivity to temperature change at 20°C No change observed because no change expected Food, not temperature controlled species Pacific a poor place to examine calcareous shells Pacific a poor place to examine calcareous shells Extensive dissolution of carbonate Preferential or no preservation Alkenone and 18 O data suggest agreement in some parts of the world ocean Alkenone and 18 O data suggest agreement in some parts of the world ocean Not all Ocean margins and enclosed seas Ocean margins and enclosed seas Probably cooler – no data or unique assemblages limit confirmation of speculation

31
Large LGM Cooling: Pros Margins of tropical and subtropical mountain glaciers Margins of tropical and subtropical mountain glaciers Descended 600-1000 m Using modern lapse-rate cooling suggests 4-6°C cooling Descent of tree line and other vegetation on tropical mountains Descent of tree line and other vegetation on tropical mountains Lapse-rate cooling again suggests 4-6°C drop in temperature

32
Large LGM Cooling: Cons Terrestrial cooling uses modern lapse-rate (6.5°C km -1 ) Terrestrial cooling uses modern lapse-rate (6.5°C km -1 ) Change of only 1°C km -1 would resolve discrepancies Consistent with models assuming steeper lapse-rate in drier glacial tropics Terrestrial environments difficult to date Terrestrial environments difficult to date Suggestion that plants are sensitive to CO 2 Suggestion that plants are sensitive to CO 2 Require growth was limited by CO 2 Could help explain lower vegetation lines
 Terrestrial cooling uses modern lapse-rate (6.5°C km -1 ) Change of only 1°C km -1 would resolve discrepancies Consistent with models assuming steeper lapse-rate in drier glacial tropics Terrestrial environments difficult to date Terrestrial environments difficult to date Suggestion that plants are sensitive to CO 2 Suggestion that plants are sensitive to CO 2 Require growth was limited by CO 2 Could help explain lower vegetation lines")
33
Logical Conclusions Marginal basins colder than CLIMAP estimates Marginal basins colder than CLIMAP estimates Logical that shallow basins cool more than deep ocean Open ocean cooled a little Land cooled a lot Coastal regions cooled somewhat more than deep oceans

Similar presentations


 and afterwards What was climate like during LGM? What happened to end LGM? How has climate varied since LGM? What.>")

>")


 1. Is it warming? --climate proxy info (recap) -- info from historical & instrumental records 2. What.>")


 Lesson 1 Starter Slides on the nature and timing of the LGM.>")