Download presentation
Presentation is loading. Please wait.

1
Comparison of Reliability Measures under Factor Analysis and Item Response Theory —Ying Cheng , Ke-Hai Yuan , and Cheng Liu Presented by Zhu Jinxin

2
Outline of the Presentation Introduction of four reliability coefficients: , , , and The relationship among them Conclusion and discussion

3
Cronbach’s alpha One of the definitions is K is the number of components (items or testlets) X 2 is the variance of the observed total test scores, Yi 2 is the variance of component i for the current sample of persons.
 X 2 is the variance of the observed total test scores, Yi 2 is the variance of component i for the current sample of persons.")
4
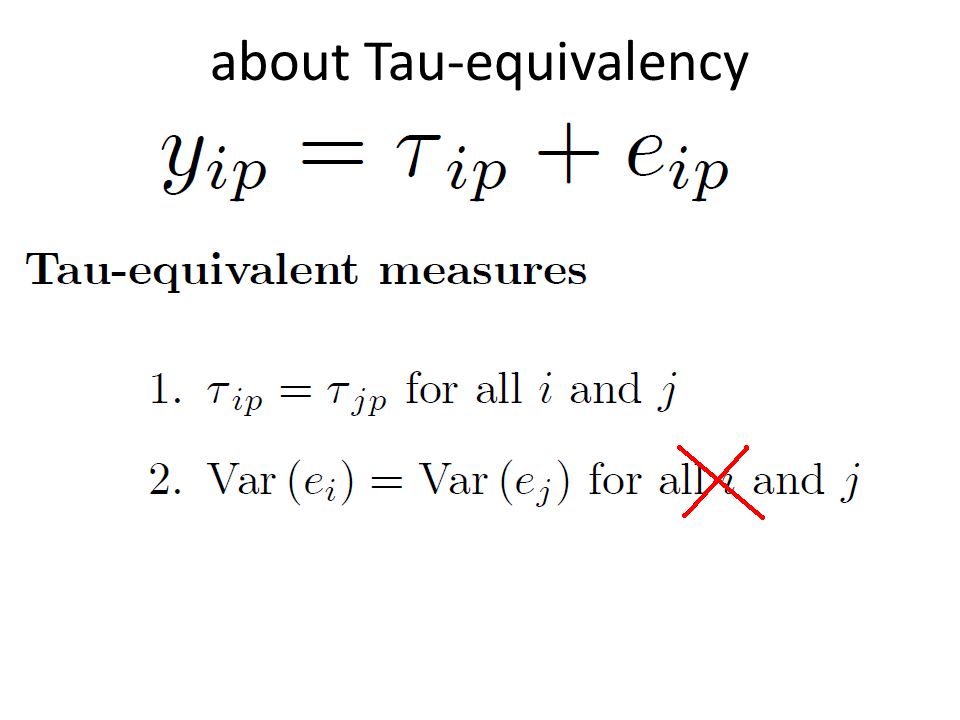
Cronbach’s alpha’s feature It is most widely used Raw sum score is used may underestimates reliability at population level, when the assumption of essential tau- equivalency is violated

5
about Tau-equivalency

7
In this case, the reliability is underestimated by which is only a lower-bound estimate of the true reliability of scale when measures are congeneric.

8
in congeneric measures in Single-factor model

9
Suppose we have m items

10
in congeneric measures in Single-factor model Variance of true score Variance of unweighted composite score

11
feature of 1.It neglects that people with the same sum score can have completely deferent response patterns. ≧ when

12
in congeneric measures in Single-factor model ≧≧≧≧ when is equal to ?

13
Reliability in IRT The variance of the MLE is (approximately) given by the inverse of the information The variance of is 1 in MLE, in which The study use information in a broader sense by equating it with the inverse of a variance even when the parameter estimate is not an MLE so
 given by the inverse of the information The variance of is 1 in MLE, in which The study use information in a broader sense by equating it with the inverse of a variance even when the parameter estimate is not an MLE so")
14
from information perspective

15
from information perspective

16
from information perspective

17
Reliability in IRT With a single parameter, I, the information is defined as the negative expected value of the second derivative of the log likelihood function. The IRT models directly relate the discrete responses to an underlying latent factor. When q is normally distributed, the normal ogive IRT models are equivalent to the item factor analysis model.

18
Reliability in IRT For binary response Where id the response and Approximately

19
Reliability in IRT For binary response

20
Reliability in IRT For binary response The information is defined as the negative expected value of the second derivative of the log likelihood function: For each item For test

21
Reliability in IRT For binary response the reliability is and (the deduction is put in the appedix)
")
22
Reliability in IRT For response of ordered categories, supposing the continuous response to item j is discretized by g threshold. The information of jth item is given by

23
The relationship ≧ ≧ It is expected that There is no dominant relationship between (2) Simulation demonstrated that, as the number of response increase, can exceed in practice.
 Simulation demonstrated that, as the number of response increase, can exceed in practice.")
24
Conclusion Keep as many many response categories as possible and use ML factor score. However, after having a certain number of response options, it may not be worth adding more.

25
Discussion Only graded response (order categories) models is studied. (comparing to other types polytomous IRT models) Only unidimensional models are studied.
 Only unidimensional models are studied..")
26
Thank you!

Similar presentations


 Steps for Creating a Personality Questionnaire Generate an item pool Administer the items to a sample of people Assess the uni-dimensionality.>")
 Tests>")


 But what if the sampling distribution.>")
=“geometric distribution”), 9-R9(a,b) Recommended Questions: 9.1, 9.8, 9.20, 9.23, 9.25.>")


 Joseph Olsen, Dean Busby, & Lena Chiu Jan 23, 2015.>")

