Download presentation
Presentation is loading. Please wait.

1
5-4 The Slope Formula Warm Up Lesson Presentation Lesson Quiz
Holt Algebra 1 Warm Up Lesson Presentation Lesson Quiz

2
Warmup: Put this in your Journal!
1. The table shows the number of bikes made by a company for certain years. Find the rate of change for each time period. During which time period did the number of bikes increase at the fastest rate? Get your calculator & graph this table. STAT, STATPLOT, Window Find the slope of each line. 2. 3.

3
Lesson Quiz: Part I 1. The table shows the number of bikes made by a company for certain years. Find the rate of change for each time period. During which time period did the number of bikes increase at the fastest rate? Get your calculator & graph this table. STAT, STATPLOT, Window 1 to 2: 3; 2 to 5: 4; 5 to 7: 0; 7 to 11: 3.5; from years 2 to 5

4
Lesson Quiz: Part II Find the slope of each line. 2. 3. undefined

5
Warm Up Add or subtract. 1. 4 + (–6) 2. –3 + 5 3. –7 – 7 4. 2 – (–1)
(–6) –3 + 5 3. –7 – – (–1) –2 2 –14 3 Find the x- and y-intercepts. 5. x + 2y = 8 6. 3x + 5y = –15 x-intercept: 8; y-intercept: 4 x-intercept: –5; y-intercept: –3
 2. – –7 – – (–1) –2. 2. – Find the x- and y-intercepts. 5. x + 2y = x + 5y = –15. x-intercept: 8; y-intercept: 4. x-intercept: –5; y-intercept: –3.")
6
Objective Find slope by using the slope formula.

7
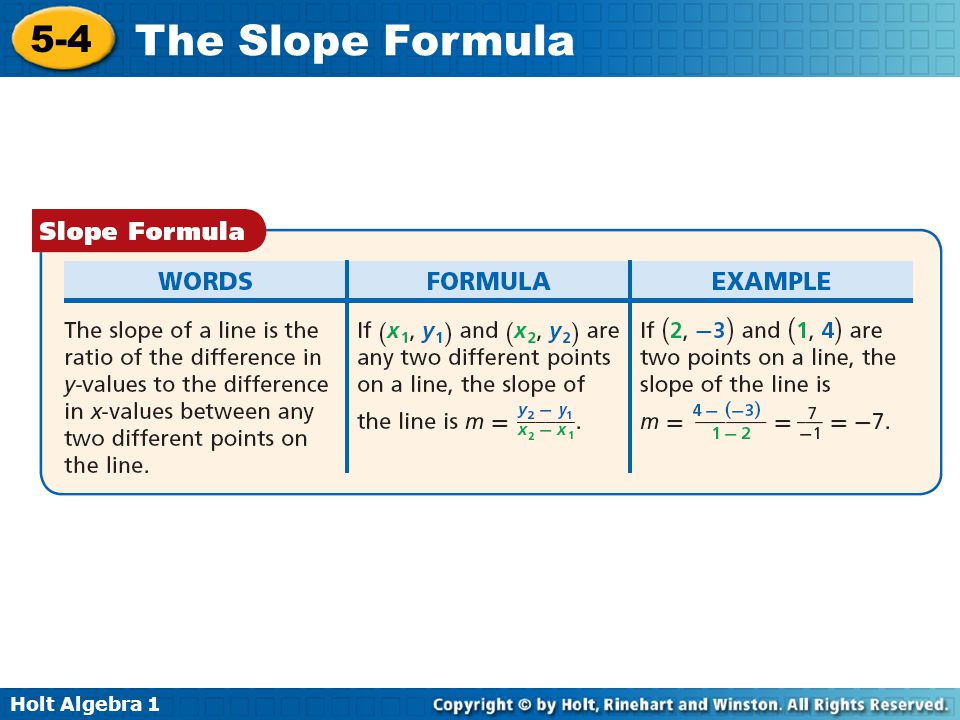
In Lesson 5-3, slope was described as the constant rate of change of a line. You saw how to find the slope of a line by using its graph. There is also a formula you can use to find the slope of a line, which is usually represented by the letter m. To use this formula, you need the coordinates of two different points on the line.

10
Example 1: Finding Slope by Using the Slope Formula
Find the slope of the line that contains (2, 5) and (8, 1). Use the slope formula. Substitute (2, 5) for (x1, y1) and (8, 1) for (x2, y2). Simplify. The slope of the line that contains (2, 5) and (8, 1) is
 and (8, 1). Use the slope formula. Substitute (2, 5) for (x1, y1) and (8, 1) for (x2, y2). Simplify. The slope of the line that contains (2, 5) and (8, 1) is .")
11
Check It Out! Example 1a Find the slope of the line that contains (–2, –2) and (7, –2). Use the slope formula. Substitute (–2, –2) for (x1, y1) and (7, –2) for (x2, y2). Simplify. = 0 The slope of the line that contains (–2, –2) and (7, –2) is 0.
 for (x1, y1) and (7, –2) for (x2, y2). Simplify. = 0. The slope of the line that contains (–2, –2) and (7, –2) is 0.")
12
Sometimes you are not given two points to use in the formula
Sometimes you are not given two points to use in the formula. You might have to choose two points from a graph or a table.

13
Example 2A: Finding Slope from Graphs and Tables
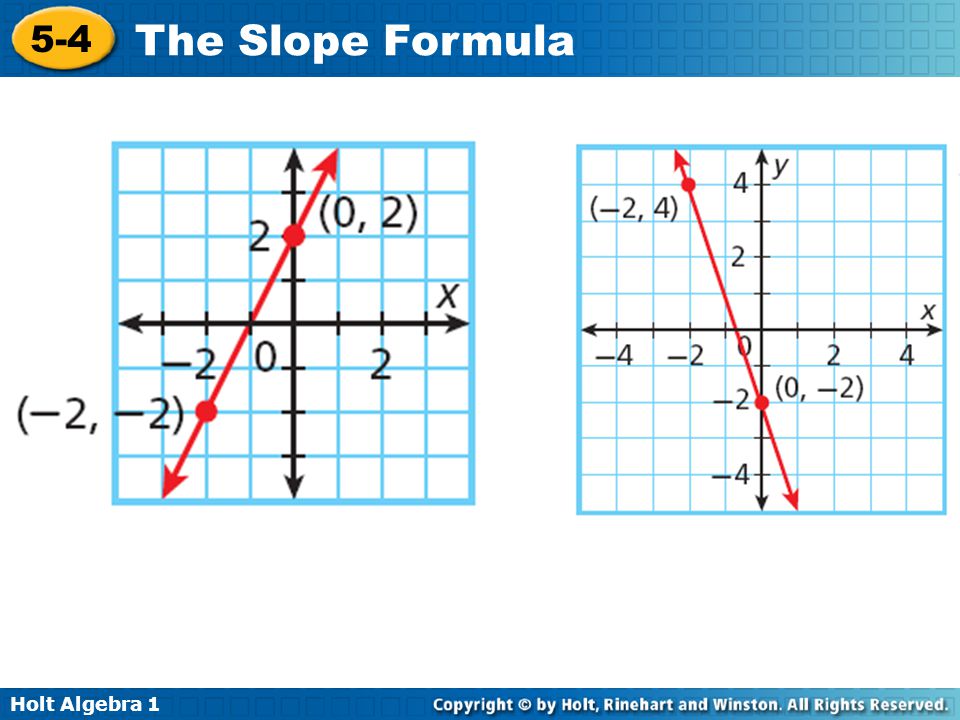
The graph shows a linear relationship. Find the slope. Let (0, 2) be (x1, y1) and (–2, –2) be (x2, y2). Use the slope formula. Substitute (0, 2) for (x1, y1) and (–2, –2) for (x2, y2). Simplify.
 be (x1, y1) and (–2, –2) be (x2, y2). Use the slope formula. Substitute (0, 2) for (x1, y1) and (–2, –2) for (x2, y2). Simplify.")
14
Example 2B: Finding Slope from Graphs and Tables
The table shows a linear relationship. Find the slope. Step 1 Choose any two points from the table. Let (0, 1) be (x1, y1) and (–2, 5) be (x2, y2). Step 2 Use the slope formula. Use the slope formula. Substitute (0, 1) for and (–2, 5) for . Simplify. The slope equals −2
 be (x1, y1) and (–2, 5) be (x2, y2). Step 2 Use the slope formula. Use the slope formula. Substitute (0, 1) for. and (–2, 5) for. . Simplify. The slope equals −2.")
15
The graph shows a linear relationship. Find the slope.
Check It Out! Example 2b The graph shows a linear relationship. Find the slope. Let (–2, 4) be (x1, y1) and (0, –2) be (x2, y2). Use the slope formula. Substitute (–2, 4) for (x1, y1) and (0, –2) for (x2, y2). Simplify.
 be (x1, y1) and (0, –2) be (x2, y2). Use the slope formula. Substitute (–2, 4) for (x1, y1) and (0, –2) for (x2, y2). Simplify.")
16
The table shows a linear relationship. Find the slope.
Check It Out! Example 2d The table shows a linear relationship. Find the slope. Step 1 Choose any two points from the table. Let (0, 0) be (x1, y1) and (–2, 3) be (x2, y2). Step 2 Use the slope formula. Use the slope formula. Substitute (0, 0) for (x1, y1) and (–2, 3) for (x2, y2). Simplify
 be (x1, y1) and (–2, 3) be (x2, y2). Step 2 Use the slope formula. Use the slope formula. Substitute (0, 0) for (x1, y1) and (–2, 3) for (x2, y2). Simplify.")
17
Remember that slope is a rate of change
Remember that slope is a rate of change. In real-world problems, finding the slope can give you information about how a quantity is changing.

18
Example 3: Application The graph shows the average electricity costs (in dollars) for operating a refrigerator for several months. Find the slope of the line. Then tell what the slope represents. Step 1 Use the slope formula.
 for operating a refrigerator for several months. Find the slope of the line. Then tell what the slope represents. Step 1 Use the slope formula.")
19
Example 3 Continued Step 2 Tell what the slope represents. In this situation y represents the cost of electricity and x represents time. So slope represents in units of . A slope of 6 mean the cost of running the refrigerator is a rate of 6 dollars per month.

20
If you know the equation that describes a line, you can find its slope by using any two ordered-pair solutions. It is often easiest to use the ordered pairs that contain the intercepts.

21
Example 4: Finding Slope from an Equation
Find the slope of the line described by 4x – 2y = 16. Step 1 Find the x-intercept. Step 2 Find the y-intercept. 4x – 2y = 16 4x – 2y = 16 4x – 2(0) = 16 Let y = 0. 4(0) – 2y = 16 Let x = 0. 4x = 16 x = 4 –2y = 16 y = –8 Step 3 The line contains (4, 0) and (0, –8). Use the slope formula.
 = 16. Let y = 0. 4(0) – 2y = 16. Let x = 0. 4x = 16. x = 4. –2y = 16. y = –8. Step 3 The line contains (4, 0) and (0, –8). Use the slope formula.")
22
Check It Out! Example 4 Find the slope of the line described by 2x + 3y = 12. Step 1 Find the x-intercept. Step 2 Find the y-intercept. 2x + 3y = 12 2x + 3y = 12 2x + 3(0) = 12 Let y = 0. 2(0) + 3y = 12 Let x = 0. 2x = 12 x = 6 3y = 12 y = 4 Step 3 The line contains (6, 0) and (0, 4). Use the slope formula.
 = 12. Let y = 0. 2(0) + 3y = 12. Let x = 0. 2x = 12. x = 6. 3y = 12. y = 4. Step 3 The line contains (6, 0) and (0, 4). Use the slope formula.")
23
NOTES: (x1, y1) (x2, y2) EX: (1, 4) AND (2, -3)
Get your two points either off the graph or from the table If you have an equation, you can get two points for the slope Formula by determining the intercepts. x-intercept (x, 0) y-intercept (0, y)
 y-intercept (0, y)")
24
Assignment: L5-4 page 324 #12-48 evens

25
1. Find the slope of the line that contains (5, 3) and (–1, 4).
Lesson Quiz 1. Find the slope of the line that contains (5, 3) and (–1, 4). 2. Find the slope of the line. Then tell what the slope represents. 50; speed of bus is 50 mi/h 3. Find the slope of the line described by x + 2y = 8. #4&5 on next slide
 and (–1, 4). 2. Find the slope of the line. Then tell what the slope represents. 50; speed of bus is 50 mi/h. 3. Find the slope of the line described by x + 2y = 8. #4&5 on next slide.")
26
Find the slope of the line described by each equation (hint: find your intercepts first)
5x = 90 – 9y 5y = 130 – 13x

27
Discovering Linear Functions with Graphing Calculators
Reset Memory: 2nd, MEM, 7, 1, 2 Press y=; Enter y1 = x Press GRAPH Graph y2 = x What changed? What stayed the same? Graph y3 = x – What changed? What stayed the same? Clear out y2 and y3 Graph y2 = 2x What changed? What stayed the same? Graph y3 = 3x What changed? What stayed the same? Graph y4 = 0.5x What changed? What stayed the same? Clear out y2 through y4 Graph y2 = -x What changed? What stayed the same? Graph y3 = -2x What changed? What stayed the same? Graph y4 = -0.5x What changed? What stayed the same? Now, make you own line design!

Similar presentations

 2. – –7 – – (–1)>")


2. –3 + 5 3. –7 – 74. 2 – (–1) –2 –14 2 3 5. Find the x- and y-intercepts of 2x – 5y = 20. x-int.: 10; y-int.: –4.>")


