Download presentation
Presentation is loading. Please wait.

1
REDUX: Remakes, Revivals and Recreations 12 th Annual CASE Conference

3
Superman Returns! Central Texas Real Estate Trends PATRICK JOHNSON FIRST STATE BANK CENTRAL TEXAS

4
Data Provided by and Special Thanks To: Disclaimer: Opinions expressed are those of the speaker and not FSB or the above data providers.

5
Central Texas is Hot Hot Hot! Driven by: Record job creation Population growth Low interest rates But… Has drinking the Kool-Aid returned?

6
FOLLOW THE MONEY: BANK UNDERWRITING TRENDS

7
Commercial Bank Real Estate Loans 60+ Austin Area bank lenders active in Commercial Real Estate Lots of out of state money Hyper-competitive on terms Starting to see Higher (85% and up) LTV’s Non-recourse speculative loans Multiple Exceptions to standard bank policy Rates generally in the 3’s, 4’s and 5’s (LOW) Yes, We are Drinking the Kool-Aid!! But…

8
Market is at equilibrium and not overbuilt – 10% vacancy rate All Areas of MSA are healthy Rents are rising steadily, 10% a year New product is leasing out successfully Company relocations are a big driver of office absorption Creative Space at a premium - #1 Start-up City in the USA Commercial Office Trends

9
Retail Leasing Trends Less than 5% vacancy rates Re-purposing of legacy property Market constrained by lack of new supply Rents steady to rising Future of Retail?

10
Multi-Family Trends Too much Class A coming on market at the same time ? 13,000 units in 2015 Rent concessions becoming a bit more Common Very easy credit terms. Rates in the 3% to 4% range– HUD money driving supply Market needs to slow here to remain in balance

11
Hotel Trends My Opinion: Too many hotels are being built at the same time Downtown – 4000+ confirmed new rooms 2014-2016 – 50% increase

12
Residential Bank Real Estate Loans Fannie/Freddie Traditional Mortgage Loans are getting easier to obtain 30 year 4%, 15 year 3% - near historical lows Still excessive underwriting requirements Lenders face more regulation – mostly driven by Dodd Frank and the creation of the Consumer Financial Protection Bureau Smaller banks are making less homestead loans due to regulatory risk and high cost to comply Getting a home loan is a pain!! Thank you Barney Frank!

13
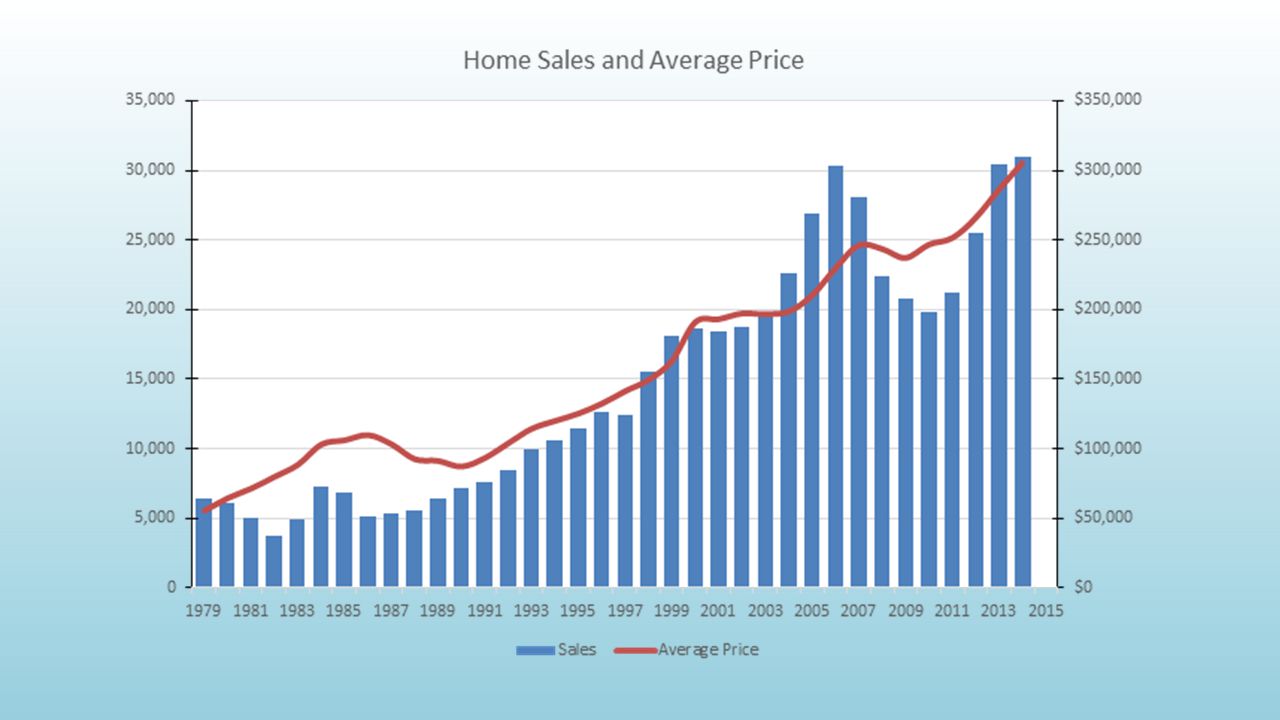
Central Texas Residential Affordability Low Single Family Home Supply driving average prices up by 25% since Jan 2014 Low mortgage rates and rising wages have somewhat helped offset affordability Location premium rising – driven by traffic and where jobs are located

14
New Single Housing Starts Permits rising Not near the last peak (2006) Market is still considered a sellers market Lot supply is still low from the last downturn New home product is primarily being built in suburbs, Lakeway, Hays and Williamson Builders and lenders are active More supply needed to balance the market Source: Texas A&M Real Estate Center 200013,04511.5127,5006.7 20019,115-30.1126,300-0.9 200211,07221.5132,4004.8 200312,1169.4118,400-10.6 200414,30918.1127,6007.8 200517,34621.2142,70011.8 200617,6151.6144,9001.5 200712,120-31.2170,60017.7 20087,710-36.4174,0002.0 20096,678-13.4161,400-7.2 20106,200-7.2172,5006.9 20116,2310.5179,3003.9 20128,26132.6179,8000.3 20138,9548.4206,90015.1 201411,84232.3223,000 Date Number of Dwelling Units Average Value per Unit Units Percent Change Value ($) Percent Change
 Market is still considered a sellers market Lot supply is still low from the last downturn New home product is primarily being built in suburbs, Lakeway, Hays and Williamson Builders and lenders are active More supply needed to balance the market Source: Texas A&M Real Estate Center , , , , , , , , , , , , , , , , , , , , , , , , , , , , , ,000 Date Number of Dwelling Units Average Value per Unit Units Percent Change Value ($) Percent Change")
16
Recent 2014 -2015 Single Family Sales DateSales Dollar Volume Average Price Median Price Total Listings Months Inventory 2014-Jan1,582426,127,544269,400213,7005,1182.0 Feb1,903550,882,376289,500229,4005,2552.1 Mar2,434717,821,612294,900235,6005,5122.2 Apr2,691813,253,968302,200237,0005,8382.3 May3,1781,012,123,948318,500243,9006,5392.6 Jun3,1951,023,051,880320,200248,9007,0402.7 Jul3,151982,086,356311,700246,9007,4752.9 Aug3,023927,350,961306,800243,9007,3262.9 Sep2,664813,797,562305,500238,9007,0722.8 Oct2,586796,118,534307,900239,6006,7912.7 Nov2,050623,771,584304,300242,0006,1262.4 Dec2,480764,784,205308,400245,5005,6022.2 2015-Jan1,652511,059,108309,400237,7005,5672.2 Feb1,965592,117,270301,300245,3005,7332.2 Mar2,642875,627,716331,400253,3005,9062.3 Apr2852955,807,604335,100271,6006,5602.5

17
Date EmploymentUnemployment Total % Change Year Ago Rate Unit Change Year Ago 2001718,8320.34.31.3 2002713,585-0.75.91.6 2003718,7250.76.00.1 2004737,7922.75.0-0.9 2005761,9923.34.5-0.5 2006789,4033.64.1-0.4 2007813,2563.03.6-0.5 2008827,5381.84.30.7 2009825,071-0.36.92.6 2010865,4614.97.00.1 2011896,8633.66.6-0.4 2012932,2813.95.7-0.9 2013970,7274.15.1-0.5 20141,007,3523.84.2

18
20011,321,3165.771,55327,3178,12911,52544,712 20021,347,8222.026,50622,5186,5678,5984,788 20031,376,0302.128,20822,5606,6097,4676,899 20041,410,0582.534,02823,2846,9806,91514,533 20051,453,3583.143,30023,6866,7337,19922,535 20061,515,4854.362,12724,4817,2817,24341,069 20071,577,8564.162,37125,6807,3456,57740,211 20081,633,8703.656,01426,6287,6276,39133,838 20091,682,3383.048,46826,7508,0796,40625,654 20101,716,2892.033,9516,3061,9501,1675,608 20111,782,0893.865,80025,2398,2915,97229,719 20121,836,1493.054,06024,8438,4125,76331,142 20131,885,8032.749,65425,4219,0136,38626,768 20141,943,2993.057,49625,7829,2076,47433,059 DatePopulation% Change Total Population Change BirthsDeaths International Immigration Net Domestic Migration Central Texas 47% Population Growth Since 2000

19
Conclusions Austin employment and population growth drives real estate growth. Home construction has not yet reached prior peaks, and has not kept up with demand Residential values are continuing to increase as a result. 2 months of Inventory Ultimately, affordability becomes a factor. Sellers market. Commercial banks are aggressively underwriting local commercial real estate Multi-family and Hotels show signs of oversupply. Much of the Kool-Aid drinking is likely occurring here. Office, Industrial, and Retail are less likely to be overbuilt. Most of the new office already built is leased. There is not much new industrial or retail product on the immediate horizon. Rents should be stable to increasing in Office, Industrial, and Retail in the near term.

20
Thank you! Join me at our next FSB South Austin Shrimp Boil, Open House and Shrimp Sale! Hand me your business card and/or email and we’ll add you to the invite! Patrick Johnson President First State Bank Central Texas 512-899-2212 or 512-784-4819 patrickj@fsbcentex.com Calvin from Alvin – best shrimp around!

Similar presentations