Download presentation
Presentation is loading. Please wait.

1
StatKey: Online Tools for Bootstrap Intervals and Randomization Tests Kari Lock Morgan Department of Statistical Science Duke University Joint work with Robin Lock, Patti Frazer Lock, Eric Lock, Dennis Lock ICOTS 7/17/14

2
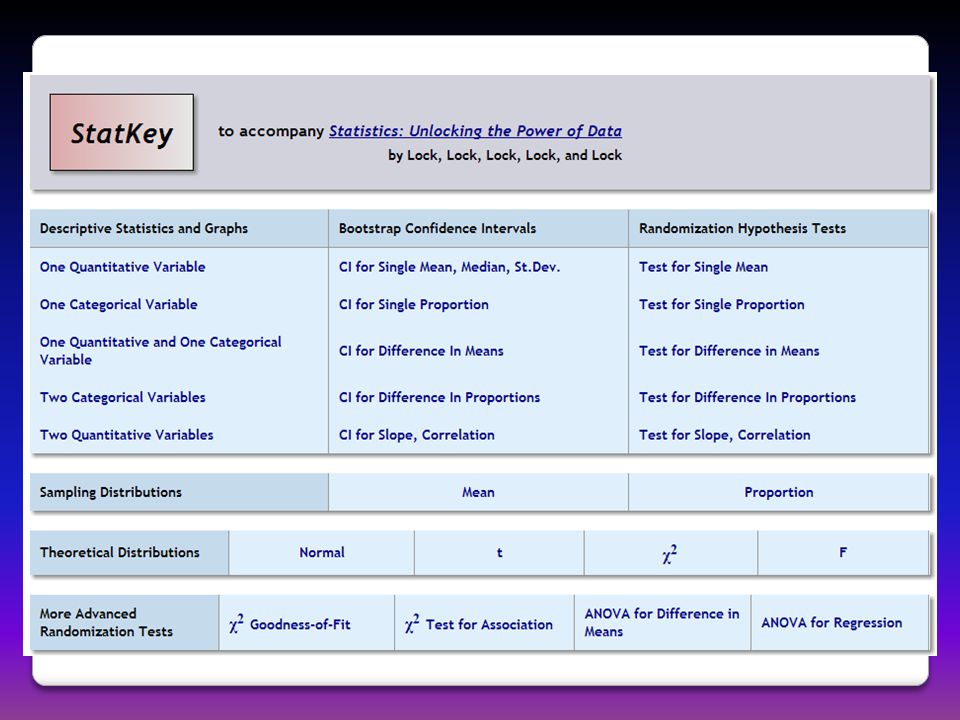
StatKey A set of web-based, interactive, dynamic statistics tools designed for teaching simulation-based methods at an introductory level. Freely available at www.lock5stat.com/statkey www.lock5stat.com/statkey No login required Runs in (almost) any browser (incl. smartphones) Google Chrome App available (no internet needed) Standalone or supplement to existing technology
 any browser (incl. smartphones) Google Chrome App available (no internet needed) Standalone or supplement to existing technology.")
3
StatKey Developed by the Lock 5 team Developed for our book, Statistics: Unlocking the Power of Data (although can be used with any book) Programmed by Rich Sharp (Stanford), Ed Harcourt and Kevin Angstadt (St. Lawrence) Wiley (2013) Robin & Patti St. Lawrence Dennis Miami Dolphins Kari Duke / Penn State Eric U Minnesota
 Wiley (2013) Robin & Patti St. Lawrence Dennis Miami Dolphins Kari Duke / Penn State Eric U Minnesota.")
4
StatKey Goals Free Convenient Very easy-to-use Helps promote understanding For those who want to use simulation methods, technology should not be a limiting factor!

5
StatKey WHY? Address instructor concerns about accessibility of simulation-based methods at the intro level Design an easy-to-use set of learning tools accessible to everyone Provide a no-cost technology option for any environment OR as a supplement to existing technology Make sure everyone

8
Bootstrap Confidence Interval Lange, T., Royals, H. and Connor, L. (2004). Mercury accumulation in largemouth bass (Micropterus salmoides) in a Florida Lake. Archives of Environmental Contamination and Toxicology, 27(4), 466-471.
. Mercury accumulation in largemouth bass (Micropterus salmoides) in a Florida Lake. Archives of Environmental Contamination and Toxicology, 27(4),")
9
Original Sample One Simulated Sample Distribution of Simulated Statistics Bootstrap Confidence Interval

10
SE = 0.047 Distribution of Bootstrap Statistics 0.527 2 0.047 (0.433, 0.621) Middle 95% of bootstrap statistics
 Middle 95% of bootstrap statistics")
11
CI for Proportion Have you used simulation-based methods (bootstrap confidence intervals or randomization tests) in your teaching?
 in your teaching")
13
Randomization Test Crum, A. and Langer, E., (2007). Mind-Set Matters: Exercise and the Placebo Effect. Psychological Science, 18, 165-171.

14
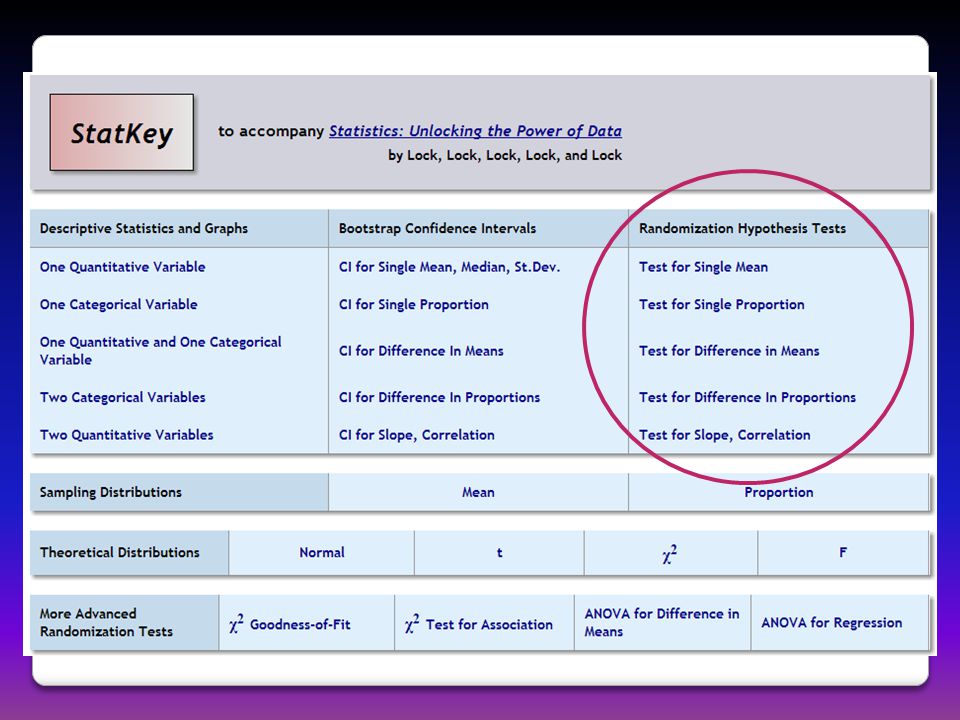
Randomization Test p-value Proportion as extreme as observed statistic observed statistic Distribution of Statistic Assuming Null is True

15
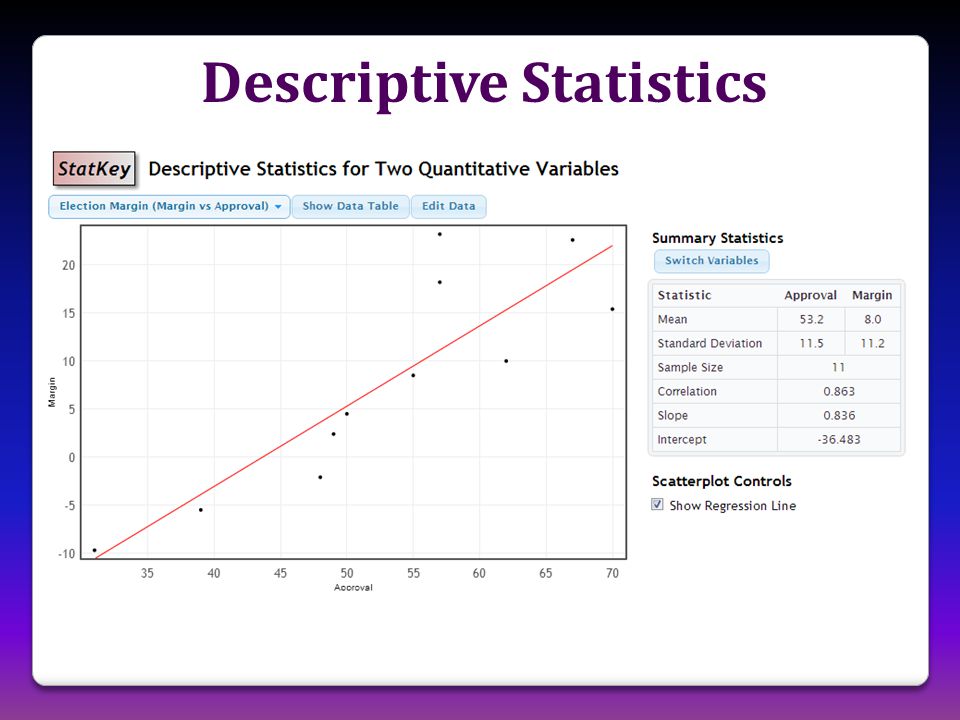
r = 0.43 NFL Teams Malevolent Uniforms Do NFL teams with more malevolent uniforms get more penalty yards?

16
Ability to simulate one to many samples Helps students distinguish and keep straight the original data, a single simulated data set, and the distribution of simulated statistics Students have to interact with the bootstrap/randomization distribution – they have to know what to do with it Consistent interface for bootstrap intervals, randomization tests, theoretical distributions StatKey Pedagogical Features

18
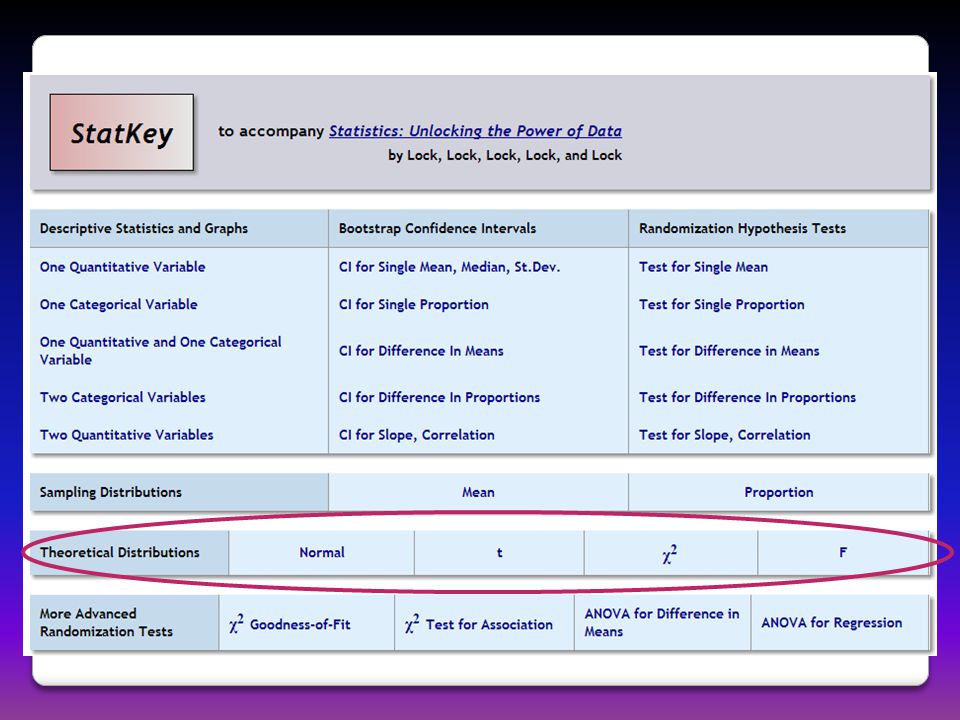
Maid weight loss example: t-distribution df = 33 Theoretical Distributions

19
p-value t-statistic MUCH more intuitive and easier to use than tables!!!

21
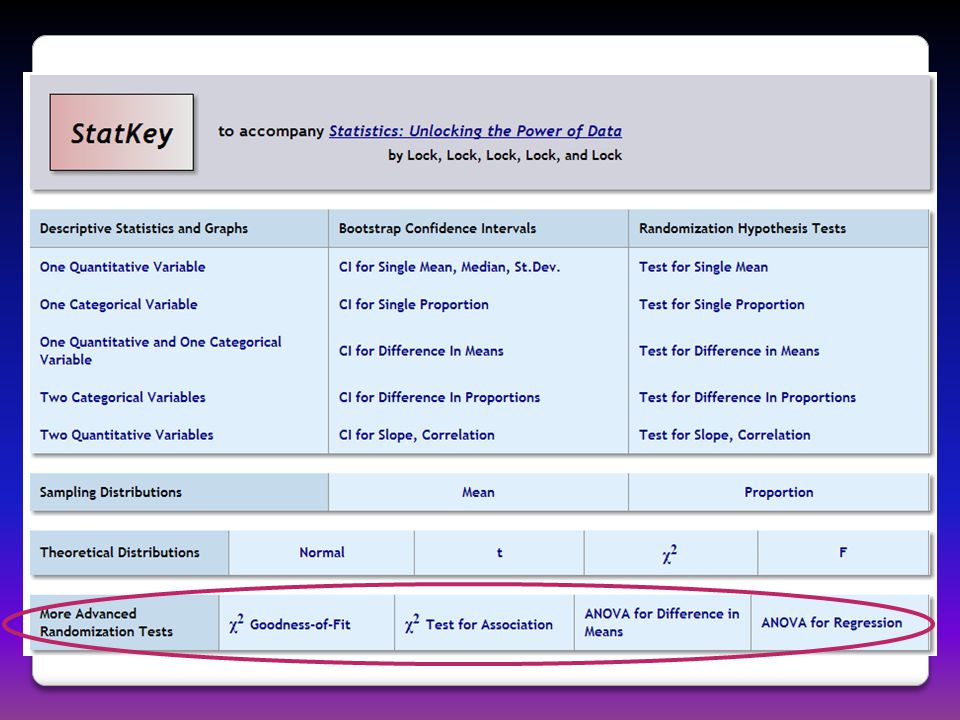
Chi-square tests Goodness-of-fit or test for association Gives 2 statistic, as well as observed and expected counts for each cell Randomization test or 2 distribution ANOVA Difference in means or regression Gives entire ANOVA table Randomization test or F-distribution Chi-Square and ANOVA

22
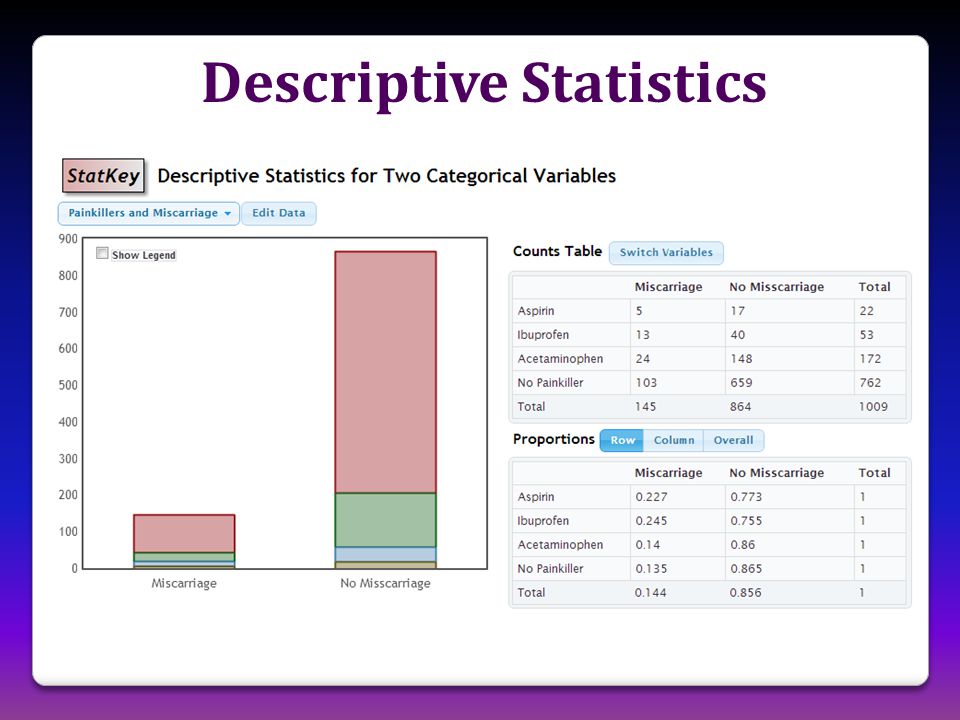
Is there an association between type of painkiller taken during pregnancy and miscarriage? Chi-Square Test for Association

23
Chi-Square Test Randomization Distribution Chi-Square Distribution (3 df) p-value = 0.105 2 = 6.168 p-value = 0.104 2 = 6.168
 p-value = 2 = p-value = 2 = 6.168")
24
Does exposure to light at night make you fatter? (does it make mice fatter?) ANOVA for Difference in Means
 ANOVA for Difference in Means.")
26
Simulate a sampling distribution Generate confidence intervals for each simulated statistic, keep track of coverage rate Population data: Finishing times for the 2008 Men’s Olympic marathon Sampling Distributions

29
Descriptive Statistics

33
Help Help page, including instructional videos

34
Suggestions? Comments? Questions? You can email me at klm47@psu.edu or the whole Lock 5 team at lock5stat@gmail.comklm47@psu.edulock5stat@gmail.com

Similar presentations


>")


