Download presentation
Presentation is loading. Please wait.

1
Blood Pressure Variability: The Good And The Bad
Sola Aoun Bahous LAU Medical Center – Rizk Hospital Master Course in Hypertension March 2015

2
Blood Pressure Variability: Mechanisms and Clinical Relevance
BPV: a physiological characteristic of the cardiovascular system Assessment of BPV Prognostic importance of BPV BPV reduction: CV risk lowering independent of BP reduction?

3
Blood Pressure Variability: Mechanisms and Clinical Relevance
BPV is a physiological characteristic of the cardiovascular system Assessment of BPV Prognostic importance of BPV BPV reduction: CV risk lowering independent of BP reduction?

4
Blood Pressure Variability: Mechanisms and Clinical Relevance
Weber M, J Hypertens 2006

5
Fig Incidence of major cardiovascular events in trials on low-risk hypertensive patients. For each trial the brown portion of the column indicates the incidence in the trial arm with lower event incidence, the yellow portion incidence in the trial arm with higher event incidence. The dashed horizontal line indicates the conventional threshold of high risk. Trial abbreviations are shown at the bottom of the columns. AUS Australian trial on mild hypertension [19], MRCM MRC trial on mild hypertension [20], ELSA European Lacidipine Study on Atherosclerosis [21], HOT Hypertension Optimal Treatment trial [22], OSLO Oslo study [23], CAP Captopril Prevention Project [24], IPP International Prospective Primary Prevention Study in Hypertension [25], HAP Heart Attack Primary Prevention in Hypertension trial [26], CONV Controlled Onset Verapamil Investigation of Cardiovascular End points trial [27], NORD, Nordic Diltiazem Study [28], INS International Nifedipine GITS Study: Intervention as a Goal in Hypertension Treatment [29], ASCOT Anglo-Scandinavian Cardiac Outcomes Trial [30], FEV Felodipine Event Reduction study [14]. The bottom rows indicate the baseline characteristics of the patients: age (in years), prevalence (%) of diabetes mellitus (DM), previous myocardial infarction (MI), cerebrovascular disease (stroke), any type of cardiovascular disease (any CVD), left ventricular hypertrophy (LVH), and concurrent therapies continued from baseline throughout the trial: lipid lowering agents (LLA), antiplatelet agents (APT), antihypertensive agents (AHA). Dashes indicate that information was unreported. The last row reports the systolic blood pressure (SBP) achieved in each trial (arm with the lower outcome incidence) (From [18] by courtesy of the Journal of Hypertension) A. Zanchetti, Residual Risk in Treated Hypertension In Special Issues in Hypertension, 2012, A. Berbari and G. Mancia
![Fig Incidence of major cardiovascular events in trials on low-risk hypertensive patients. For each trial the brown portion of the column indicates the incidence in the trial arm with lower event incidence, the yellow portion incidence in the trial arm with higher event incidence. The dashed horizontal line indicates the conventional threshold of high risk. Trial abbreviations are shown at the bottom of the columns. AUS Australian trial on mild hypertension [19], MRCM MRC trial on mild hypertension [20], ELSA European Lacidipine Study on Atherosclerosis [21], HOT Hypertension Optimal Treatment trial [22], OSLO Oslo study [23], CAP Captopril Prevention Project [24], IPP International Prospective Primary Prevention Study in Hypertension [25], HAP Heart Attack Primary Prevention in Hypertension trial [26], CONV Controlled Onset Verapamil Investigation of Cardiovascular End points trial [27], NORD, Nordic Diltiazem Study [28], INS International Nifedipine GITS Study: Intervention as a Goal in Hypertension Treatment [29], ASCOT Anglo-Scandinavian Cardiac Outcomes Trial [30], FEV Felodipine Event Reduction study [14]. The bottom rows indicate the baseline characteristics of the patients: age (in years), prevalence (%) of diabetes mellitus (DM), previous myocardial infarction (MI), cerebrovascular disease (stroke), any type of cardiovascular disease (any CVD), left ventricular hypertrophy (LVH), and concurrent therapies continued from baseline throughout the trial: lipid lowering agents (LLA), antiplatelet agents (APT), antihypertensive agents (AHA). Dashes](http://slideplayer.com/slide/5285892/17/images/5/Fig+Incidence+of+major+cardiovascular+events+in+trials+on+low-risk+hypertensive+patients.+For+each+trial+the+brown+portion+of+the+column+indicates+the+incidence+in+the+trial+arm+with+lower+event+incidence%2C+the+yellow+portion+incidence+in+the+trial+arm+with+higher+event+incidence.+The+dashed+horizontal+line+indicates+the+conventional+threshold+of+high+risk.+Trial+abbreviations+are+shown+at+the+bottom+of+the+columns.+AUS+Australian+trial+on+mild+hypertension+%5B19%5D%2C+MRCM+MRC+trial+on+mild+hypertension+%5B20%5D%2C+ELSA+European+Lacidipine+Study+on+Atherosclerosis+%5B21%5D%2C+HOT+Hypertension+Optimal+Treatment+trial+%5B22%5D%2C+OSLO+Oslo+study+%5B23%5D%2C+CAP+Captopril+Prevention+Project+%5B24%5D%2C+IPP+International+Prospective+Primary+Prevention+Study+in+Hypertension+%5B25%5D%2C+HAP+Heart+Attack+Primary+Prevention+in+Hypertension+trial+%5B26%5D%2C+CONV+Controlled+Onset+Verapamil+Investigation+of+Cardiovascular+End+points+trial+%5B27%5D%2C+NORD%2C+Nordic+Diltiazem+Study+%5B28%5D%2C+INS+International+Nifedipine+GITS+Study%3A+Intervention+as+a+Goal+in+Hypertension+Treatment+%5B29%5D%2C+ASCOT+Anglo-Scandinavian+Cardiac+Outcomes+Trial+%5B30%5D%2C+FEV+Felodipine+Event+Reduction+study+%5B14%5D.+The+bottom+rows+indicate+the+baseline+characteristics+of+the+patients%3A+age+%28in+years%29%2C+prevalence+%28%25%29+of+diabetes+mellitus+%28DM%29%2C+previous+myocardial+infarction+%28MI%29%2C+cerebrovascular+disease+%28stroke%29%2C+any+type+of+cardiovascular+disease+%28any+CVD%29%2C+left+ventricular+hypertrophy+%28LVH%29%2C+and+concurrent+therapies+continued+from+baseline+throughout+the+trial%3A+lipid+lowering+agents+%28LLA%29%2C+.jpg "indicate that information was unreported. The last row reports the systolic blood pressure (SBP) achieved in each trial (arm with the lower outcome incidence) (From [18] by courtesy of the Journal of Hypertension) A. Zanchetti, Residual Risk in Treated Hypertension In Special Issues in Hypertension, 2012, A. Berbari and G. Mancia.")
6
In conclusion, the systematic review of the trials summarized here [18] clearly indicates that a high incidence of cardiovascular events persists despite intense lowering of BP and concurrent therapeutic correction of other risk factors, such as serum cholesterol and platelet aggregation, when therapeutic intervention is made once organ damage is advanced and, especially, when overt disease is present. This does not deny the known benefit of interventions even in secondary prevention, as shown by many trials and their meta-analyses [3–5], but it points out that pre-existing high risk sets a ceiling effect to the benefits of treatment because of a residual risk that is not amenable or scarcely amenable to be reduced by treatment. Fig Incidence of major cardiovascular events in trials on high cardiovascular risk patients. Trial abbreviations are indicated at the bottom of the columns, as follows: ACC Avoiding Cardiovascular Events through Combination Therapy in Patients Living with Systolic Hypertension trial [31], CAM Comparison of Amlodipine versus Enalapril to Limit Occurrence of Thrombosis [32], PEA Prevention of Events with Angiotensin Converting Enzyme Inhibition [33], EU European trial on Reduction of Cardiac Events with Perindopril in Patients with Stable Coronary Artery Disease [34], INV International Verapamil SR–Trandolapril study [12], JM Japan Multicenter Investigation for Cardiovascular Diseases-B [35], ALL Antihypertensive and Lpid-Lowering Treatment to Prevent Heart Attack [36], LIFE Losartan Intervention For Endpoint Reduction in Hypertension study [37], ACT A Coronary Disease Trial Investigating Outcome with Nifedipine GITS [38], ONT Ongoing Telmisartan Alone or in Combination with Ramipril Global Endpoint Trial [39], TR Telmisartan Randomized Assessment Study in ACE Intolerant Subjects with Cardiovascular Disease [40], HOP Heart Outcomes Prevention Evaluation [41], VAL Valsartan Antihypertensive Long-Term Use Evaluation [42], PROG Perindopril Protection Against Recurrent Stroke Study [43], TIA Dutch Transient Ischemic Attack Study [44], PROF Prevention Regimen For Effectively Avoiding Second Stroke [45], PATS Post-stroke Antihypertensive Treatment Study [46], MOS Morbidity and Mortality after Stroke Eprosartan Compared with Nitrendipine for Secondary Prevention of Stroke [47] (from [18] by courtesy of the Journal of Hypertension). APT antiplatelet agent, CVD cardiovascular disease, AHA antihypertensive agent, DM diabetes mellitus, LVH left ventricular hypertrophy, LLA lipid lowering agent, MI myocardial infarction, SBP systolic blood pressure. A. Zanchetti, Residual Risk in Treated Hypertension In Special Issues in Hypertension, 2012, A. Berbari and G. Mancia
![In conclusion, the systematic review of the trials summarized here [18] clearly indicates that a high incidence of cardiovascular events persists despite intense lowering of BP and concurrent therapeutic correction of other risk factors, such as serum cholesterol and platelet aggregation, when therapeutic intervention is made once organ damage is advanced and, especially, when overt disease is present. This does not deny the known benefit of interventions even in secondary prevention, as shown by many trials and their meta-analyses [3–5], but it points out that pre-existing high risk sets a ceiling effect to the benefits of treatment because of a residual risk that is not amenable or scarcely amenable to be reduced by treatment.](http://slideplayer.com/slide/5285892/17/images/6/In+conclusion%2C+the+systematic+review+of+the+trials+summarized+here+%5B18%5D+clearly+indicates+that+a+high+incidence+of+cardiovascular+events+persists+despite+intense+lowering+of+BP+and+concurrent+therapeutic+correction+of+other+risk+factors%2C+such+as+serum+cholesterol+and+platelet+aggregation%2C+when+therapeutic+intervention+is+made+once+organ+damage+is+advanced+and%2C+especially%2C+when+overt+disease+is+present.+This+does+not+deny+the+known+benefit+of+interventions+even+in+secondary+prevention%2C+as+shown+by+many+trials+and+their+meta-analyses+%5B3%E2%80%935%5D%2C+but+it+points+out+that+pre-existing+high+risk+sets+a+ceiling+effect+to+the+benefits+of+treatment+because+of+a+residual+risk+that+is+not+amenable+or+scarcely+amenable+to+be+reduced+by+treatment..jpg "Fig Incidence of major cardiovascular events in trials on high cardiovascular risk patients. Trial abbreviations are indicated at the bottom of the columns, as follows: ACC Avoiding Cardiovascular Events through Combination Therapy in Patients Living with Systolic Hypertension trial [31], CAM Comparison of Amlodipine versus Enalapril to Limit Occurrence of. Thrombosis [32], PEA Prevention of Events with Angiotensin Converting Enzyme Inhibition [33], EU European trial on Reduction of Cardiac Events with Perindopril in Patients with Stable Coronary Artery Disease [34], INV International Verapamil SR–Trandolapril study [12], JM Japan Multicenter Investigation for Cardiovascular Diseases-B [35], ALL Antihypertensive and Lpid-Lowering Treatment to Prevent Heart Attack [36], LIFE Losartan Intervention For Endpoint Reduction in Hypertension study [37], ACT A Coronary Disease Trial Investigating Outcome with Nifedipine GITS [38], ONT Ongoing Telmisartan Alone or in Combination with Ramipril Global Endpoint Trial [39], TR Telmisartan Randomized Assessment Study in ACE Intolerant Subjects with Cardiovascular Disease [40], HOP Heart Outcomes Prevention Evaluation [41], VAL Valsartan Antihypertensive Long-Term Use Evaluation [42], PROG Perindopril Protection Against Recurrent Stroke Study [43], TIA Dutch Transient Ischemic Attack Study [44], PROF Prevention Regimen For Effectively Avoiding Second Stroke [45], PATS Post-stroke Antihypertensive Treatment Study [46], MOS Morbidity and Mortality after Stroke Eprosartan Compared with Nitrendipine for Secondary Prevention of Stroke [47] (from [18] by courtesy of the Journal of Hypertension). APT antiplatelet agent, CVD cardiovascular disease, AHA antihypertensive agent, DM diabetes mellitus, LVH left ventricular hypertrophy, LLA lipid lowering agent, MI myocardial infarction, SBP systolic blood pressure. A. Zanchetti, Residual Risk in Treated Hypertension In Special Issues in Hypertension, 2012, A. Berbari and G. Mancia.")
7
This residual risk can be amenable to treatment benefit when blood pressure analysis is representative of central hemodynamic changes over time. many individuals are treated to benefit only a few when decisions are based on limited parameters at peripheral arterial sites, while others, with the same brachial systolic and diastolic blood pressure levels, might acquire significant cardiovascular benefit. A. Zanchetti, Residual Risk in Treated Hypertension In Special Issues in Hypertension, 2012, A. Berbari and G. Mancia

8
Blood Pressure Parameters
What BP parameter to use? What anatomical site? What time to consider?

9
BP Variability Site variability Time variability

10
BP is a highly variable parameter
Intra-arterial BP recording in a subject lying supine, at rest

11
Time Variability of Arterial BP
19 22 1 4 7 10 13 16 100 200 mm Hg Mancia G, Parati G, J Hypertens 1990;8(suppl. 7):S1-S13
:S1-S13.")
12
Within-individual BPV over time varies from one patient to another
SBP DBP 40 60 80 100 120 140 160 180 200 220 Blood pressure (mmHg) 1 2 3 Weeks 40 60 80 100 120 140 160 180 200 220 Blood pressure (mmHg) 1 2 3 There can be considerable differences between individuals in the extent of BPV between readings over time. Weeks Patient 1 with lower BPV Patient 2 with higher BPV Rothwell PM. Lancet. 2010;375: BPV, BP variability.
 Weeks Blood pressure (mmHg) There can be considerable differences between individuals in the extent of BPV between readings over time. Weeks. Patient 1 with lower BPV. Patient 2 with higher BPV. Rothwell PM. Lancet. 2010;375: BPV, BP variability.")
13
BP Variability “Rather than representing a “background noise” or a phenomenon occurring at random, these variations are known to be the result of complex interactions between extrinsic environmental and behavioral factors and intrinsic cardiovascular regulatory mechanisms (neural central, neural reflex, and humoral influences) that are not yet completely understood”. (Parati G. et al, Nat. Rev. Cardiol. 2013; 10:143)
 that are not yet completely understood . (Parati G. et al, Nat. Rev. Cardiol. 2013; 10:143)")
14
BP Variability Subtypes
Short-term BPV (within 24hrs): Very short: beat-to-beat Short: within a 24-h period (minute-to-minute, hour-to-hour, and day-to-night) Long-term BPV: Day-to-day Visit-to-visit Seasonal
: Very short: beat-to-beat. Short: within a 24-h period (minute-to-minute, hour-to-hour, and day-to-night) Long-term BPV: Day-to-day. Visit-to-visit. Seasonal.")
15
BP Variability: Mechanism
Short-time Variability: Beat-to-beat Baroreceptors Respiration Sleep Chemoreceptors Mechanisms: central and reflex autonomic modulation, reduced arterial compliance, humoral effects, rheological factors, emotional factors, behavioral influences/physical activity, sleep, postural changes.

16
BP Contour

17
BP Variability: Mechanism
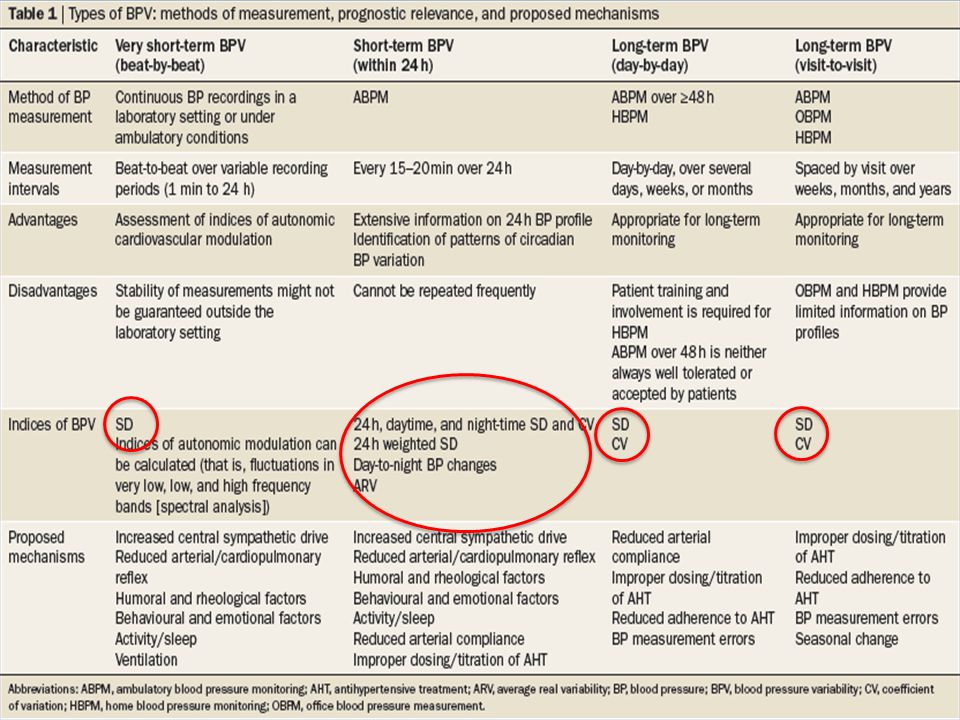
Long-time Variability: Day-to-day (behavioral changes) Visit-to-visit Seasonal: SBP and DBP have been reported to be lower during summer and higher during winter. Inappropriate down dosing of drugs leads to increase in night-time BP with hot weather reported in some studies. Behavioural changes are considered to have a major role in day-to-day BPV, as indicated by the substantial changes observed in 24 h ambulatory BP monitoring (ABPM) values between working days and the weekend.28 Long-term BPV has been shown to be a reproducible and not a random phenomenon. However, little is known about the factors responsible for BPV observed over months or years in observational studies and clinical trials of antihypertensive drugs. Some potential mechanisms for long-term BPV, particularly increased arterial stiffness, have been postulated in studies published in the past 2 years. Long-term BPV might not entirely consist of spontaneous BP variations, nor reflect the same physiological cardiovascular control mechanisms as short-term BP fluctuations; it might also be the result of poor BP control in treated patients (in particular visit-to-visit BP variations during follow-up) or reflect inconsistent office BP (OBP) readings (Table 1). Mechanisms: less well studied. Behavioral factors, increased arterial stiffness, poor BP control, or inconsistent office readings.
 Visit-to-visit. Seasonal: SBP and DBP have been reported to be lower during summer and higher during winter. Inappropriate down dosing of drugs leads to increase in night-time BP with hot weather reported in some studies. Behavioural changes are considered to have a major role in day-to-day BPV, as indicated by the substantial changes observed in 24 h ambulatory BP monitoring (ABPM) values between working days and the weekend.28 Long-term BPV has been shown to be a reproducible and not a random phenomenon. However, little is known about the factors responsible for BPV observed over months or years in observational studies and clinical trials of antihypertensive drugs. Some potential mechanisms for long-term BPV, particularly increased arterial stiffness, have been postulated in studies published in the past 2 years. Long-term BPV might not entirely consist of spontaneous BP variations, nor reflect the same physiological cardiovascular control mechanisms as short-term BP fluctuations; it might also be the result of poor BP control in treated patients (in particular visit-to-visit BP variations during follow-up) or reflect inconsistent office BP (OBP) readings (Table 1). Mechanisms: less well studied. Behavioral factors, increased arterial stiffness, poor BP control, or inconsistent office readings.")
18
Blood Pressure Variability
BPV is a known and natural characteristic of blood pressure BPV is secondary to mechanisms of varied nature Divided into short-term and long-term

19
Different Prognostic Impact of Nocturnal BP Fall and Short Term BPV
24h Intra-Arterial BP 19 22 1 4 7 10 13 Hours 100 200 mmHg Protective Damaging Mancia G, Parati G 1983

20
Blood Pressure Variability: Mechanisms and Clinical Relevance
BPV is a physiological characteristic of the cardiovascular system Assessment of BPV Prognostic importance of BPV BPV reduction: CV risk lowering independent of BP reduction?

21
Assessment of BPV Indices: SD, CV, day-to-night BP changes, ARV, residual BPV, trough-to-peak, night-to-day Setting: Continuous beat-to-beat BP recordings: SD Repeated OBPM: SD, CV, ARV 24h ABPM: SD, CV, residual BPV, ARV, day-to-night, trough-to-peak, night-to-day HBPM: SD and CV Visit-to-visit: SD and CV Smoothness Index: used to assess the amplitude and distribution over time of BP reduction by treatment. 24-hourly BP changes/SD CV: Coefficient of variation = standard deviation normalized for MBP ARV: average real variability Measures of BPV can be obtained by various methods, for example continuous beat-to-beat BP recordings, repeated OBPM, 24 h ABPM, or HBPM over long periods of time. BP fluctuations can be assessed in the very short or short-term, and in the mid-to-long term (day-to-day, visit-to-visit, or between seasons). These components of BPV can be characterized by various mechanisms and might differently affect prognosis (Figure 1).
. These components of BPV can be characterized by various mechanisms and might differently affect prognosis (Figure 1).")
23
Assessment of BPV CV: (SD/BP)100
Residual BPV: fast fluctuations that remain after exclusion of the slower components of the 24h profile through spectral analysis ARV: (BP2-BP1) + (BP3-BP2) + (BP4-BP3) + etc. /N Day-to-night: Dipping status Night-to-day: Morning surge
 + (BP3-BP2) + (BP4-BP3) + etc. /N. Day-to-night: Dipping status. Night-to-day: Morning surge.")
25
Circadian Variability of BP
Beat-to-beat variability Day-to-night variability Dippers Non-dippers Reverse dippers/risers Excessive dippers Night-to-day variability: morning surge

26
Nocturnal Dipping Status
The correct time period of sleep and awakening should be considered Poor reproducibility of the classification of hypertensives into dippers and nondippers based on 1 ABPM

27
Nocturnal Dipping Status
Mechanisms underlying nondipping status: Persistence of sympathetic drive at night Reduced sensibility of baroreceptors at night Volume overload in specific conditions Autonomic dysfunction

28
Nocturnal Dipping Status
Nondipping status is associated with CV risk Nocturnal BP independently predicts outcome Extreme dipping is associated with higher risk for cerebral and retinal ischemia Chronotherapy?

29
Morning Surge No consensus on the definition and threshold value of pathological MBPS Usually assessed using the ABPM Exaggerated surge is associated with TOD and leads to increased risk of CV events or death Weekly and seasonal variations in MBPS: augmented on Mondays and in winter MBPS increases with age, HTN, glucose intolerance, inflammation, alcohol, smoking , stress, etc…

30
Fig. 7.6 Reproducibility of morning blood pressure surge and cardiovascular risk. Patient A exhibits an appropriate morning surge; patient B exhibits a reproducible exaggerated surge; patient C exhibits an exaggerated variability of morning surge (irreproducible). BP blood pressure, SD standard deviation.
. BP blood pressure, SD standard deviation..")
31
Kazuomi Kario, In Special Issues in Hypertension, 2012, A
Kazuomi Kario, In Special Issues in Hypertension, 2012, A. Berbari and G. Mancia

32
Blood Pressure Variability: Mechanisms and Clinical Relevance
BPV is a physiological characteristic of the cardiovascular system Assessment of BPV Prognostic importance of BPV Reduction of BPV on top of BP reduction may represent a new target for treatment to further reduce cardiovascular risk (?)
")
33
Prognostic Importance of BPV
Clinical Relevance of Short-Term BPV

34
Clinical Relevance of 24h BP Variability
Study Parati, 1987 Palatini, 1992 Mancia, Parati, 2001 Liu, 2003 Frattola, Parati, 1993 Sander, 2000 Dawson, 2000 Kikuya, 2000 Pringle, Parati, 2003 Mena, 2005 Mancia, 2007 Tatasciore, Parati, 2007 Parati, 2009 Hansen, 2010 Design Cross-sectional Longitudinal (rats) Longitudinal Endpoint TOD score Carotid IMT Cardiac /renal damage LV mass (echo) Carotid IMT / CV events Dead / dependency (after acute stroke) CV mortality Stroke CV events Carotid IMT, LVMI Only DBP for CV events / stroke 34 34
 Longitudinal. Endpoint. TOD score. Carotid IMT. Cardiac /renal damage. LV mass (echo) Carotid IMT / CV events. Dead / dependency (after acute stroke) CV mortality. Stroke. CV events. Carotid IMT, LVMI. Only DBP for CV events / stroke")
35
Fig. 8.1 The upper panels show the quintile values of the 24-h average mean arterial pressure (MAP), 24-h MAP variability, and the score of target organ damage (TOD). The lower panels show the quintile values of 24-h average systolic blood pressure (SBP), SBP variability, and carotid artery intima-media thickness (IMT). For each quintile, data are shown for subgroups with a BP variability above and below the median value. P refers to the quintile trend. Variability is shown as the standard deviation (SD) of the 24-h SBP mean. The data shown in the upper panels were obtained by intra-arterial BP monitoring. Obtained from Refs. [4] and [5], by permission of the authors. Mancia G, Short-Term and Long-Term Blood Pressure Variability, In Special Issues in Hypertension, 2012, A. Berbari and G. Mancia
![Fig. 8.1 The upper panels show the quintile values of the 24-h average mean arterial pressure (MAP), 24-h MAP variability, and the score of target organ damage (TOD). The lower panels show the quintile values of 24-h average systolic blood pressure (SBP), SBP variability, and carotid artery intima-media thickness (IMT). For each quintile, data are shown for subgroups with a BP variability above and below the median value. P refers to the quintile trend. Variability is shown as the standard deviation (SD) of the 24-h SBP mean. The data shown in the upper panels were obtained by intra-arterial BP monitoring. Obtained from Refs. [4] and [5], by permission of the authors.](http://slideplayer.com/slide/5285892/17/images/35/Fig.+8.1+The+upper+panels+show+the+quintile+values+of+the+24-h+average+mean+arterial+pressure+%28MAP%29%2C+24-h+MAP+variability%2C+and+the+score+of+target+organ+damage+%28TOD%29.+The+lower+panels+show+the+quintile+values+of+24-h+average+systolic+blood+pressure+%28SBP%29%2C+SBP+variability%2C+and+carotid+artery+intima-media+thickness+%28IMT%29.+For+each+quintile%2C+data+are+shown+for+subgroups+with+a+BP+variability+above+and+below+the+median+value.+P+refers+to+the+quintile+trend.+Variability+is+shown+as+the+standard+deviation+%28SD%29+of+the+24-h+SBP+mean.+The+data+shown+in+the+upper+panels+were+obtained+by+intra-arterial+BP+monitoring.+Obtained+from+Refs.+%5B4%5D+and+%5B5%5D%2C+by+permission+of+the+authors..jpg "Mancia G, Short-Term and Long-Term Blood Pressure Variability, In Special Issues in Hypertension, 2012, A. Berbari and G. Mancia.")
36
Relation Between Risk of Stroke and Morning BP Surge In The Ohasama Study
Metoki et al. Hypertension.2006

37
Nocturnal BP Dipping Incidence of CV events, 24 h BP and Night/day SBP ratio in Syst Eur study Staessen JA, Parati G et al. for the Systolic Hypertension in Europe (Syst-Eur) Trial Investigators. JAMA 1999; 282:
 Trial Investigators. JAMA 1999; 282:")
38
CV Fatal Events in Relation with DBP Variability
CV Events CV Events Panels show the incidence of cardiovascular fatal events in subgroups with diastolic erratic BP variability and a day–night BP difference above and below the median value. The p values refer to between subgroup differences. D diastolic, DBP diastolic blood pressure, SBP systolic blood pressure. Modified from Ref. [12], by permission of the authors. Mancia G, Short-Terma and Long-Term Blood Pressure Variability, In Special Issues in Hypertension, 2012, A. Berbari and G. Mancia

39
10-year risk associated with ARV24 at different levels of 24-h BP
Systolic BP 10 Diastolic BP 10-year risk of combined CV events, % 150 9 9 89 8 8 7 7 133 6 6 79 123 5 5 73 114 4 4 67 105 60 3 3 np=8938 ne=1049 Parv=0.03 Pbp<0.001 np=8938 ne=1049 Parv=0.04 Pbp<0.001 2 2 7 9 11 13 15 17 5 7 9 11 13 Average real variability (mmHg) Hansen TW et al, Hypertension 2010; 55:
 Hansen TW et al, Hypertension 2010; 55:")
40
Prognostic Importance of BPV
Clinical Relevance of Long Term BPV

41
OHASAMA STUDY - Kaplan-Meier Survival Estimates for CV Mortality across Quartiles of Day-by-Day BP Variability (HBPM) (n= 2455) SD of SBP SD of DBP 15 15 Max Q4 Max 10 10 Q4 CV mortality (%) CV mortality (%) Q3 Q3 5 5 Q1 Min Q2 Q2 Q1 Min 3 6 9 12 3 6 9 12 Follow-up (years) Follow-up (years) Home measurements once a day for 4 weeks Kikuya et al. Hypertension. 2008 17164 M
 CV mortality (%) Q3. Q Q1. Min. Q2. Q2. Q1. Min Follow-up (years) Follow-up (years) Home measurements once a day for 4 weeks. Kikuya et al. Hypertension M.")
42
Visit-to-visit Variability and Risk of Stroke and Coronary Events in UK-TIA and ASCOT-BPLA
Relationship between visit-to-visit BP variability and hazard ratios for stroke and coronary events in the United Kingdom transient ischaemic attack aspirin trial (UKTIA) and the Anglo-Scandinavian cardiac outcome trial (ASCOT) study. Data are shown for deciles of standard deviation (SD) or of another measure of the variability (VIM) of the mean SBP value throughout the treatment period. Symbols as in preceding Figures. BPLA blood pressure lowering arm, CI confidence interval, SBP systolic blood pressure, VIM BP variation independent of the mean. Modified from [30], by permission of the authors. Rothwell PM et al., Lancet 2010; 375:
 and the Anglo-Scandinavian cardiac outcome trial (ASCOT) study. Data are shown for deciles of standard deviation (SD) or of another measure of the variability (VIM) of the mean SBP value throughout the treatment period. Symbols as in preceding Figures. BPLA blood pressure lowering arm, CI confidence interval, SBP systolic blood pressure, VIM BP variation independent of the mean. Modified from [30], by permission of the authors. Rothwell PM et al., Lancet 2010; 375:")
43
BPV: Types and Prognostic Significance
Parati G et al. Nature Reviews Cardiology :

44
Blood Pressure Variability: Mechanisms and Clinical Relevance
BPV: a physiological characteristic of the cardiovascular system Assessment of BPV Prognostic importance of BPV BPV reduction: CV risk lowering independent of BP reduction?

45
DRUG A DRUG B BP (mm Hg) Drug Administration Peak Trough 24 h SD of BP
 Drug Administration Peak Trough 24 h SD of BP")
46
WHICH ANTIHYPERTENSIVE DRUG DO REDUCE BP VARIABILITY BEST?
Target for Research WHICH ANTIHYPERTENSIVE DRUG DO REDUCE BP VARIABILITY BEST?

47
Within-visit variability of systolic blood pressure in ASCOT-BPLA
Cox analyses demonstrated that predictors of all-cause and CV mortality were age, aortic pulse wave velocity, low diastolic blood pressure, preexisting CV disease, and increased augmentation index, whereas the prescription of an ACE inhibitor had a favorable effect on survival. After adjustment for all confounding factors, the risk ratio for each 10% increase in augmentation index was 1.51 (95% confidence interval, 1.23 to 1.86; P,0.0001) for all-cause mortality and 1.48 (95% confidence interval, 1.16 to 1.90; P,0.0001) for CV mortality. These results provide the first direct evidence that in ESRF patients increased effect of arterial wave reflections is an independent predictor of all-cause and CV mortality. PM Rothwell et al., Published online March 12, 2010 6083 P
 for all-cause mortality and 1.48 (95% confidence interval, 1.16 to 1.90; P,0.0001) for CV mortality. These results provide the first direct evidence that in ESRF patients increased effect of arterial wave reflections is an independent predictor of all-cause and CV mortality. PM Rothwell et al., Published online March 12, P.")
48
Comparison of Monotherapies
* † * ‡ † † A comparison of the 24-h systolic and diastolic ambulatory blood pressure smoothness indices for seven antihypertensive monotherapies and placebo; data are based on nine trials involving 3928 monotherapy- treated patients. A5, amlodipine 5 mg; DBP, diastolic blood pressure; L50, losartan 50 mg; R10, ramipril 10 mg; SBP, systolic blood pressure; T40, telmisartan 40 mg; T80, telmisartan 80 mg; V80, valsartan 80 mg; V160, valsartan 160 mg. The smoothness index was always greater for SBP than for DBP. All active treatments had much higher smoothness indices com- pared with placebo. For both systolic and diastolic ABP, the smoothness indices obtained with telmisartan 80 mg were similar to those of amlodipine 5 mg, and superior to those of losartan 50 mg, valsartan 80 mg and 160 mg, and ramipril 10mg. (n = 160) (n = 50) (n = 712) (n = 197) (n = 430) (n = 140) (n = 2033) (n = 206) L50, losartan 50 mg; R10, ramipril 10 mg; V80–160, valsartan 80–160 mg; T40–80, telmisartan 40–80 mg; A5, amlodipine 5 mg *p < 0.05; †p < 0.01; ‡p < 0.001; §p < vs telmisartan 80 mg Parati G et al J.Hypertens 2010; 28:
 (n = 50) (n = 712) (n = 197) (n = 430) (n = 140) (n = 2033) (n = 206) L50, losartan 50 mg; R10, ramipril 10 mg; V80–160, valsartan 80–160 mg; T40–80, telmisartan 40–80 mg; A5, amlodipine 5 mg. *p < 0.05; †p < 0.01; ‡p < 0.001; §p < vs telmisartan 80 mg. Parati G et al J.Hypertens 2010; 28:")
49
Amlodipine significantly reduces short-term BPV
* P=0.01 * * * * P=0.08 * SBP variability (mmHg) Placebo Candesartan Indapamide Amlodipine Yi Zhang, et al. Hypertension. 2011;58:
 Placebo. Candesartan. Indapamide. Amlodipine. Yi Zhang, et al. Hypertension. 2011;58:")
50
Does Treatment-Induced Reduction in BPV Improve Outcome
Does Treatment-Induced Reduction in BPV Improve Outcome? Target for Research Studies in rats showed improvement outcome related to TOD Conclusive clinical studies are pending

51
BPV – Need of additional studies
Average BP levels and/or BPV? Short or Long Term BPV? Which measure of BPV to choose? Relationships with physiological variables (e.g. endothelial function, SpO2, arterial stiffness)? BPV in Risk Stratification?
 BPV in Risk Stratification")
52
BPV – Need of additional studies
Is a drug-induced reduction in BPV accompanied by a reduction in event rate? Do different drug classes have a different effect on BPV and on outcome? Is there enough evidence to consider BPV as a new target for treatment?

53
Conclusions Average BP levels and/or BPV? Both Short or Long Term BPV?
Which measure of BPV to choose? Relationships with physiological variables (e.g. endothelial function, SpO2, arterial stiffness)? BPV in Risk Stratification? Both Mainly short SD Some correlations exist ?
 BPV in Risk Stratification Both. Mainly short. SD. Some correlations exist.")
54
Conclusions Is a drug-induced reduction in BPV accompanied by a reduction in event rate? Do different drug classes have a different effect on BPV and on outcome? Is there enough evidence to consider BPV as a new target for treatment? ? Probably CCBs and long-acting ARBs? ?

55
Conclusions 24 h BP values more closely related to TOD and future events than office readings Higher 24 h BP Variability = Higher CV risk Long lasting CCBs seem to score best in reducing short term and long term BPV Prospective outcome studies needed to confirm that treatment-induced reduction in BPV improves outcome

56
Lebanese Variability Thank You

Similar presentations


![Resistant hypertension increases patients’ cardiovascular risk 30% of all treated patients develop resistant hypertension [1-5]. Resistant hypertension.](/14/4477647/big_thumb.jpg "Resistant hypertension increases patients’ cardiovascular risk 30% of all treated patients develop resistant hypertension [1-5]. Resistant hypertension.>")


