Download presentation
Presentation is loading. Please wait.

1
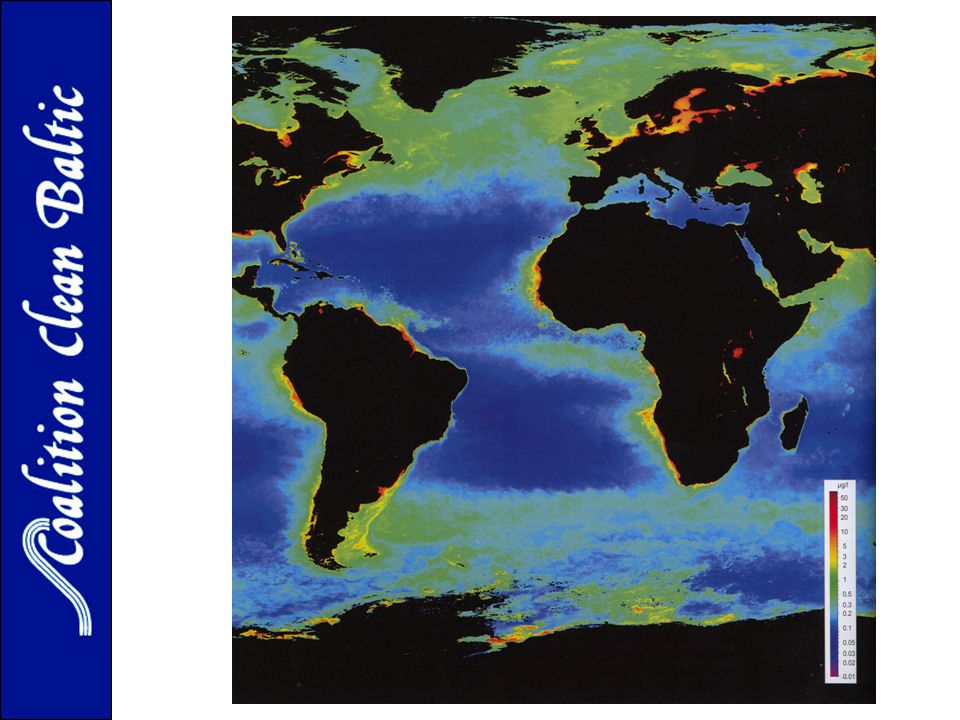
1 Mr Gunnar Norén Executive Secretary to Coalition Clean Baltic 17 April 2015, Warzaw, Poland Solutions for Polish and Baltic Eutrophication – Low-Nutrient Surplus Agriculture and Sustainable Wastewater Management Nutrient management in agriculture and Our commitments to the Baltic Sea Action Plan

2
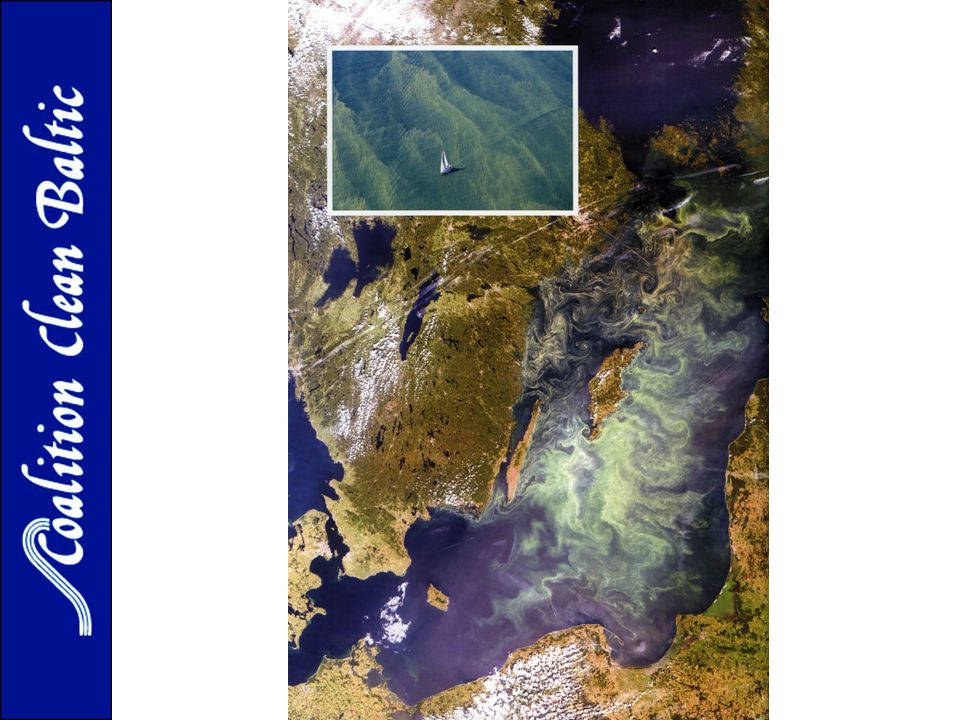
2 Content of the Presentation ·Baltic Sea eutrophication ·P and N, necessary for mankind. Cannot be sustituted. ·Nutrient management on farmland today ·Saving valuable Nutrient resources for fertilizers ·HELCOM regulations on agriculture nutrients ·Future directions for Fertilizers management *Recommended Nutrient surplus levels

3
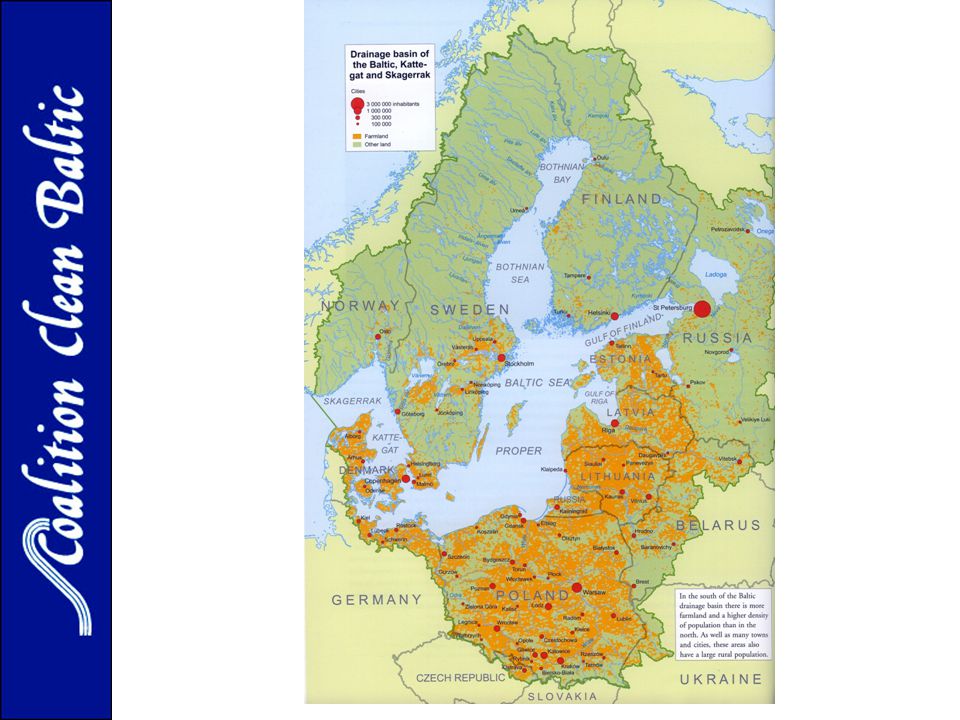
Coalition Clean Baltic CCB – Joining forces for the Baltic CCB is a network of Environmental NGOs, grass-root level, in 11 countries bordering the Baltic Sea CCB was established in 1990 CCB is environmental Citizens Organisations (ECO) in cooperation CCB has 20 member organizations, have 800 000 individual members CCB has organisations in: Belarus, Denmark, Estonia, Finland, Germany, Latvia, Lithuania, Poland, Russia, Sweden and Ukraine
 in cooperation CCB has 20 member organizations, have individual members CCB has organisations in: Belarus, Denmark, Estonia, Finland, Germany, Latvia, Lithuania, Poland, Russia, Sweden and Ukraine")
6
Nitrogen and Phosphorus essential elements for plant growth Cannot be substituted– necessary for crop production & life on planet Earth * Strategic natural resources for mankind Relatively small proportion of phosphorus fertilizers applied to food production systems is taken up by crops (15 %) A significant fraction of applied N and P makes its way to the sea Push marine and aquatic systems across ecological thresholds
 A significant fraction of applied N and P makes its way to the sea Push marine and aquatic systems across ecological thresholds")
7
Sources for Phosphorus fertilizer - Global KLICKA FÖR ATT SKRIVA

8
Global Phosphorus production- Peak phosphorus US Geological surveys have updated world-wide P- resources. Peak-P delayed another 30 years

9
European Phosphorus use P – announced as one of 20 Critical Raw Materials of EU Lost P in European wastewater stream could cover 15 % of the European mineral P demand

10
Nitrogen and Phosphorus flows to biosphere & oceans Biogeochemical cycles of N and P have been radically changed by humans, as result of many industrial and agricultural processes * Human activities now convert more atmospheric nitrogen into reactive forms than all of the Earth’s terrestial processes combined Stockholm Resilience Center-Sustainable Sciences for Biosphere Stewardship

11
Planetary Boundaries : The current status of the control variables for seven of the nine planetary boundaries boundariesboundaries Source: Steffen and others, 16 January 2015, Science

12
AGRICULTURE and EUTROPHICATION Baltic agriculture – contribute with more than 50 % of the nutrient load (Nitrogen & Phosphorus) We are loosing from Baltic farmland soils 10 000 ton P / year 230 000 ton N / year Nutrient resources are wasted !
 We are loosing from Baltic farmland soils ton P / year ton N / year Nutrient resources are wasted !")
14
Agricultural N and P balances OECD countries submit annual calculations of soil N and P balance (also EUROSTAT) -N and P-application levels in Europé correlated to GDP and to population density -NOT correlated to fertilizer requirement(soil N and P status, or expected crop yield) -Net P-application is justified if soil has low P, as is the case in much of Central-Eastern Europe
 -N and P-application levels in Europé correlated to GDP and to population density -NOT correlated to fertilizer requirement(soil N and P status, or expected crop yield) -Net P-application is justified if soil has low P, as is the case in much of Central-Eastern Europe")
15
Soil phosphorus – negative correlation -Proportion of land with high P-status (good or very good soil P supply) is over 50 % in Belgium, Netherlands, Denmark, Sweden -The proportion of land with high P-status is very much lower in EU 12 ’accession’ states than in EU 15 -Comparison of soil P status to P fertiliser balance shows a negative correlation:that is, the opposite of agronomic logic – soils needing higher P application are overall actually receiving less, and soils with very good or excess P status, needing no mineral or organic P-application, receive the highest amounts
 is over 50 % in Belgium, Netherlands, Denmark, Sweden -The proportion of land with high P-status is very much lower in EU 12 ’accession’ states than in EU 15 -Comparison of soil P status to P fertiliser balance shows a negative correlation:that is, the opposite of agronomic logic – soils needing higher P application are overall actually receiving less, and soils with very good or excess P status, needing no mineral or organic P-application, receive the highest amounts")
16
Cumulative balances and environmental impacts - Since introduction of EU Nitrates Directive (1991/676) total N surplus applied on land, in Belgium, Netherlands, Denmark has exceeded 2000 kg N/ha -Cumulative Nitrogen balances are significantly lower in the EU 12 ’accession’ states -Comparison shows – countries with higher cumulatives N balances have High levels of Nitrate groundwater pollution -Countries with lower cumulative N balances have lower nitrate pollution
 total N surplus applied on land, in Belgium, Netherlands, Denmark has exceeded 2000 kg N/ha -Cumulative Nitrogen balances are significantly lower in the EU 12 ’accession’ states -Comparison shows – countries with higher cumulatives N balances have High levels of Nitrate groundwater pollution -Countries with lower cumulative N balances have lower nitrate pollution")
17
(European Nitrogen Assessment, Cambridge Univ. 2011) Estimated trends in European reactive nitrogen emissions between 1900 and 2000 (EU-27)
 Estimated trends in European reactive nitrogen emissions between 1900 and 2000 (EU-27).")
18
Conclusion EU regulations are not achieving their objectives (Safe groundwater, No eutrophication ) regarding nutrient application and resulting pollution
 regarding nutrient application and resulting pollution")
19
Recommendations for Nitrogen fertilization Limit N-application to take into account manure nitrogen, both as applied in same year and accumulated from previous years -Include soil N status and cumulative N balances in agro-environmnetal indicators

20
Recommendations for phosphorus fertilization Application limits for P, taking into account crop P response -Limit P-application, take into account P in manure applied during the year and accumulated over previous years -Complete banning of P-application from manure over 22 kg P / ha (HELCOM Annex III-Prevention of pollution from agriculture)(if not a shortage of P in soils, according to Nutrient-balanced calculations) -Banning P-application to soils which already have excess of P (No P-fertilization on P-saturated soils)(No manure on such soils) -Including soil P status and cumulative P balances in agro-environmental indicators
(if not a shortage of P in soils, according to Nutrient-balanced calculations) -Banning P-application to soils which already have excess of P (No P-fertilization on P-saturated soils)(No manure on such soils) -Including soil P status and cumulative P balances in agro-environmental indicators")
21
For all Fertilizer use Among EU Member States- harmonization calculation methods for organic manure N and P contents and uptake over years; Maximum permissable (plant uptake organic + total mineral) N doses Undertaken in Nitrates Directive National Action Programs HELCOM has agreement(2013) to set up harmonized nutrient levels in various manure
 N doses Undertaken in Nitrates Directive National Action Programs HELCOM has agreement(2013) to set up harmonized nutrient levels in various manure")
22
Major reconstructuring of livestock production across Europé is essential EU Policy failures EU environmental policies are not effective in reducing nutrient pollution if livestock density is market driven -Up to 30-50 % of all European freshwaters have to high nutrient levels, creating eutrophication etc -European regional sea areas, Baltic Sea & North Sea, have Eutrophication problems -Regions with excess manure can sustain, only if surplus manure are exported out from the region(e.g. Flanders, Britanny, Germany)
.")
23
Annual nitrogen flows (kg/ha) in a pig farming system
 in a pig farming system")
24
The role of the farmer is crucial – importance of individual farmers decisions. Farmers-businessmen, primary aim is to optimise their production system to the benefit of themselves Potential for change for increased N efficiency (%) and that achieved in practice by skilled farmers (European Nitrogen Assessment, Cambridge Univ. 2011)
 and that achieved in practice by skilled farmers (European Nitrogen Assessment, Cambridge Univ. 2011).")
25
Precision N-application, out from sensor maps Nitrogen application ’map’ based on crop scanning by a tractor-mounted N-sensor

26
HELCOM regulations on agriculture nutrients HELCOM Annex III, part 2 - Prevention of pollution from agriculture (Helsinki Convention is legally binding) -Request Nutrient-balanced fertilization – Application of fertilizer nutrient shall be balanced with the need of the crops - No overfertilization -Controlled via ”Nutrient surplus on farmland” calculations
 -Request Nutrient-balanced fertilization – Application of fertilizer nutrient shall be balanced with the need of the crops - No overfertilization -Controlled via Nutrient surplus on farmland calculations")
27
HELCOM Ministerial meeting, October 2013 decided *WE AGREE applying by 2018 at the latest annual nutrient accounting at farm level taking into account soil and climate conditions giving the possibility to reach nutrient balanced fertilization and reduce nutrient losses at regional level in the countries *With a view to fully utilize nutrient content of manure in fertilization practices and to avoid overfertilization WE ALSO AGREE to establish by 2016 national guidelines or standards for nutrient content in manure and to develop by 2018 guidelines/recommendation on the use of such standards;

28
Requirements on Baltic farmland * Mandatory Nutrient bookkeeping (N & P) and Nutrient Surplus calculation (kg N & P/ha,y) at soil-field level *Baltic countries develop National tolerable nutrient surplus limit values (max kg N/ha,y, kg P/ha,y) (HELCOM agreement 2013)
 and Nutrient Surplus calculation (kg N & P/ha,y) at soil-field level *Baltic countries develop National tolerable nutrient surplus limit values (max kg N/ha,y, kg P/ha,y) (HELCOM agreement 2013)")
29
Nutrient application and Nutrient Surplus levels Nitrate Directive : max 170 kg N/ha,y -Complete banning of N-surplus over 50 kg N/ha,y -Tolerable N-surplus – crop production: 20- 25 kg N/ha,y -Tolerable N-surplus – animal production: 25-35 (40) kg N/ha,y -------------------------------------- -Max P from manure: 22 kg P/ha,y (HELCOM Annex III) -Tolerable P-surplus levels: 0-2 kg P/ha,y
 kg N/ha,y Max P from manure: 22 kg P/ha,y (HELCOM Annex III) -Tolerable P-surplus levels: 0-2 kg P/ha,y")
30
Phosphorus soil balance in regions of Sweden Shortage & Surplus KLICKA FÖR ATT SKRIVA

31
Nutrient balancing to be applied on 3 levels -Soil/field level -Farm/neighbourhood/region level -National level (can also include manure nutrient export to outside fields/regions/nations)
")
32
Intensive Agriculture in Baltic catchment If most of the farmland in Baltic EU accession countries will apply * Intensive agricultural practices with low-standard nutrient management Baltic Sea eutrophication will increase Impossible to solve the Baltic eutrophication problem without better Nutrient management on Baltic farmland

33
(European Nitrogen Assessment, Cambridge Univ. 2011) Estimated environmental costs due to reactive nitrogen emissions to air and to water in the EU-27
 Estimated environmental costs due to reactive nitrogen emissions to air and to water in the EU-27.")
34
Environmental damage related to N effects from agriculture in EU-27 Environmnetal damage estimated to 20 – 150 billion Euro per year -Can be compared with the benefits on N- fertilizers for farmers of 10 – 100 billion Euro per year -With considerable uncertainty about long- term N-benefits for crop yield (European Nitrogen Assessment, Cambridge Univ. 2011)
.")
35
Public money (Taxes) – for Public goods National CAP-subsidies should support – solving the overfertilization & Baltic Sea eutrophication problem Rural Development Plans & Agro- Environmental programmes Feed the crop – Not the soil
 – for Public goods National CAP-subsidies should support – solving the overfertilization & Baltic Sea eutrophication problem Rural Development Plans & Agro- Environmental programmes Feed the crop – Not the soil")
36
Thanks for your attention!

Similar presentations


>")


 Maret Merisaar Estonian.>")
