Download presentation
Presentation is loading. Please wait.

1
Specific Factors and Income Distribution
Pierre-Louis Vézina

2
Specific Factors and Income Distribution
Two main reasons why international trade has strong effects on the distribution of income within a country: Industries differ in the factors of production they use (Stolper-Samuelson) Factors cannot move immediately or costlessly from one industry to another
 Factors cannot move immediately or costlessly from one industry to another.")
3
Specific Factors and Income Distribution
Two main reasons why international trade has strong effects on the distribution of income within a country: Industries differ in the factors of production they use (Stolper-Samuelson) Factors cannot move immediately or costlessly from one industry to another Specific factors
 Factors cannot move immediately or costlessly from one industry to another. Specific factors.")
4
The example of Japan’s farmers
Japan’s rice policy allows very little rice to be imported To export $100 of rice to Japan you must pay $778 in tariff duties! Scarce land means rice is much more expensive to produce in Japan than in other countries

5
The example of Japan’s farmers
Little question Japan as a whole would be better off by importing rice But Japanese farmers would be hurt

6
The example of Japan’s farmers
The farmers could move to the Toyota factory But changing jobs and cities is costly and inconvenient The special skills they developed would be useless at the Factory (I’ve worked in this field all my life, and so did my ancestors before me!)
")
7
The example of Japan’s farmers
In the short-run, farmers cannot move to the Toyota factory Their skills are specific to the rice fields

8
Specific factor model Paul Samuelson (again!) and Ronald Jones
 and Ronald Jones")
9
Specific factor model What is a specific factor?
Specific labour: A farmer, a car-factory worker?

10
Specific factor model Vats to brew beer
Stamping presses to build auto bodies

11
Specific factor model Both vats and stamping presses can be thought of as specific capital In the short-run, you can’t use your vats to produce cars Vats are specific to beer Presses are specific to cars

12
Specific factor model Assumptions: Two goods, cloth and food.
Three factors of production labour (L) capital (K) land (T for terrain) Perfect competition
 capital (K) land (T for terrain) Perfect competition.")
13
Specific factor model Cloth produced using capital and labour (but not land) QC = QC (K, LC) Food produced using land and labour (but not capital) QF = QF (T, LF)
")
14
Specific factor model Labour is a mobile factor that can move between sectors (Farmers can go work at Toyota) Land and capital are both specific factors used only in the production of one good

15
Specific factor model Cloth production function

16
Specific factor model Cloth production function
The shape of the function reflects diminishing returns

17
Specific factor model Adding one worker (without increasing the amount of capital) means that each worker has less capital to work with Each additional worker adds less output than the last

18
Specific factor model The marginal product of labour is the slope of the production function

19
Specific factor model It gives the increase in output that corresponds to an extra unit of labour The marginal product of labour is the slope of the production function

20
Specific factor model It gives the increase in output that corresponds to an extra unit of labour Remember when we studied the Stolper-Samuelson theorem, we assumed the marginal productivity of labour decreased with L/K. That’s why! The marginal product of labour is the slope of the production function

21
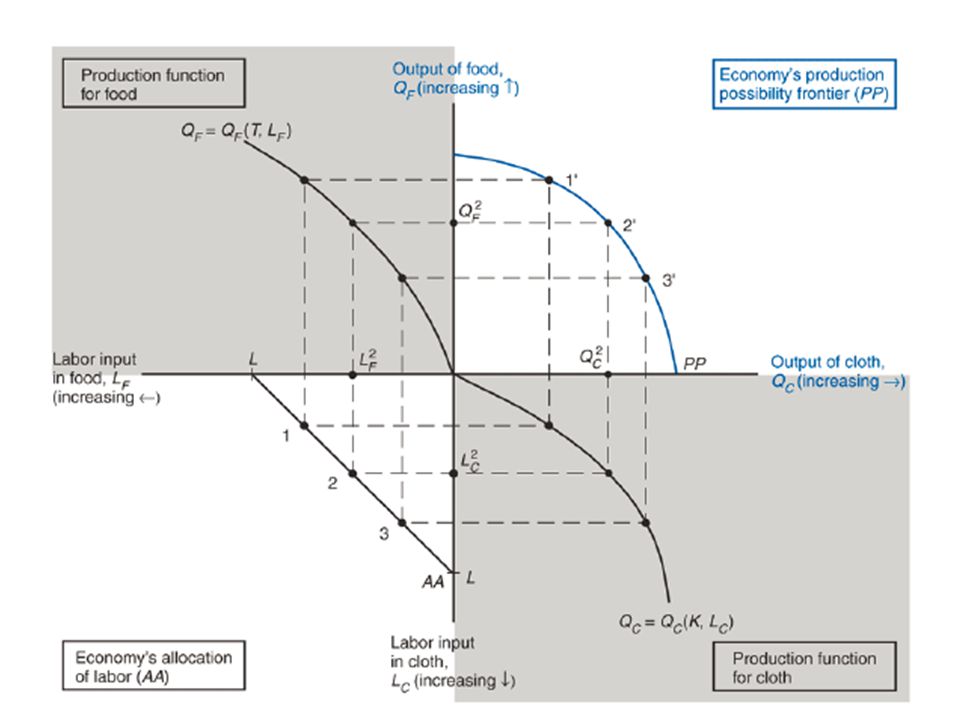
Specific factor model How does the economy’s mix of output change as labour is shifted from one sector to the other? For the economy as a whole, the total labour employed in cloth and food must equal the total labour supply: LC + LF = L We have 2 productions functions (Cloth and Food) and a labour constraint Let’s draw a PPF
 and a labour constraint. Let’s draw a PPF.")
23
Specific factor model Why is the production possibilities frontier curved? The slope is MPLF/MPLC

25
The slope is MPLF

26
The slope is MPLF The slope is MPLC

27
The slope is MPLF / MPLC The slope is MPLF The slope is MPLC

28
Specific factor model Opportunity cost of cloth in terms of food is the slope of the PPF Opportunity cost of producing one more cloth is MPLF/MPLC of food The slope becomes steeper as an economy produces more cloth Opportunity cost rises with production

29
Specific factor model How much labour is employed in each sector?

30
At which point am I on this line?

31
Specific factor model Need to look at supply and demand in the labour market In each sector, employers will maximize profits by demanding labour up to the point where the value produced by an additional hour equals the marginal cost of employing a worker for that hour

32
Specific factor model Need to look at supply and demand in the labour market In each sector, employers will maximize profits by demanding labour up to the point where the value produced by an additional hour equals the marginal cost of employing a worker for that hour You wouldn’t hire a worker if the value of his production was less than his wage

33
Specific factor model The demand curve for labour in the cloth sector:
MPLC x PC = w

34
Specific factor model The demand curve for labour in the cloth sector:
MPLC x PC = w His wage

35
Specific factor model The demand curve for labour in the cloth sector:
MPLC x PC = w His wage The value of his production

36
Specific factor model The demand curve for labour in the cloth sector:
MPLC x PC = w His wage The value of his production The wage equals the value of the marginal product of labour in cloth manufacturing

37
Specific factor model The demand curve for labour in the food sector: MPLF x P F = w

39
The two sectors must pay the same wage because labour can move between sectors

40
Where the labour demand curves intersect gives the equilibrium wage and allocation of labour between the two sectors The two sectors must pay the same wage because labour can move between sectors

41
Specific factor model At production (point 1) we have
w = MPLC × PC = MPLF × PF Rearranging we have: -MPLF/MPLC = -PC/PF

42
Specific factor model At production (point 1) we have
w = MPLC × PC = MPLF × PF Rearranging we have: -MPLF/MPLC = -PC/PF The slope of the production possibility frontier

43
Specific factor model

44
Specific factor model The slope of the production possibility frontier must be tangent to a line whose slope is minus the price of cloth divided by that of food

45
Specific factor model The slope of the production possibility frontier must be tangent to a line whose slope is minus the price of cloth divided by that of food This gives us a relationship between relative prices and output mix

46
Specific factor model What happens to the allocation of labour and the distribution of income when the prices of food and cloth change? Let’s say PC increases by 7%

47
Specific factor model

48
Specific factor model The demand for labour increases in the cloth sector

49
Specific factor model The demand for labour increases in the cloth sector Labour shifts from the food sector to the cloth sector

50
Specific factor model The demand for labour increases in the cloth sector Labour shifts from the food sector to the cloth sector The wage rate (w) does not rise as much as PC since cloth employment increases and thus the marginal product of labour in that sector falls
 does not rise as much as PC since cloth employment increases and thus the marginal product of labour in that sector falls.")
51
Specific factor model The demand for labour increases in the cloth sector Labour shifts from the food sector to the cloth sector The wage rate (w) does not rise as much as PC since cloth employment increases and thus the marginal product of labour in that sector falls
 does not rise as much as PC since cloth employment increases and thus the marginal product of labour in that sector falls.")
52
Specific factor model The demand for labour increases in the cloth sector Labour shifts from the food sector to the cloth sector This is how prices affect wages! Remember Stolper-Samuelson The wage rate (w) does not rise as much as PC since cloth employment increases and thus the marginal product of labour in that sector falls
 does not rise as much as PC since cloth employment increases and thus the marginal product of labour in that sector falls.")
53
Specific factor model

54
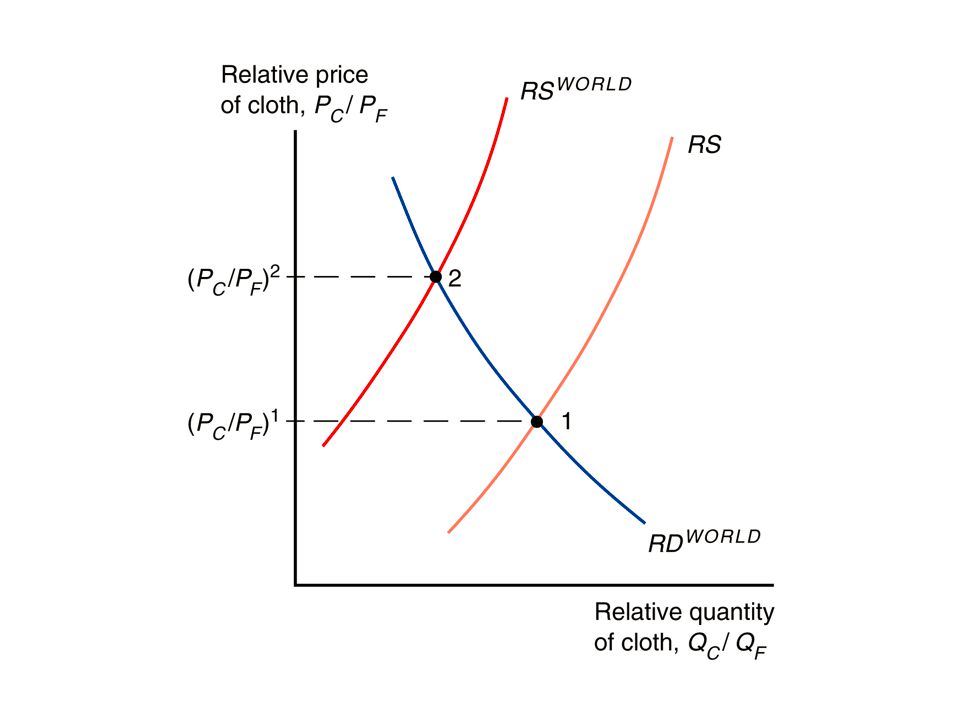
International Trade Opening up to trade increases the relative price of cloth in an economy whose relative supply of cloth is larger than for the world as a whole

56
The differences in RS and RSWORLD can be due to technology or resource differences

57
International Trade Without trade, the economy’s output of a good must equal its consumption International trade allows the mix of cloth and food consumed to differ from the mix produced The country cannot spend more than it earns: PC DC + PF DF = PC QC +PF QF

58
International Trade Without trade, the economy’s output of a good must equal its consumption International trade allows the mix of cloth and food consumed to differ from the mix produced The country cannot spend more than it earns: PC DC + PF DF = PC QC +PF QF Value of consumption Value of production

59
International Trade Rearranging, we get: DF - QF = (PC / PF) (QC – DC)
 (QC – DC)")
60
International Trade Rearranging, we get: DF - QF = (PC / PF) (QC – DC)
Cloth exports Food imports

61
International Trade Rearranging, we get: DF - QF = (PC / PF) (QC – DC)
An economy can import an amount of food equal to the relative price of cloth times the amount of cloth exported Cloth exports Food imports

62
International Trade Rearranging, we get: DF - QF = (PC / PF) (QC – DC)
An economy can import an amount of food equal to the relative price of cloth times the amount of cloth exported Cloth exports Food imports What you import is limited by your exports This is your budget constraint

63
International Trade Rearranging, we get: DF - QF = (PC / PF) (QC – DC)
An economy can import an amount of food equal to the relative price of cloth times the amount of cloth exported Cloth exports Food imports What you import is limited by your exports This is your budget constraint

64
International Trade Rearranging, we get: DF - QF = (PC / PF) (QC – DC)
An economy can import an amount of food equal to the relative price of cloth times the amount of cloth exported Cloth exports Food imports What you import is limited by your exports This is your budget constraint You can consume anything you want within your budget constraint

66
Gains from Trade The economy can consume more of both goods if it consumes along the PPF in the blue zone

67
Gains from Trade The economy can consume more of both goods if it consumes along the PPF in the blue zone The economy is able to afford amounts of cloth and food that the country is not able to produce itself

68
Trade and the Distribution of Income
Suppose that with trade PC increases by 7%. Then, the wage would rise by less than 7% What is the economic effect of this price increase on the incomes of the following three groups? workers owners of capital owners of land

69
Output Is Equal to the Area Under the Marginal Product Curve

70
The Distribution of Income Within the Cloth Sector

71
A Rise in PC Benefits the Owners of Capital

72
A Rise in PC Benefits the Owners of Capital
PC rises more than w, so w/ PC falls

73
A Rise in PC Hurts Landowners
w rise, so w/ PF rises

74
Announcement Test on Monday 8 Dec! No lecture on Friday 12 Dec!

75
World trade fact of the week
Door to door, the journey from China to Duisburg for HP’s products takes an average 22 days by train, or half what it can by sea, and costs just per cent more, Mr Kleijwegt says Financial Times, 17 Oct 2014, Geopolitics cast shadow over New Silk Road

76
Trade and the Distribution of Income
Owners of capital are definitely better off Landowners are definitely worse off We cannot say whether workers are better or worse off: Depends on the relative importance of cloth and food in workers’ consumption (w/ PC falls but w/ PF rises)
")
77
Trade and the Distribution of Income
Trade benefits the factor that is specific to the export sector (whose relative price rises), but hurts the factor that is specific to the import-competing sectors Owners of land lose if Japan opens up to rice imports Trade has ambiguous effects on mobile factors, i.e. workers Wages will go up but so will the price of cars
, but hurts the factor that is specific to the import-competing sectors. Owners of land lose if Japan opens up to rice imports. Trade has ambiguous effects on mobile factors, i.e. workers. Wages will go up but so will the price of cars.")
78
Trade and the Distribution of Income
Trade benefits a country by expanding choices Economists support free trade as it is possible to redistribute income so that everyone gains from trade Those who gain from trade could compensate those who lose and still be better off themselves The government could tax Toyota by giving free cars to landowners. That would compensate them for their income loss

79
Trade and unemployment
Trade shifts jobs from import-competing to export sectors Process not instantaneous – some workers will be unemployed as they look for new jobs

80
Trade and unemployment
If workers are sector-specific, they lose from trade if in the importing sector

81
Trade and unemployment
How much unemployment can be traced back to trade? From 1996 to 2008, only about 2.5% of involuntary displacements stemmed from import competition or plants moved overseas

82
Trade and unemployment

83
Trade and unemployment
Governments usually provide a “safety net” of income support to cushion the losses to groups hurt by trade (or other changes)
")
84
Trade and unemployment

85
RECAP 3 models of trade: Ricardo helps us understand why countries gain from trade Specific factors help us understand why trade creates winners and losers in the short run Hecksher-Ohlin helps us understand the pattern of trade, why countries only partly specialise and why, even in the long run, some factors lose from trade

86
Who is against free trade?
Trade creates winners and losers Does this explain why some people and countries are more protectionist than others?

87
Who is against free trade?
Anna Maria Mayda & Dani Rodrik "Why are some people (and countries) more protectionist than others?," 2005 European Economic Review
 more protectionist than others , 2005 European Economic Review.")
88
Who is against free trade?
World Values Survey: “Do you think it is better if: (1) Goods made in other countries can be imported and sold here if people want to buy them; or that: (2) There should be stricter limits on selling foreign goods here, to protect the jobs of people in this country; or: (9) Don’t Know.”
 Goods made in other countries can be imported and sold here if people want to buy them; or that: (2) There should be stricter limits on selling foreign goods here, to protect the jobs of people in this country; or: (9) Don’t Know.")
89
Who is against free trade?
World Values Survey (2002): 60% of respondents are anti free trade A 2006 poll of PhD members of the American Economic Association: 12% of economists are anti free trade
: 60% of respondents are anti free trade. A 2006 poll of PhD members of the American Economic Association: 12% of economists are anti free trade.")
90
Why are some people (and countries) more protectionist than others?
Prediction of the factor-specific model: Workers cannot move across sectors Workers in comparative-disadvantage sectors lose from globalization as they lose their job or suffer form income losses as prices go down in their sectors

91
Why are some people (and countries) more protectionist than others?
Prediction of the Heckscher-Ohlin model: Costless inter-sector mobility of workers Here trade benefits individuals who own the factors with which the economy is relatively well endowed and hurts the others. This is the Stolper-Samuelson theorem.

92
Why are some people (and countries) more protectionist than others?
According to the HO model, in countries relatively well-endowed with skilled labour, more-skilled workers should support freer trade According to the specific-factor model, workers employed in comparative–advantage sectors should support freer trade

93
Why are some people (and countries) more protectionist than others?
They find that individuals employed in import competing industries are more likely to favor trade restrictions As the specific factor model predicted

94
Why are some people (and countries) more protectionist than others?
They find that higher education people oppose trade restrictions, but only in countries that are well endowed with high-skilled human capital measured by GDP per capita)
")
95
Why are some people (and countries) more protectionist than others?
Impact of education on being pro free trade

96
Why are some people (and countries) more protectionist than others?
By showing that the impact of education (skills) on trade preferences was dependent on GDP, they rule out that better educated people prefer more trade simply because they have a better understanding of comparative advantage
 on trade preferences was dependent on GDP, they rule out that better educated people prefer more trade simply because they have a better understanding of comparative advantage.")
97
Who is against free trade?

98
Who is against free trade?
Why doesn’t everyone get the case for free trade?

99
The Political Economy of Trade Policy
Trade produces losers as well as winners Does this explain trade protection?

100
The Political Economy of Trade Policy
Typically, those who gain from trade are a much less concentrated, informed, and organized group than those who lose Mancur Olson: Concentrated minor interests will be overrepresented and diffuse majority interests trumped

101
The Political Economy of Trade Policy
Typically, those who gain from trade are a much less concentrated, informed, and organized group than those who lose Mancur Olson: Concentrated minor interests will be overrepresented and diffuse majority interests trumped This can explain import tariffs on rice in Japan

102
The Political Economy of Trade Policy
Another good example is the US sugar industry US has been limiting imports of sugar for many years using import quotas As a result, sugar is twice as expensive in the US

103
The Political Economy of Trade Policy

104
The Political Economy of Trade Policy
The cost to consumers of this higher price amounts to $2 billion a year The gains to the sugar industry are probably less than half of that So why does the government restrict sugar imports?

105
The Political Economy of Trade Policy
Each consumer suffers very little, and the costs are spread across cupcakes and milkshakes Consumers don’t even know about the import quotas

106
The Political Economy of Trade Policy
Sugar producers on the other hand know they get higher profits thanks to the quotas And the profits are quite concentrated Only 17 farms generate more than 50% of the sugar industry’s profits Those producers are organized in associations that make large campaign contributions

108
The Political Economy of Trade Policy
Trade restrictions do protect jobs, but at a cost of $826,000 a job per year And some candy companies that need sugar as inputs move to Canada, where sugar prices are lower, thus destroying jobs in the US

109
The Political Economy of Trade Policy

110
International labour mobility
Why does labour migrate and what effects does labour migration cause? The specific-factor model can also help us answer this question!

111
Remember this graph?

112
International labour mobility
Consider movement of labour across countries instead of across sectors (Think of food as Foreign and cloth as Home)
")
113
International labour mobility
Let’s say the 2 countries produce only food and it is not traded To produce food, you need two factors of production, land and labour: Land cannot move across countries but labour can

115
MPLs give us real wages (w/p)
")
116
Let’s assume we are initially at L1
MPLs give us real wages (w/p) Let’s assume we are initially at L1
 Let’s assume we are initially at L1.")
117
Let’s assume we are initially at L1
MPLs give us real wages (w/p) Let’s assume we are initially at L1 Given this international division of labour, real wages are higher in Foreign (B) than at home (C)
 Let’s assume we are initially at L1. Given this international division of labour, real wages are higher in Foreign (B) than at home (C)")
118
Let’s assume we are initially at L1
MPLs give us real wages (w/p) Let’s assume we are initially at L1 Given this international division of labour, real wages are higher in Foreign (B) than at home (C) Lower wage due to less land per worker (lower productivity)
 Let’s assume we are initially at L1. Given this international division of labour, real wages are higher in Foreign (B) than at home (C) Lower wage due to less land per worker (lower productivity)")
119
International labour mobility
Workers migrate to wherever wages are highest workers are moving abroad!

120
If workers are free to migrate, workers move from Home to Foreign until real wages are equal across countries (point A)
")
121
Home workers earn more due to emigration regardless if they migrate or stay home

122
Home workers earn more due to emigration regardless if they migrate or stay home
Immigration into Foreign increases the supply of labour and Foreign workers now earn less

123
International labour mobility
Migration increases world output!

124
The value of foreign output rises by the area under its MPL
The value of foreign output rises by the area under its MPL* curve from L1 to L2

125
The value of foreign output rises by the area under its MPL
The value of foreign output rises by the area under its MPL* curve from L1 to L2 Landowners in Foreign gain

126
The value of foreign output rises by the area under its MPL
The value of foreign output rises by the area under its MPL* curve from L1 to L2 The value of domestic output falls by the area under its MPL curve from L2 to L1

127
The value of foreign output rises by the area under its MPL
The value of foreign output rises by the area under its MPL* curve from L1 to L2 Home landowners lose The value of domestic output falls by the area under its MPL curve from L2 to L1

128
The value of foreign output rises by the area under its MPL
The value of foreign output rises by the area under its MPL* curve from L1 to L2 Foreign output increases more than Home decreases! The value of domestic output falls by the area under its MPL curve from L2 to L1

129
That’s because labour moves to where it is more productive
World output rises!

130
That’s because labour moves to where it is more productive
World output rises! The value of world output is maximized when the marginal productivity of labour is the same across countries

131
International labour mobility
Does migration lead to the wage changes predicted? Let’s look at the Age of Mass Migration

132
International labour mobility

133
International labour mobility
Real wages in 1870 were much higher in destination countries than in origin countries

134
International labour mobility
Up until the eve of World War I in 1913, wages rose faster in origin countries than in destination countries (except Canada) Migration moved the world toward more equalized wages
 Migration moved the world toward more equalized wages.")
135
International labour mobility
Nowadays, wages do not actually equalize, due to policies restricting immigration

136
Recap International trade often has strong effects on the distribution of income within countries -- produces losers as well as winners. Income distribution effects arise for two reasons: Factors of production cannot move costlessly and quickly from one industry to another Changes in an economy’s output mix have differential effects on the demand for different factors of production

Similar presentations


>")


: Sources of Comparative Advantage.>")