Download presentation
Presentation is loading. Please wait.

1
Arkansas StudentGPS Dashboards
End User Training Arkansas Department of Education

2
StudentGPS End User Training Agenda
Length/Time Introduction 10 mins Project Background 15 mins Dashboard Feature Video 5 mins Overview of Dashboard Features 25 mins Dashboard Demonstration 45 mins ASIS Overview 20 mins Questions 30 mins

3
The Ed-Fi Solution Developed by the Michael & Susan Dell Foundation
Open source, aligned to CEDS Utilizes ADE’s existing systems Provides relevant, timely information enabling educators to impact student learning through data-driven decision-making Currently licensed by 20 States including Texas, New York, Delaware, South Carolina, and Tennessee The Ed-Fi Solution, Developed by MSDF, was selected: Aligns to Common Educational Data Standards (CEDS) It fits well within our existing IT environment, Integrates with existing infrastructures Provides consistent and comparable performance data across schools, districts and programs Provides teachers with ongoing, actionable insights at the student and classroom level Enables proactive responses to academic problems as they arise Converges and organizes information from a broad range of data sources Designed to accommodate future innovations
 It fits well within our existing IT environment, Integrates with existing infrastructures. Provides consistent and comparable performance data across schools, districts and programs. Provides teachers with ongoing, actionable insights at the student and classroom level. Enables proactive responses to academic problems as they arise. Converges and organizes information from a broad range of data sources. Designed to accommodate future innovations.")
4
About the Dashboards

5
Arkansas Stakeholder Engagement Sessions
Stakeholders across the state were invited to provide feedback into the development of the Arkansas StudentGPS Dashboards ~525 stakeholders provided detailed feedback In-person workshop sessions were held at various locations across the state Northwest Wilbur D. Mills Southwest Arch Ford Jonesboro Webinars & Survey for participants unable to attend Northwest Co-op Farmington Jonesboro School District Wilbur D. Mills Co-op, Beebe Engaging with stakeholders to gather their input is a critical component in the design and development of new systems; Overview- The engagement meetings consist of holding in-person sessions and online demo and survey, all designed to capture feedback from relevant stakeholders. Meetings were targeted towards a range of end-users, including teachers, principals and district administrators, to provide differentiated feedback to guide the development process The feedback from actual users is reviewed and prioritized for incorporation Goals- The goals for the stakeholder meetings were to ensure that all participants: Understood the ADE vision Identified their own wants, needs, and requirements Felt confident that their opinions matter, were heard, and will continue to be welcome throughout the development process Arch Ford Co-op Southwest Co-op, Beebe

6
Multiple Points of Stakeholder Contact
A process of engagement was developed to gather continuous stakeholder feedback Commissioner’s memo with invitation to participate in stakeholder engagements Follow-up s sent to increase turnout Invitations Participants register online through ESCWorks Webinar/Survey registration via link (Registration followed up with confirmation Registration Locations across the state to target audience needs from across the state Webinar held for participants unable to attend an in-person session Locations Volunteer list of workshop participants from ~70 districts to provide additional feedback Continue to be leveraged for insight and guidance as needed Advisory Council

7
Frequently Questions About the Dashboards

8
Where Does the Information Come From?
AELS CCMS Licensure information from AELS or the Arkansas Educator Licensure System, Assessment information from Triand Course code management system pulls in the course information for the transcript piece to properly associate credit accumulation

9
How Much Do the StudentGPS Dashboards Cost?
There is no cost nor will there ever be a cost for the districts. We have been lucky enough to secure a significant amount of grant funding for the first two phases of development

10
Who Has Access to the Dashboards?
All districts will have access in the school year.

11
Why Should Our District Use the Dashboards?
Student Demographic Information Transcript Grades & Credits Student Growth Percentile Attendance Discipline State & Local Assessments 2012 survey time constraints system complexity

12
Dashboard Basic Feature Walk-Through

13
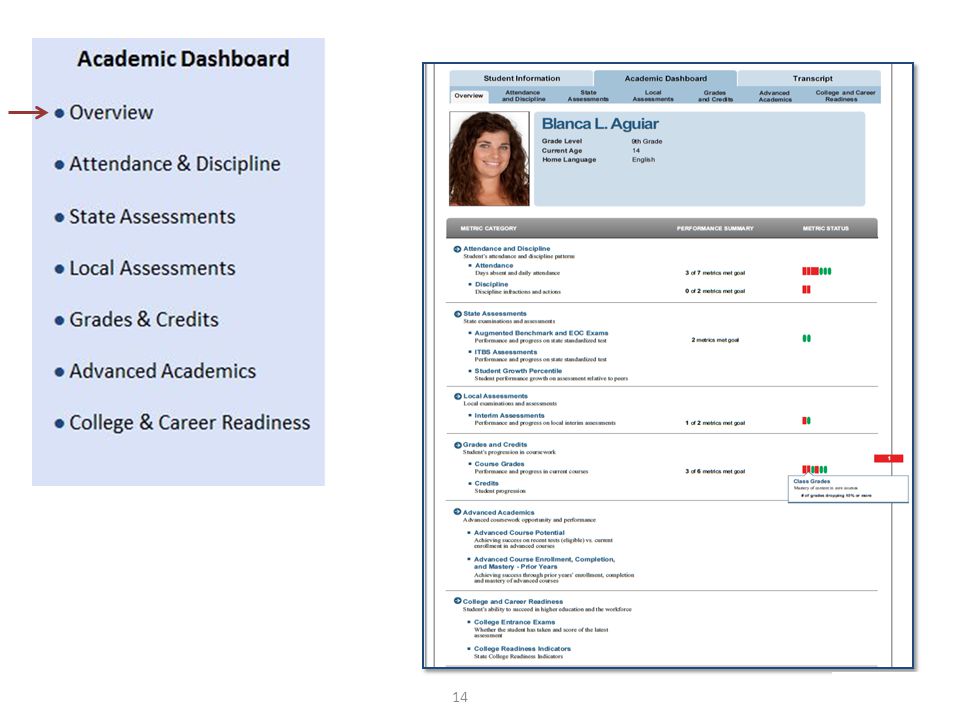
Student Information Parent/Guardian Information Emergency Contacts
Transportation Information Medical Alerts Academic Information Grade Level Expected Graduation Year Curriculum Plan GPA Program Status 504 Gifted/Talented Bilingual Program Other Student Information TAGG Homeless Migrant Retained

15
Hover over capability to see absence detail (why it was excused/unexcused)
")
17
Public Consulting Group (PCG), Northwest Evaluation Association (MAP), & The Learning Institute (TLI)
, Northwest Evaluation Association (MAP), & The Learning Institute (TLI)")
21
Questions

22
Dashboard Demonstration

23
Demo Objectives This training will explain how to…
Access the dashboards Navigate between metrics, views, and additional features Access assessment details, including strand level detail, prior year and subject specific view Create, edit, and search for Dynamic Watch Lists Local Assessment Upload Search for student records Submit a support ticket

24
Logging in to the StudentGPS Demo Site
This is an anonymized data set for demonstration and training purposes. The log-in credentials mimic a high school teacher’s landing page and access level. Open Internet Explorer or Firefox browser Go to Log In (Dependent Upon Role) User Name: 4401 EdFi School Administrator User Name: 4401 EdFi District Administrator User Name: 4401 EdFi Teacher Password: ade2013
 User Name: 4401 EdFi School Administrator. User Name: 4401 EdFi District Administrator. User Name: 4401 EdFi Teacher. Password: ade2013.")
25
Logging in to StudentGPS
To access your district’s dashboard, your superintendent must complete the required MOU and Active Directory forms. Once the paperwork is submitted, you must be assigned the appropriate Active Directory role. Open a web browser (The dashboards work with all platforms, but performs the best on Firefox) Go to Log In same as eSchool login Lea/name combination Example 4401kcraft
 Go to Log In same as eSchool login. Lea/name combination. Example 4401kcraft.")
26
Basic Navigation

27
Teacher Landing Page The landing is going to vary based upon the role assignment. Teachers land on this page and have an immediate look at the students enrolled in their courses. There is the drop down option available directly under the general overview that allows them to easily navigate to their courses If you have any students assigned to your role, you will land on the classroom overview.

28
Campus Landing Page and Navigation
This is a campus level employees landing page (administrators, counselors, interventionists, or any other contributing professional that has access across grades) School administrators will land on the Campus Overview page and can go to the Campus Information page to navigate to student lists.
 School administrators will land on the Campus Overview page and can go to the Campus Information page to navigate to student lists.")
29
Navigating to Student List from the School Level
My Student Lists – custom watch lists Campus student lists accessed by teachers will only contain students assigned to them, while administrators can see all students Administrators can access multiple student lists through Campus Information tab, including Students by Grade, Students by Demographic, and customized watch lists under My Student Lists.

30
Teacher Courses and Lists
My Student Lists – custom watch lists Campus student lists accessed by teachers will only contain students assigned to them, while administrators can see all students

31
Find Students & Schools Using Search Bar
Search capabilities vary by role and may include campuses, students, and teachers.

32
Customize the Data in View

33
Customize View

34
Add and Remove Data Columns can be added or removed in all classroom views and student lists using Customize View button.

35
Assessment Details

36
Student Benchmark Assessment Strands
The More button provides access to additional details such as assessment strands and historical performance charts for each student.

37
Key Functionality: Classroom Assessment Detail
Drop Down Menus allow a teacher to change views from all their students to students in certain sections and between exams taken. Classroom assessment detail view shows performance by assessment strand for the Augmented Benchmark and End-of-Course state assessments.

38
Assessment Detail (ITBS): Historical Performance
: Historical Performance")
39
Create, Edit, and Search for Dynamic Watch Lists

40
Create a Dynamic List Administrators can create watch lists from their student lists, but not from a teacher’s view. From all student lists, a filtered watch list can be created to monitor student progress over time.

41
Select Dynamic List Filters or Criteria
Once the filters have been selected, you have the option to share your lists and change the name. All changes must be saved.

42
Accessing Shared Dynamic Lists
Administrators can create watch lists from their student lists, but not from a teacher’s view.

43
Local Assessment Upload Feature

44
Local Assessment Tab and Selections

45
Local Assessment Templates

46
Results Page

47
Local Assessment- Strand Level Breakdown

48
Create a Support Ticket

49
Dashboard Support Function
Smackover Teacher Be sure to include the student name, ID #, and a description of the issue, including the metric name and expected result – providing more information results in better and quicker resolution of the issue.

50
View and Edit Interventions

51
Interventions Tab Local Assessments and the Interventions tab will be available in the dashboards in August 2014.

52
Arkansas Student Intervention System (ASIS)
Enables educators to create Academic Improvement Plans and Intensive Reading Interventions for students. Educators can also generate Student Academic Reports (SAR) for students.
 for students.")
53
Arkansas Student Intervention System (ASIS)
The Arkansas Student Intervention System (ASIS) was developed from stakeholder feedback across the state. Educators requested a user-friendly, web-based program for developing Academic Improvement Plans (AIP) and Intensive Reading Interventions (IRI). The ASIS pilot was from March 17th until April 18th and consisted of the following districts participating. Bald Knob School District Green County Tech School District Hoxie School District Jonesboro School District Monticello School District Nashville School District Poyen School District
 was developed from stakeholder feedback across the state. Educators requested a user-friendly, web-based program for developing Academic Improvement Plans (AIP) and Intensive Reading Interventions (IRI). The ASIS pilot was from March 17th until April 18th and consisted of the following districts participating. Bald Knob School District. Green County Tech School District. Hoxie School District. Jonesboro School District. Monticello School District. Nashville School District. Poyen School District.")
54
ASIS Benefits https://adeasis.arkansas.gov Free for all districts
Web-based (Educators can access from anywhere with internet access) Easy, convenient way to create/edit interventions for students Customizable interventions depending on student needs Print to PDF (includes signature line for parent/guardians) Integrates with StudentGPS
 Easy, convenient way to create/edit interventions for students. Customizable interventions depending on student needs. Print to PDF (includes signature line for parent/guardians) Integrates with StudentGPS.")
55
Not actual student data
Teacher Homepage Not actual student data

56
Intensive Reading Intervention

57
Intensive Reading Intervention (IRI)
Educators can complete the IRI by selecting the areas already identified or they have the flexibility add services to the IRI

58
Academic Improvement Plan (AIP)
AIPs can be created for any student in the following areas: Literacy Mathematics Science

59
Student Academic Report (SAR)
Educators can generate a SAR for any student at anytime throughout the year. Student Demographic Information Assessments Grades Attendance & Tardies Discipline

60
Key Considerations for the Dashboards
ADE is committed to continuous improvement of the dashboards – your feedback is vital to this improvement process. Relevance of the dashboard metrics depends on the timeliness and accuracy of available data - the majority of which is from eSchoolPlus. Verifying in eSchoolPlus should always be the first step in support. Some data is not currently available - historical results will accumulate over time as implementation moves forward.

61
What’s Required From Districts?
To use the dashboard you and your district must: Sign the Memorandum of Understanding (MOU) Sign the Student/GPS Ed-Fi Account Manager Form Establish an System Administrator Responsible for escalating technical support issues Resolving data anomalies in eSchool Create StudentGPS address to capture tech support s directly from the system Place users into Active Directory Groups School Level Administrators and Teachers must be in the ‘Staff Catalog’ within eSchoolPlus Offer training for teachers and administrators
 Sign the Student/GPS Ed-Fi Account Manager Form. Establish an System Administrator. Responsible for escalating technical support issues. Resolving data anomalies in eSchool. Create StudentGPS address to capture tech support s directly from the system. Place users into Active Directory Groups. School Level Administrators and Teachers must be in the ‘Staff Catalog’ within eSchoolPlus. Offer training for teachers and administrators.")
62
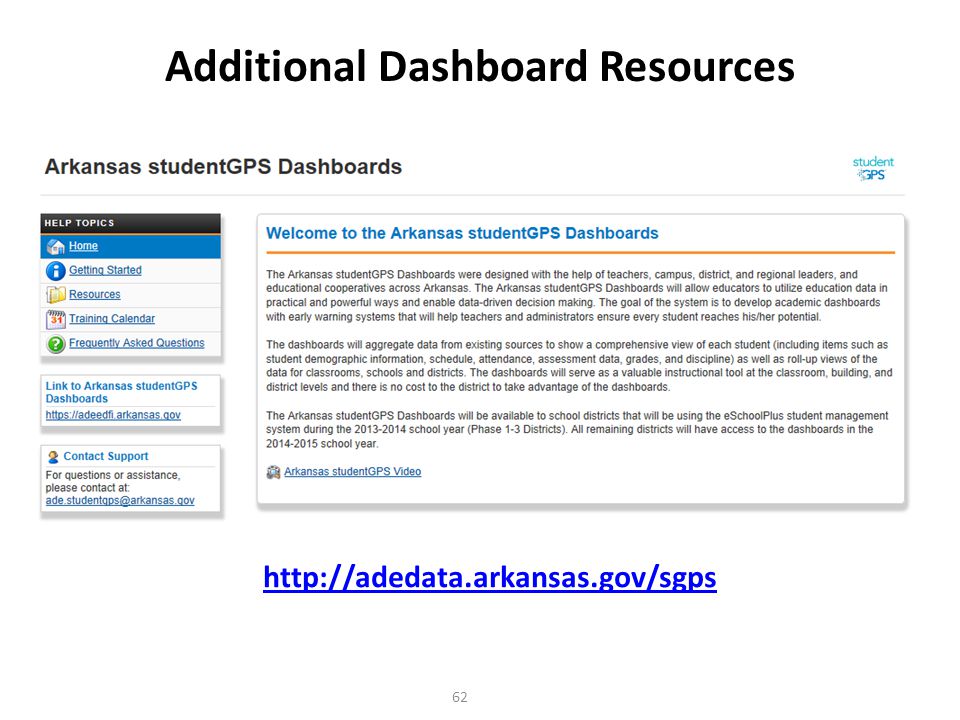
Additional Dashboard Resources
Similar presentations


 A tutorial for professional development cluster Vendors, Providers and Instructors Charlie Michels PSB.>")


>")


