Download presentation
Presentation is loading. Please wait.

1
Planning Process ► Early Transport Planning Engineering-oriented 1944, First “ O-D ” study Computational advances helped launch new era in planning

2
Planning Process ► Factors contributing to improved planning Rapid population growth Rapid car ownership growth Increased mobility More federal involvement in transportation

3
Planning Process ► 1963 Federal Aid Highway Act Instituted “ 3C ” process ► Continuing ► Comprehensive ► Cooperative Made federal funds contingent upon 3C process

4
Planning Process ► Feds also acted as technical assistance Technology transfer Manuals and guides Creation of standards ► Planning ► Analysis ► Implementation

5
Planning Process ► Federal involvement expanded What was just the Bureau of Public Roads soon became ► FHWA ► UMTA (now FTA) More requirements ► NEPA ► TSM ► TIP
 More requirements ► NEPA ► TSM ► TIP")
6
Planning Process ► Devolution in 1980s Feds became more or less “ advisory ” Mandates existed, but flexibility encouraged Planning didn ’ t change, transport patterns did

7
Planning Process ► Federal resurgence Recognizing regional travel patterns ► Multi-jurisdictional solutions required involvement at a higher level Tied transportation plans to environmental planning ► Transportation plans could not contribute to the degradation of air quality

8
Transportation and Land Development Cycle Land Use Change Increased Traffic Generation Increased Traffic Conflict Deterioration in Level-of-Service Arterial Improvements Increased AccessibilityIncreased Land Value

9
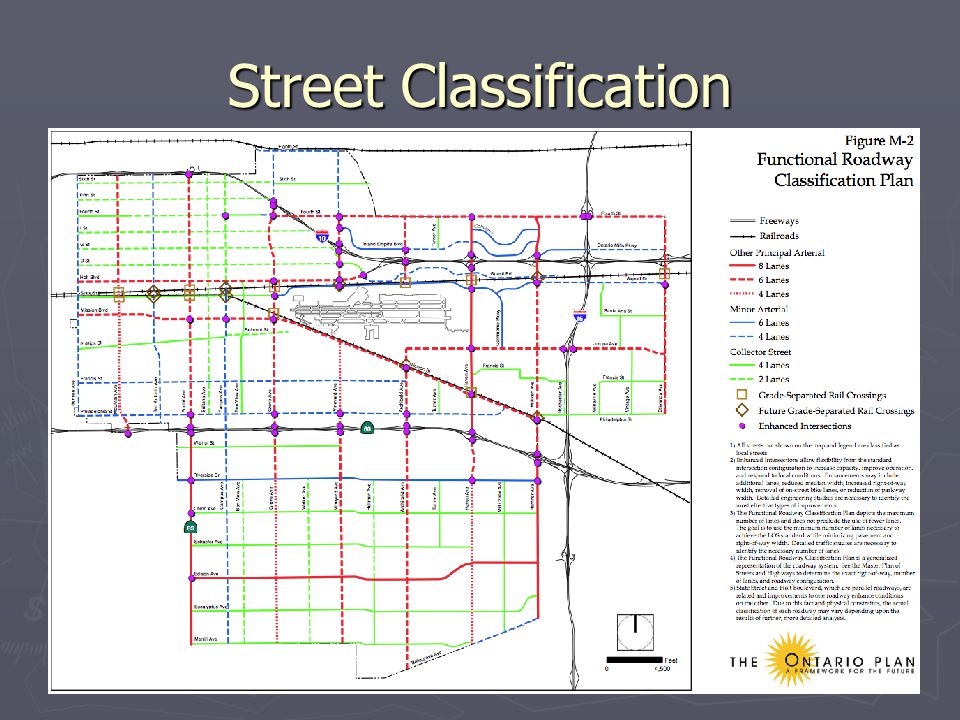
Street Classification

11
Transportation Planning Process Pre-Analysis Phase Problem/Issue Identification Formulation of Goals and Objectives Data Collection Generation of Alternatives Technical Analysis Phase Land Use Activity System Model UTMS (or, UTPS; or UTPP) Impact Prediction Models Post Analysis Phase Evaluation of Alternatives Decision Making Implementation of Plan Monitoring
 Impact Prediction Models Post Analysis Phase Evaluation of Alternatives Decision Making Implementation of Plan Monitoring")
12
Transportation Planning Process ► Inputs land use activity system transportation system characteristics ► Outputs Quantity (volume) Quality (speed) ► U.T.M.S. Trip Generation Trip Distribution Mode Choice Trip Assignment

13
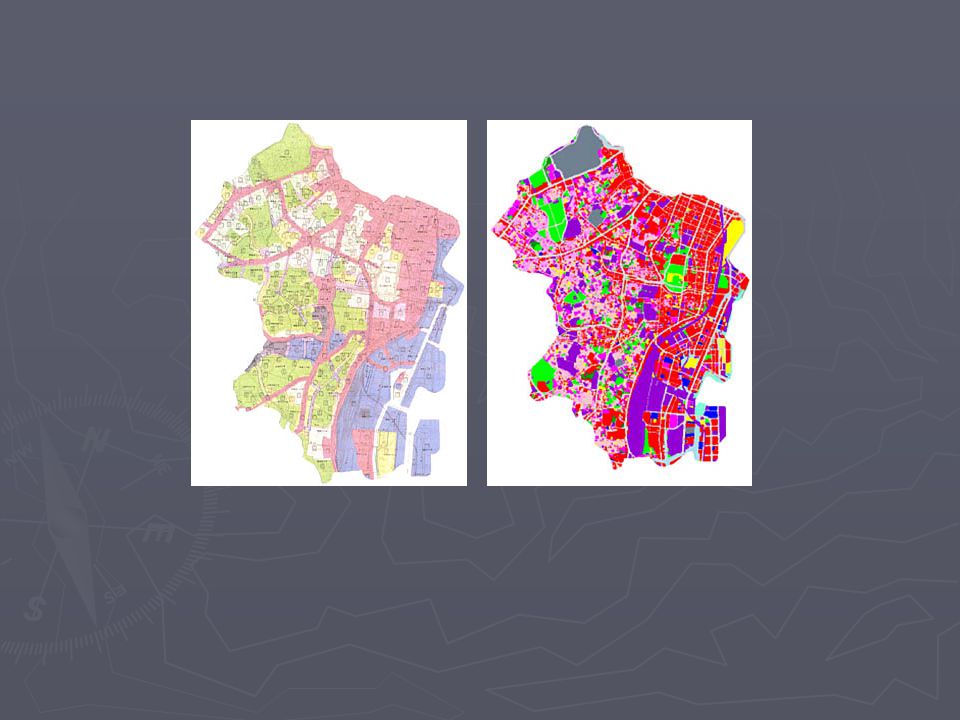
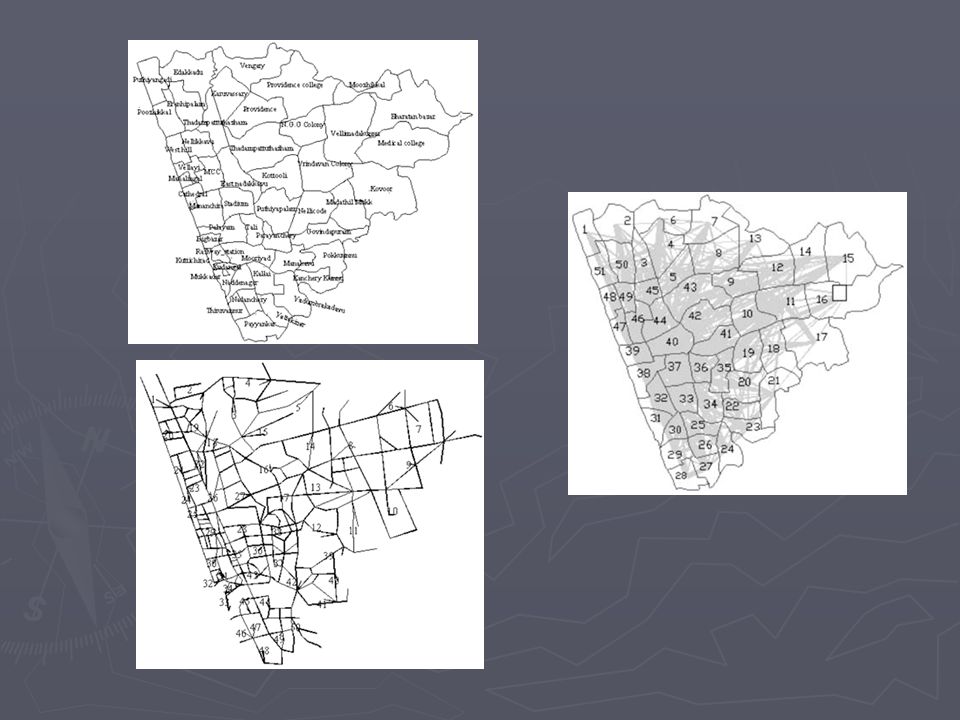
Inputs for UTMS ► Transportation System Characteristics Layout of transportation network Speed, Directionality, Turn Restrictions ► Land Use Activity System Characteristics Region divided into “ zones ” Each zone has its own unique characteristics ► land use ► social and economic attributes

18
Watauga County V/C Boone V/C

26
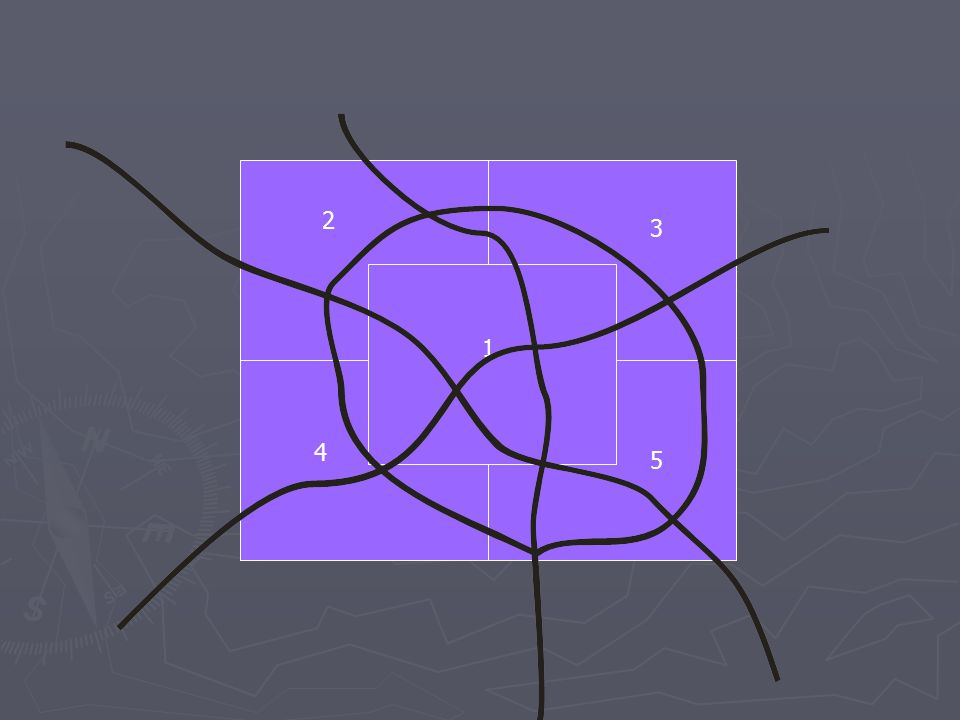
1 2 3 4 5
27
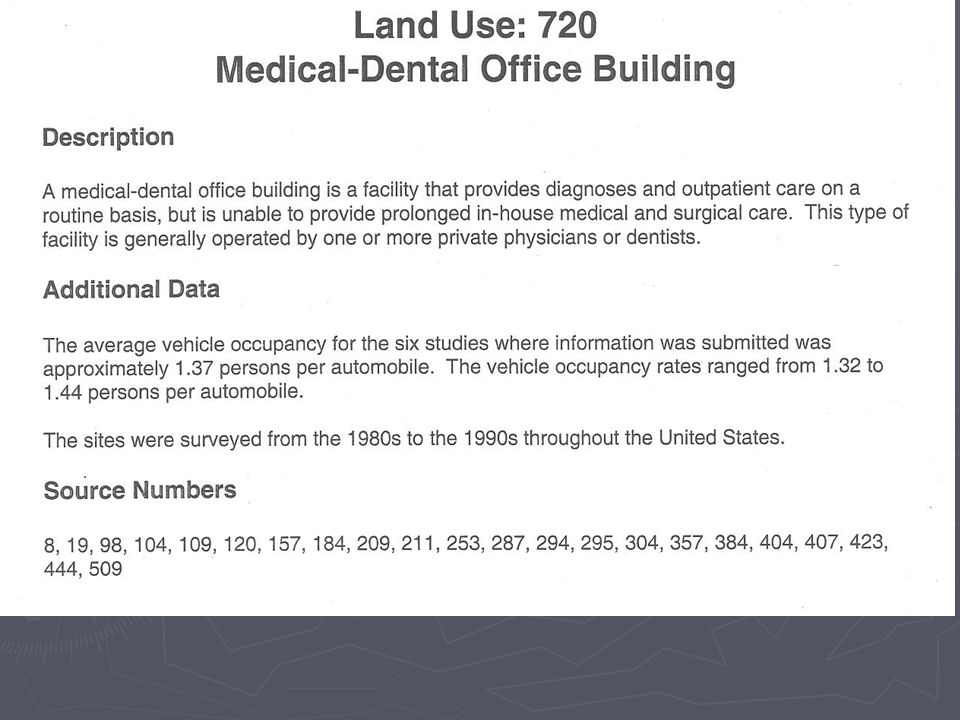
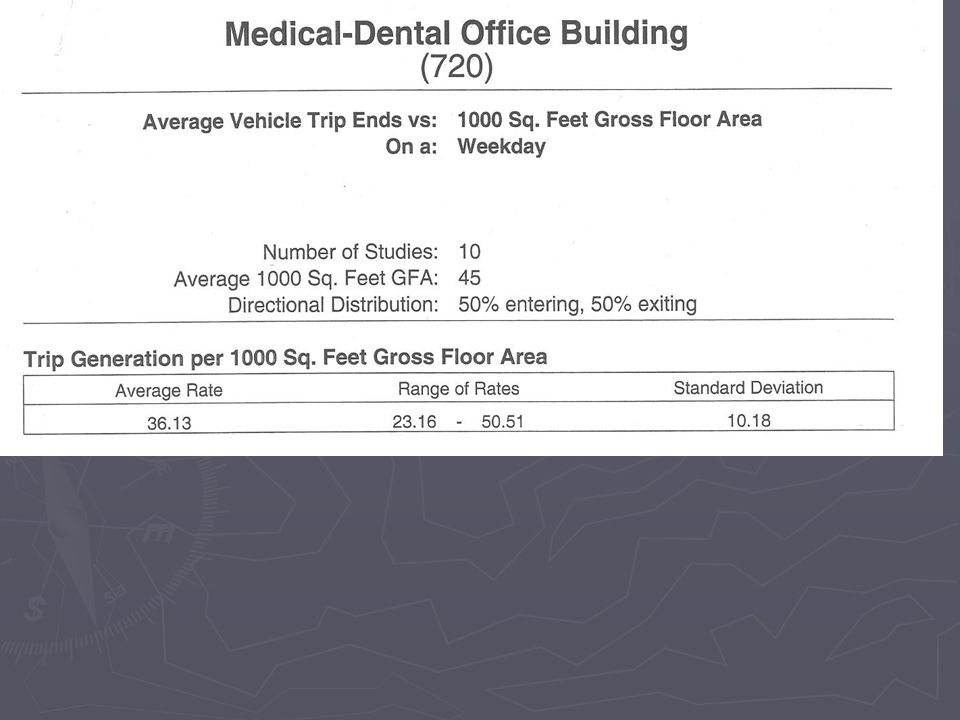
Urban Transportation Model System ► Trip Generation “ How many trips? ” Predicting quantity of travel to and from a piece of land Depends on characteristics of the land ► land use type and intensity ► socioeconomic characteristics of activities using the land

28
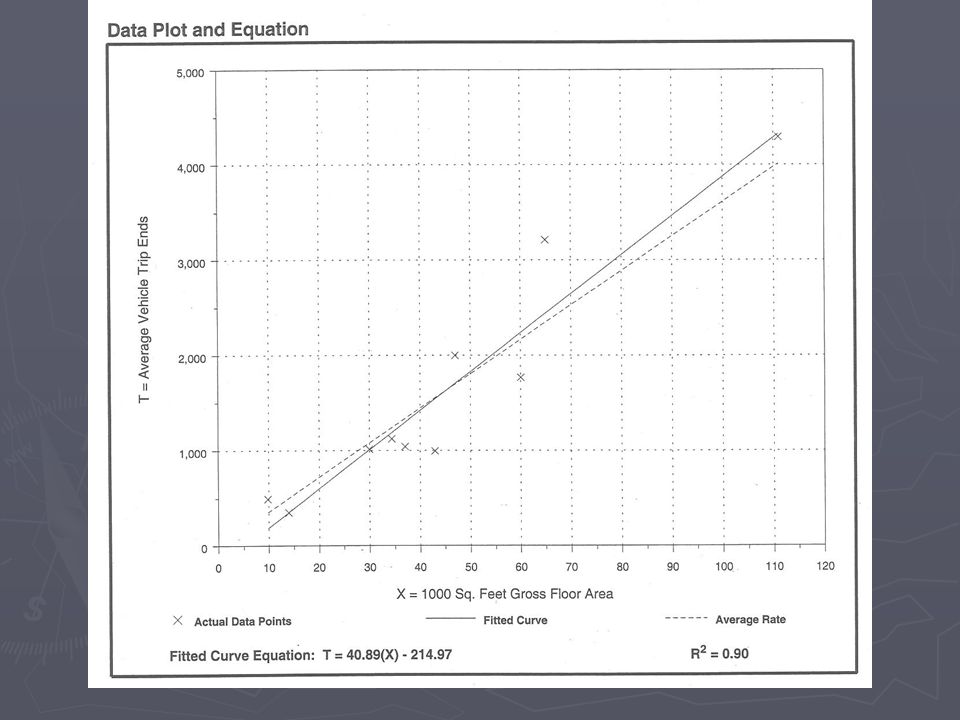
Linear Regression for TG

29
Urban Transportation Model System ► Trip Distribution “ Where do they go? ” Links origins and destinations ► how many from zone ‘ a ’ goes to all other zones? ► how many to zone ‘ a ’ comes from all other zones Dependent upon: ► attractiveness of zone ► “ friction ”, or difficulty of travel

30
Simple Gravity Model Tobler’s First Law of Geography: Everything is related to everything else, but near things are more related than distant things.

31
Intervening Opportunities # of trips # of opportunities at destination # of intervening opportunities calibrating constant

32
Urban Transportation Model System ► Mode Choice “ How do they travel? ” Predicts the share of travel by mode ► auto ► transit Dependent upon ► cost of travel by mode ► socioeconomic characteristics

33
Mode Choice Model VariableMeaning TTravel Time (in hours) CTravel Cost (in dollars) YAnnual Income (in 000’s) ModeTimeCost Drive0.502.00 Carpool0.751.00 Bus1.00.75 ModeY=40Y=10 Drive Carpool Bus
 CTravel Cost (in dollars) YAnnual Income (in 000’s) ModeTimeCost Drive Carpool Bus ModeY=40Y=10 Drive Carpool Bus")
34
Urban Transportation Model System ► Trip Assignment “ By what route? ” Predicting what parts of the network will be used to travel between origin and destination Dependent upon: ► all alternative routes (and their attractiveness) distance travel time perceived safety
 distance travel time perceived safety.")
35
Trip Assignment ► All or nothing Find shortest path for between two zones Load all trips on that path

36
Trip Assignment ► Incremental Loading (feedback) Split total flow in to subsets (i.e, 5% samples) Find shortest path between zones Load first 5% of trips onto that path Re-analyze shortest path Load next 5% of trips onto that path Repeat until total flow is dispensed with
 Split total flow in to subsets (i.e, 5% samples) Find shortest path between zones Load first 5% of trips onto that path Re-analyze shortest path Load next 5% of trips onto that path Repeat until total flow is dispensed with")
37
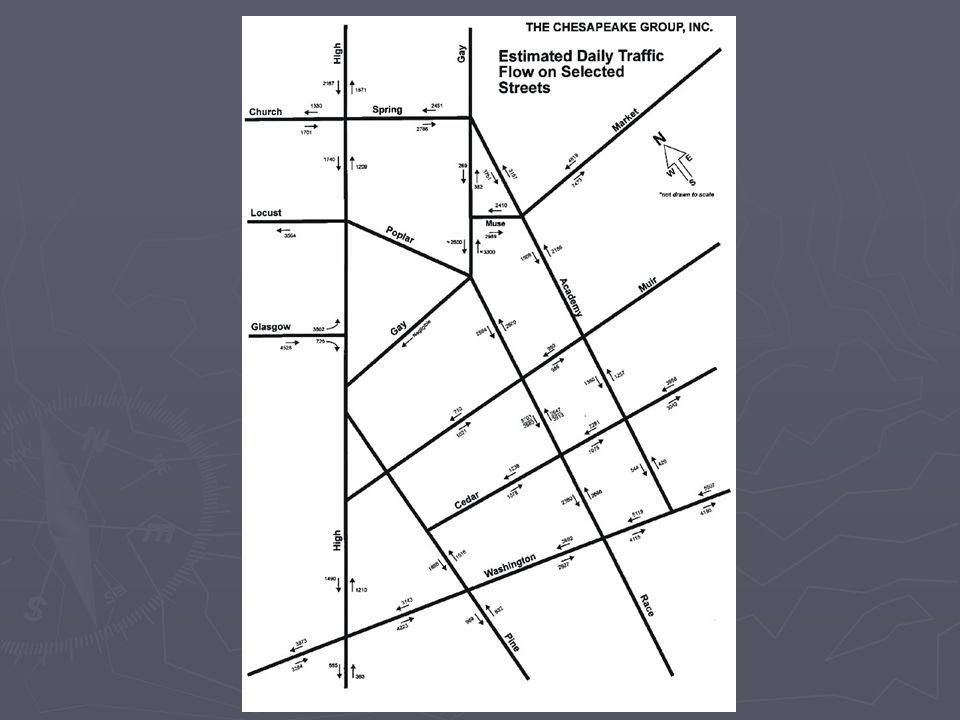
Output of UTMS ► Quantity Volume of traffic on network ► Quality Flow of traffic on network

38
Volume to Capacity Ratios (V/C) ► Traffic volume compared to the capacity of a segment of the network Different street classifications have different capacities ► v/c = 1: volume of traffic equals capacity ► v/c less than 1: capacity of street not met ► v/c greater than 1: traffic exceeds capacity
 ► Traffic volume compared to the capacity of a segment of the network Different street classifications have different capacities ► v/c = 1: volume of traffic equals capacity ► v/c less than 1: capacity of street not met ► v/c greater than 1: traffic exceeds capacity")
39
Levels of Service (LOS) Levels of Service (LOS) ► A Free Flow ► Freedom of Choice ► B Stable Flow (I) ► Choice slightly affected by others ► C Stable Flow (II) ► Choice significantly affected by others ► D High Density Flow ► Freedom to maneuver severely restricted ► E At or Near Capacity ► Unstable operations (small changes = large effects) ► F Breakdown Flow ► traffic approaching exceeds traffic exiting
 Levels of Service (LOS) ► A Free Flow ► Freedom of Choice ► B Stable Flow (I) ► Choice slightly affected by others ► C Stable Flow (II) ► Choice significantly affected by others ► D High Density Flow ► Freedom to maneuver severely restricted ► E At or Near Capacity ► Unstable operations (small changes = large effects) ► F Breakdown Flow ► traffic approaching exceeds traffic exiting")
40
From: Route 228 Improvement Project – Pennsylvania DOT

41
Impact Prediction Models ► Assessing the consequences of alternatives ► Using UTMS predictions as inputs to estimate: construction and operating costs energy consumption air quality noise levels accident rates

42
Further Readings/Review ► Transportation Models Transportation Models Transportation Models ► Impact Models Impact Models Impact Models

Similar presentations


. Gravity model 3 1 2 4 5 Where do the trips produced in TAZ 3 go? ? ? ? ?>")


 A Transportation Modeling Primer May, 1995 Edward A. Beimborn Center for Urban Transportation Studies.>")
: Traffic Analysis – Traffic assignment Learn how to assign generated and distributed trips to the street system approaching the site.>")
>")
, ch3.2-3.8 (C1) Get a general idea of urban planning theories (from rading p.333-342 (A)>")
