Download presentation
Presentation is loading. Please wait.

1
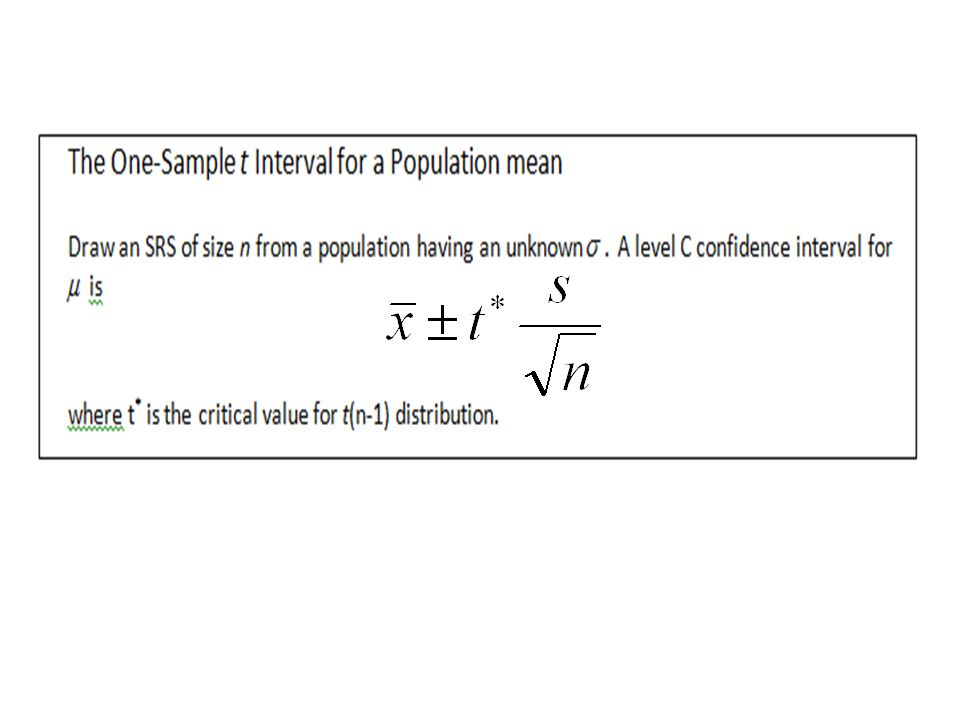
AP Statistics Section 10.2 A CI for Population Mean When is Unknown

2
In Section 10.1B, we constructed a confidence interval for the population mean when we knew the population standard deviation. It is extremely unlikely that we would actually know the population standard deviation, however.

3
In this section, we will discover how to construct a confidence interval for an unknown population mean when we don’t know the standard deviation. We will do this by estimating from the data.

4
This need to estimate with s introduces additional error into our calculations. To account for this, we will use a critical value of t * instead of z * when computing our confidence interval.

5
Note the following properties of a t distribution:

6
The density curves of the t distributions are similar in shape to the standard Normal, or z, distribution (i.e.

7
Unlike the standard Normal distribution, there is a different t distribution for each sample size n. We specify a particular t distribution by giving its __________________ ( _____ ). When we perform inference about using a t distribution, the appropriate degrees of freedom is equal to ______. We will write the t distribution with k degrees of freedom as _____.
. When we perform inference about using a t distribution, the appropriate degrees of freedom is equal to ______. We will write the t distribution with k degrees of freedom as _____..")
8
The spread of the t distributions is slightly greater than that of the z distribution. The t distributions are less concentrated around the mean and have more probability in the tails. This is what accounts for the increased error in using s instead of.

9
As the degrees of freedom increase, the t curve approaches the standard Normal curve ever more closely. This happens because s approximates more accurately as the sample size increases.

10
Table B, gives the values of t * for various degrees of freedom and various upper-tail probabilities. When the actual degrees of freedom does not appear in Table B, use the largest degrees of freedom that is less than your desired degrees of freedom.

11
Example: Determine the appropriate value of t * for a confidence interval for with the given confidence level and sample size. a) 98% with n = 22
 98% with n = 22.")
12
Example: Determine the appropriate value of t * for a confidence interval for with the given confidence level and sample size. b) 90% with n = 38
 90% with n = 38.")
13
TI 84:

14
As before, we need to verify three important conditions before we estimate a population mean.

15
SRS: Our data are a SRS of size n from the population of interest or come from a randomized experiment. This condition is very important.

16
Normality of : The population has a Normal distribution or : Use t procedures if sample data appears roughly Normal. : The t procedures can be used except in the presence of outliers or strong skewness in the sample data. The t procedures are robust. : The t procedures can be used even for clearly skewed distributions. However, outliers are still a concern. You may still refer to the Central Limit Theorem in this situation.

17
Independence: The method for calculating a confidence interval assumes that individual observations are independent. To keep the calculations reasonably accurate when we sample without replacement from a finite population, we should verify that the population size is at least _______________________(________).
..")
19
Example: A number of groups are interested in studying the auto exhaust emissions produced by motor vehicles. Here is the amount of nitrogen oxides (NOX) emitted by light-duty engines (grams/mile) from a random sample of size n = 46. Construct and interpret a 95% confidence interval for the mean amount of NOX emitted by light-duty engines of this type.
 emitted by light-duty engines (grams/mile) from a random sample of size n = 46. Construct and interpret a 95% confidence interval for the mean amount of NOX emitted by light-duty engines of this type..")
20
Parameter: The population of interest is ____________________. We want to estimate, the ____________________________.

21
Conditions: Since we do not know, use ______________________ SRS: Normality of : Independence:

22
Calculation:

23
Interpretation:

24
TI 83/84:

25
Standard Error When the standard deviation of a statistic, i.e., is estimated from the data, the result is called the standard error of the statistic.

26
Some textbooks simply refer to standard error as the standard deviation of the sampling distribution,, whether it is estimated from the data or not.

Similar presentations


>")


>")

